The aims of this study were to evaluate left ventricular (LV) systolic and diastolic function in obese adolescents with nonalcoholic fatty liver disease (NAFLD) using conventional echocardiography and pulsed-wave tissue Doppler imaging and to investigate the relations between LV function and carotid intima-media thickness (CIMT). LV remodeling, tissue Doppler–derived LV velocities, and cardiovascular risk profiles in obese adolescents with NAFLD were also studied. One hundred eighty obese adolescents and 68 healthy controls were enrolled in the study. LV end-diastolic and end-systolic and left atrial diameters and LV mass were higher in the 2 obese groups compared with controls. By pulsed-wave Doppler echocardiography and pulsed-wave tissue Doppler imaging, the NAFLD group had normal LV systolic function, impaired diastolic function, and altered global systolic and diastolic myocardial performance. In patients with NAFLD, LV mass was positively correlated with homeostasis model assessment of insulin resistance and serum alanine aminotransferase. CIMT was positively correlated with homeostasis model assessment of insulin resistance, alanine aminotransferase, and LV mass. By multiple stepwise regression analysis, alanine aminotransferase (β = 0.124, p = 0.026), homeostasis model assessment of insulin resistance (β = 0.243, p = 0.0001), LV mass (β = 0.874, p = 0.0001) were independent parameters associated with increased CIMT. In conclusion, insulin resistance has a significant independent impact on CIMT and LV remodeling in the absence of diabetes in patients with NAFLD. Pulsed-wave tissue Doppler imaging is suggested to detect LV dysfunction at an earlier stage in obese adolescents with NAFLD for careful monitoring of cardiovascular risk.
Patients with nonalcoholic fatty liver disease (NAFLD) have a higher prevalence of atherosclerosis, as shown by increased carotid intima-media thickness (CIMT), increased amounts of atherosclerotic plaque, and increased plasma markers of endothelial dysfunction, which are independent of obesity and other established risk factors. There is a positive correlation between cardiovascular risk factors, including obesity, dyslipidemia, hypertension, and diabetes, and the extent of early atherosclerotic lesions in the aorta and the coronary and carotid arteries. In asymptomatic adults and adults with coronary artery disease and hypertension, it has been shown that increased CIMT is a useful noninvasive indicator of decreased myocardial blood flow and regional systolic and diastolic myocardial dysfunction. Adult studies have shown that NAFLD has been associated with impaired left ventricular (LV) function, adverse changes in cardiac geometry, and increased LV mass. Abnormal LV mass and geometry are well established risk factors for cardiovascular events. Subclinical carotid atherosclerosis has been reported to be associated with impaired LV function and the development of heart failure. In the present study, we aimed to evaluate LV systolic and diastolic function in obese adolescents with NAFLD using conventional echocardiography and pulsed-wave tissue Doppler imaging (TDI) and to investigate if any relation exists between CIMT and LV function. We also studied LV remodeling, tissue Doppler–derived LV velocities, and cardiovascular risk profiles in obese adolescents with NAFLD.
Methods
One hundred eighty obese adolescents (86 female, 94 male; mean age 13.3 ± 1.3 years, range 12 to 17; mean body mass index [BMI] 29.9 ± 2.7 kg/m 2 ) were recruited from obese adolescents admitted to the pediatric endocrinology unit from December 2011 to July 2012. The obese group was divided into 2 subgroups: (1) patients with NAFLD (46 female, 51 male; mean age 13.2 ± 1.4 years; mean BMI 30.2 ± 2.6 kg/m 2 ) with high serum alanine aminotransferase (ALT) levels (>40 U/L) and ultrasound evidence of fatty changes in the liver and (2) patients without NAFLD (40 female, 43 male; mean age 13.3 ± 1.3 years; mean BMI 29.6 ± 2.8 kg/m 2 ) with low ALT levels (<40 U/L) without any ultrasound evidence of fatty changes in the liver. Control adolescents (33 female, 35 male; mean age 13.5 ± 1.3 years, range 12 to 17; mean BMI 19.2 ± 2.3 kg/m 2 ) were selected from nonobese healthy adolescents who were admitted to our hospital for minor illnesses such as common colds and conjunctivitis.
Patients were excluded if they had any systemic disease, including type 1 or type 2 diabetes mellitus; were taking medications; or had conditions known to affect insulin action or insulin secretion (e.g., glucocorticoid therapy, hypothyroidism, Cushing disease). The study protocols were approved by our hospital’s ethics committee (approval number 0.28.00.001/130-62). Signed informed consent forms were obtained from the parents of the adolescents.
Height and weight were measured with an empty bladder in postabsorptive conditions. BMI was calculated as weight in kilograms divided by the square of height in meters. Patients with BMIs ≥95th percentile according to reference curves for Turkish adolescents were accepted as obese. Waist circumference was measured midway between the lowest rib and the top of the iliac crest at the end of gentle expiration. Hip circumference was measured over the great trochanters. Pubertal developmental stage was assessed by a single pediatric endocrinologist using the Tanner criteria. Staging for sexual maturation was >2 in all patients (Tanner stages II to IV). After resting for ≥5 minutes, systolic and diastolic blood pressures (BPs) were measured in the sitting position, using a mercury-gravity manometer and a cuff appropriate for body size.
Fasting blood samples (at 8 a . m .) were obtained to measure serum glucose insulin levels and other parameters in the morning by venipuncture after an overnight fast (≥12 hours). Serum concentrations of total cholesterol, high-density lipoprotein cholesterol, and triglycerides were measured using routine enzymatic methods with an Abbott Diagnostics c16000 chemistry analyzer (Abbott Diagnostics, Lake Forest, Illinois). Serum insulin levels were measured using the IMMULITE immunoassay (Siemens Healthcare Diagnostics, Camberley, United Kingdom). Standard liver function tests (ALT and aspartate aminotransferase [AST]) were performed on the same day using an automated analyzer. Insulin resistance was estimated using homeostasis model assessment of insulin resistance (HOMA-IR) (fasting insulin concentration [μU/ml] × fasting glucose concentration [mmol/L]/22.5). Insulin resistance was defined in adolescents as HOMA-IR >3.16. Metabolic syndrome was defined according to the modified World Health Organization criteria adapted for children. Subjects were diagnosed as having metabolic syndrome if they met 3 of 4 World Health Organization criteria.
All patients with abnormally high serum transaminase levels and abnormal results on liver ultrasound were screened for other liver conditions (hepatitis B surface antigen, hepatitis C antibody, prothrombin time, serum iron level, total iron-binding capacity, ferritin, and antinuclear antibodies), which were all negative. Liver ultrasound was performed by a trained operator who was blinded to all clinical and laboratory characteristics of the participants. Scans were performed in all subjects using a Logiq 7 machine (GE Healthcare, Milwaukee, Wisconsin), equipped with a 7.5-MHz probe for younger adolescents and a 5-MHz probe for larger or markedly obese adolescents. The presence of NAFLD was assessed using the scoring system defined by Tominaga et al according to the hyperechogenicity of liver tissue and discrepancy between liver and diaphragm and visibility of vascular structures.
Carotid ultrasound studies were performed by a single radiologist, who was blinded to the clinical and laboratory status of the patients, using high-resolution B-mode ultrasonography (Logiq 7) using a high-resolution linear-array vascular transducer (14 MHz). An optimal 2-dimensional image of the common carotid artery was obtained in which the near and far wall intima-media complex was well visualized. After a 10-minute rest and according to standard guidelines, the M-mode curser was then placed 1 cm proximal to the beginning of the carotid artery bulb during end-diastole. CIMT was calculated by taking the mean value of 3 measurements. There was no evidence of carotid plaque formation in all obese and control groups.
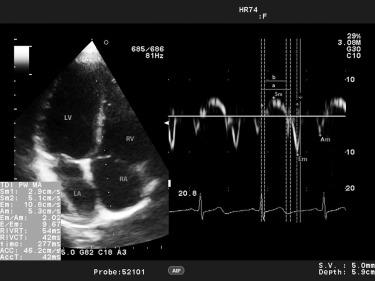
All echocardiographic and Doppler assessments were performed by a single expert pediatric cardiologist, who was blinded to the clinical and laboratory results of the study group. ProSound Alpha 7 (Aloka, Hitachi-Aloka Medical, Tokyo, Japan) with a 3-MHz phased-array transducer was used for each study subject. Conventional echocardiographic evaluation from the parasternal long-axis view included LV end-diastolic and end-systolic diameter, septal and LV posterior wall thicknesses in diastole and systole, the LV ejection fraction, and LV fractional shortening. Teichholz’s M-mode formula was used to calculate the LV ejection fraction and LV fractional shortening. All data were obtained according to the recommendations of the American Society of Echocardiography. Relative posterior wall thickness was calculated as (interventricular septal thickness in diastole + LV posterior wall thickness in diastole)/LV end-diastolic diameter. LV mass was calculated as 0.8{1.04[(LV end-diastolic diameter + LV posterior wall thickness + interventricular septal thickness) 3 − (LV end-diastolic diameter) 3 ]} + 0.6 and indexed to height 2.7 . Transmittal flow patterns were obtained by pulsed-wave Doppler echocardiography from the apical 4-chamber view. Peak early (E) and late (A) diastolic velocities, the E/A ratio, isovolumetric relaxation time, isovolumetric contraction time, and ejection time were measured. The Doppler-derived index of combined systolic and diastolic myocardial performance (Tei index; [isovolumetric relaxation time + isovolumetric contraction time]/ejection time) was used to quantify global LV function. A 5-mm pulsed-wave Doppler tracing was placed at the level of the basal and middle segments of the septal and lateral LV wall, and peak myocardial systolic (Sm), early (Em), and late diastolic (Am) velocities were measured from the apical 4-chamber view. Figure 1 shows an example of LV TDI measurements in 1 of our patients. The interval between the end of Am and the onset of Em (a) is equal to the sum of isovolumetric contraction time, isovolumetric relaxation time, and ejection time. Ejection time (b) was measured as the duration of Sm. The sum of isovolumetric contraction time and isovolumetric relaxation time was obtained by subtracting b from a. Then, the LV Tei index was calculated as (a − b)/b.
Continuous variables are expressed as mean ± SD (range). Normality assumptions were assessed before conducting parametric tests. When all groups were compared for parameters, analyses of variance were used; post hoc analysis was performed using Tukey’s honestly significantly different test. Bivariate associations of continuous variables were assessed using Pearson’s correlation coefficients. Stepwise multivariate linear regression was then used to determine which determinants independently explained a significant (p <0.05) fraction of the variance of the dependent variables. A p value <0.05 was considered to indicate statistical significance. Statistical analyses were performed using SPSS version 15.0 for Windows (SPSS, Inc., Chicago, Illinois).
Results
The characteristics of the patients and healthy controls are listed in Table 1 . The NAFLD and non-NAFLD obese groups were similar with respect to age, gender, BMI, and heart rate. The obese groups were further classified into 2 subgroups (those with and without metabolic syndrome) to determine the prevalence of metabolic syndrome in the NAFLD and non-NAFLD groups. Metabolic syndrome was present in 87 of 180 of all obese adolescents (48.6%), in 67 of 97 of those in the NAFLD obese group (69%), and in 20 of 83 of those in the non-NAFLD obese group (24%). The NAFLD obese group had significantly higher waist and hip circumferences and systolic and diastolic BPs than the non-NAFLD and control groups. The NAFLD obese group also had significantly higher serum AST, ALT, total cholesterol, triglyceride, low-density lipoprotein cholesterol, fasting glucose, and insulin levels and lower high-density lipoprotein cholesterol levels than the non-NAFLD and control groups. Waist and hip circumferences, BMI, systolic and diastolic BPs, and serum AST, ALT, total cholesterol, triglyceride, low-density lipoprotein cholesterol, fasting glucose, and insulin levels were significantly higher and high-density lipoprotein cholesterol levels lower in the non-NAFLD obese group compared with controls. The control group had lower HOMA-IR values than the non-NAFLD and NAFLD obese groups.
| Variable | Healthy Controls | Obese Subjects | |
|---|---|---|---|
| Non-NAFLD | NAFLD | ||
| Subjects (female/male) | 68 (33/35) | 83 (40/43) | 97 (46/51) |
| Age (yrs) | 13.5 ± 1.3 (12–17) | 13.3 ± 1.3 (12–17) | 13.2 ± 1.4 (12–17) |
| BMI (kg/m 2 ) | 19.2 ± 2.3 (15.1–23.8) | 29.7 ± 2.8 (24.3–36.1) † | 30.2 ± 2.6 (24.5–36.6) ‡ |
| Waist circumference (cm) | 68 ± 6 (56–82) | 88 ± 7 (70–110) † | 93 ± 8 (72–120) ∗ ‡ |
| Hip circumference (cm) | 86 ± 7 (70–95) | 105 ± 8 (88–124) † | 109 ± 9 (88–135) ∗ ‡ |
| Waist circumference/hip circumference ratio | 0.78 ± 0.05 (0.65–0.81) | 0.84 ± 0.05 (0.69–0.98) † | 0.84 ± 0.05 (0.67–0.95) ‡ |
| Systolic BP (mm Hg) | 101 ± 11 (80–120) | 114 ± 10 (90–140) † | 120 ± 12 (90–150) ∗ ‡ |
| Diastolic BP (mm Hg) | 65 ± 8 (50–80) | 74 ± 9 (50–90) † | 77 ± 9 (50–95) ∗ ‡ |
| Mean BP (mm Hg) | 77 ± 8 (60–93) | 87 ± 9 (67–103) † | 91 ± 9 (63–110) ∗ ‡ |
| Heart rate (beats/min) | 77 ± 9 (50–96) | 78 ± 8 (60–97) | 77 ± 7 (60–99) |
| Total cholesterol (mg/dl) | 140 ± 18 (89–176) | 166 ± 24 (108–217) † | 183 ± 31 (115–374) ∗ ‡ |
| Triglycerides (mg/dl) | 78 ± 30 (24–189) | 134 ± 62 (40–437) † | 153 ± 49 (42–270) ∗ ‡ |
| Low-density lipoprotein cholesterol (mg/dl) | 76 ± 17 (38–110) | 98 ± 21 (51–152) † | 113 ± 29 (58–282) ∗ ‡ |
| High-density lipoprotein cholesterol (mg/dl) | 48 ± 9 (34–78) | 42 ± 5 (29–55) † | 39 ± 7 (28–59) ∗ ‡ |
| Fasting glucose (mg/dl) | 80 ± 8 (61–107) | 89 ± 8 (69–111) † | 93 ± 8 (80–123) ∗ ‡ |
| Fasting insulin (U/ml) | 4.1 ± 1.8 (2–9) | 15.9 ± 9 (4–71) † | 22.7 ± 11.2 (8–81) ∗ ‡ |
| AST (U/L) | 18 ± 4 (12–33) | 22 ± 5 (10–39) † | 40 ± 4 (25–53) ∗ ‡ |
| ALT (U/L) | 14 ± 5 (5–31) | 25 ± 7 (10–41) † | 46 ± 4 (41–62) ∗ ‡ |
| HOMA-IR | 0.8 ± 0.4 (0.3–1.9) | 3.5 ± 2.1 (0.81–17.5) † | 5.3 ± 2.9 (1.6–20.9) ∗ ‡ |
∗ p <0.05, obese subjects without NAFLD versus obese subjects with NAFLD.
† p <0.05, controls versus obese subjects without NAFLD.
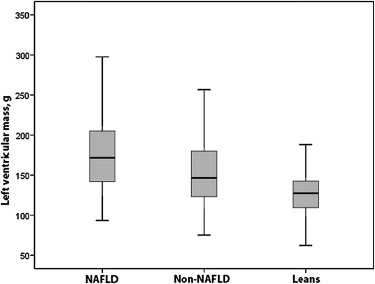
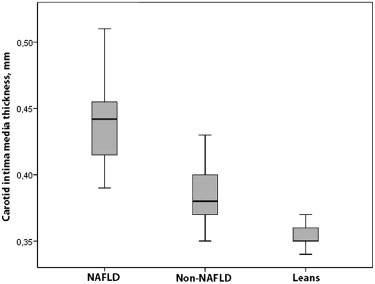
Conventional echocardiographic (2-dimensional, M-mode, and pulsed-wave Doppler) findings and CIMT results of the patients and controls are listed in Table 2 . The NAFLD obese group had significantly higher interventricular septal thickness in systole, LV posterior wall thickness in diastole, and left atrial and aortic diameters than the non-NAFLD and control groups. LV M-mode measurements were significantly larger in the non-NAFLD and NAFLD obese groups compared with controls. By conventional echocardiography, the LV ejection fraction and LV shortening fraction were similar in the obese and control groups. The non-NAFLD and NAFLD obese groups had significantly lower mitral E-wave and higher mitral A-wave measurements and therefore lower mitral E/A ratios than controls. Myocardial performance indexes calculated from pulsed-wave Doppler measurements were lower in the NAFLD group than in the non-NAFLD obese group. The NAFLD obese group had significantly higher CIMT, LV mass, and LV mass index than the non-NAFLD and control groups. The non-NAFLD group also had significantly higher CIMT, LV mass, and LV mass index than the control group ( Table 2 ; Figures 2 and 3 ).
| Variable | Controls (n = 68) | Obese Subjects | |
|---|---|---|---|
| Non-NAFLD (n = 83) | NAFLD (n = 97) | ||
| M-mode measurements | |||
| LV end-diastolic diameter (mm) | 42 ± 3.4 (31–50) | 44 ± 4 (35–57) † | 44.4 ± 5 (31–55) ‡ |
| LV end-systolic diameter (mm) | 25.4 ± 3 (17–34) | 26.5 ± 3.2 (19–38) | 26.9 ± 3.8 (17–36) ‡ |
| Interventricular septal diameter in diastole (mm) | 8.5 ± 1.5 (5–11.3) | 8.9 ± 1.9 (5–14) | 9.4 ± 2.1 (5–16) ‡ |
| Interventricular septal diameter in systole (mm) | 11 ± 1.5 (8–14) | 11.6 ± 2.1 (8–17) † | 12.3 ± 2 (8–17) ∗ ‡ |
| LV posterior wall diameter in diastole (mm) | 7.9 ± 1.5 (5–11) | 8.7 ± 1.5 (6–13) † | 9.6 ± 1.8 (7–15) ∗ ‡ |
| LV posterior wall diameter in systole (mm) | 11.4 ± 1.5 (7–14) | 12.5 ± 2.3 (8–18) † | 13 ± 2.4 (8–20) ‡ |
| LV ejection fraction (%) | 69 ± 6 (59–83) | 70 ± 6 (59–82) | 69 ± 6 (60–86) |
| LV fractional shortening (%) | 39 ± 5 (30–52) | 39 ± 5 (30–53) | 39 ± 5 (32–55) |
| Relative posterior wall thickness (mm) | 4 ± 0.7 (2.6–5.5) | 4 ± 0.7 (2.7–6.4) | 4.3 ± 0.9 (2.7–9.3) ‡ |
| LV mass (g) | 126 ± 29 (62–233) | 154 ± 44 (75–270) † | 175 ± 47 (93–321) ∗ ‡ |
| LV mass index (g/m 2.7 ) | 37 ± 9 (19–65) | 45 ± 10 (29–70) † | 49 ± 12 (27–91) ∗ ‡ |
| Left atrial dimension (mm) | 24 ± 3 (16–30) | 29 ± 4 (21–41) † | 31 ± 5 (21–41) ∗ ‡ |
| Aortic diameter (mm) | 21 ± 2.6 (16–27) | 22 ± 2.6 (16–28) | 23 ± 2.8 (16–31) ∗ ‡ |
| Doppler diastolic indexes | |||
| Peak early diastolic wave (m/s) | 0.88 ± 0.17 (0.53–1.4) | 0.82 ± 0.14 (0.49–1.1) † | 0.84 ± 0.13 (0.6–1.2) |
| Peak late diastolic wave (m/s) | 0.53 ± 0.12 (0.35–0.83) | 0.54 ± 0.11 (0.32–0.85) | 0.55 ± 0.11 (0.33–0.85) |
| Peak early diastolic wave/peak late diastolic wave ratio | 1.71 ± 0.41 (0.91–2.84) | 1.56 ± 0.34 (1–2.86) † | 1.56 ± 0.32 (1.05–2.47) ‡ |
| LV myocardial performance index | 0.513 ± 0.151 (0.2–0.65) | 0.541 ± 0.143 (0.2–0.7) | 0.485 ± 0.127 (0.2–0.7) ∗ |
| CIMT (mm) | 0.354 ± 0.009 (0.34–0.37) | 0.383 ± 0.019 (0.35–0.43) † | 0.437 ± 0.028 (0.39–0.51) ∗ ‡ |
∗ p <0.05, obese subjects without NAFLD versus obese subjects with NAFLD.
† p <0.05, controls versus obese subjects without NAFLD.
In the non-NAFLD and NAFLD obese groups, regional systolic and/or diastolic myocardial functional abnormalities were observed in the interventricular septum and LV lateral wall ( Table 3 ). In the basal and mid septal walls, the non-NAFLD and NAFLD obese groups had higher Sm, Am, and myocardial performance index values than the controls. Em and the Em/Am ratio were lower in the NAFLD obese group compared with controls. In the basal lateral LV wall, the NAFLD obese group had higher Am than controls. In the mid lateral LV wall, the NAFLD obese group had higher Am and myocardial performance index values than controls. Sm and the Em/Am ratio were lower in the non-NAFLD and NAFLD obese group compared with controls.
| Variable | Controls (n = 68) | Obese Subjects | |
|---|---|---|---|
| Non-NAFLD (n = 83) | NAFLD (n = 97) | ||
| Basal septal wall | |||
| Peak myocardial systolic velocity (cm/s) | 8.8 ± 1.2 (6.4–12.6) | 9.3 ± 1.4 (6.6–14.2) ∗ | 9.7 ± 1.6 (6–13.6) † |
| Peak myocardial early diastolic velocity (cm/s) | 14.3 ± 2.5 (7.5–19.6) | 13.5 ± 2.3 (8.8–21.6) | 13.1 ± 2.2 (9.1–19.7) † |
| Peak myocardial late diastolic velocity (cm/s) | 7.4 ± 1.9 (4.4–13.2) | 8.1 ± 1.6 (5.4–13) ∗ | 8.6 ± 2.1 (4.2–15) † |
| Peak myocardial early diastolic velocity/peak myocardial late diastolic velocity ratio | 2.0 ± 0.5 (0.8–3.9) | 1.7 ± 0.4 (1.0–3.1) ∗ | 1.6 ± 0.5 (0.8–3.6) † |
| LV myocardial performance index | 0.444 ± 0.076 (0.280–0.592) | 0.477 ± 0.077 (0.275–0.706) ∗ | 0.474 ± 0.084 (0.269–0.714) † |
| Mid septal wall | |||
| Peak myocardial systolic velocity (cm/s) | 6.2 ± 1.4 (4.3–11.9) | 6.8 ± 1.3 (4.5–11.7) ∗ | 6.9 ± 1.5 (4.7–13) † |
| Peak myocardial early diastolic velocity (cm/s) | 11.8 ± 2.2 (7.3–18.5) | 10.9 ± 2.2 (3.5–19.7) ∗ | 11 ± 2.2 (5.9–19.7) † |
| Peak myocardial late diastolic velocity (cm/s) | 5.2 ± 1.2 (2.8–9.9) | 5.9 ± 1.2 (3.4–10.4) ∗ | 6.3 ± 1.5 (3.5–12.5) † |
| Peak myocardial early diastolic velocity/peak myocardial late diastolic velocity ratio | 2.3 ± 0.6 (1.3–4.3) | 1.9 ± 0.5 (0.5–3) ∗ | 1.8 ± 0.5 (1–3) † |
| LV myocardial performance index | 0.423 ± 0.082 (0.244–0.666) | 0.502 ± 0.081 (0.296–0.671) ∗ | 0.516 ± 0.094 (0.318–0.860) † |
| Basal lateral LV wall | |||
| Peak myocardial systolic velocity (cm/s) | 11.3 ± 2 (7.3–17.4) | 11.3 ± 2.3 (7.4–19.5) | 11.1 ± 2.1 (7.3–18.1) |
| Peak myocardial early diastolic velocity (cm/s) | 19 ± 3.8 (7.1–26.7) | 17.7 ± 3 (6.5–26.1) ∗ | 17.6 ± 3.2 (7.4–28) † |
| Peak myocardial late diastolic velocity (cm/s) | 7.6 ± 2 (4.1–14) | 8.5 ± 1.7 (4.8–13.6) ∗ | 8.7 ± 1.8 (4.4–13.8) † |
| Peak myocardial early diastolic velocity/peak myocardial late diastolic velocity ratio | 2.6 ± 0.8 (0.85–5.5) | 2.2 ± 0.5 (0.8–4) ∗ | 2 ± 0.5 (0.9–3.9) † |
| LV myocardial performance index | 0.439 ± 0.073 (0.269–0.751) | 0.444 ± 0.090 (0.267–0.756) | 0.431 ± 0.077 (0.303–0.703) |
| Mid lateral LV wall | |||
| Peak myocardial systolic velocity (cm/s) | 10.8 ± 2.7 (5.1–20.5) | 9.7 ± 2.4 (5.8–18) ∗ | 9.7 ± 2.6 (5.6–19.5) † |
| Peak myocardial early diastolic velocity (cm/s) | 17.4 ± 3.2 (8–25) | 16.9 ± 2.8 (11–25) | 16.8 ± 3.1 (8–24) |
| Peak myocardial late diastolic velocity (cm/s) | 6.5 ± 1.7 (4–12.5) | 7.3 ± 1.6 (4.1–11.5) ∗ | 7.8 ± 1.7 (4.7–12.3) † |
| Peak myocardial early diastolic velocity/peak myocardial late diastolic velocity ratio | 2.8 ± 0.8 (1.18–4.63) | 2.4 ± 0.7 (1–3.9) ∗ | 2.3 ± 0.6 (1–3.6) † |
| LV myocardial performance index | 0.433 ± 0.084 (0.216–0.643) | 0.446 ± 0.090 (0.240–0.685) | 0.468 ± 0.082 (0.249–0.704) † |
∗ p <0.05, controls versus obese subjects without NAFLD.
In the non-NAFLD and NAFLD obese groups, CIMT was positively correlated with age, BMI, waist and hip circumferences, systolic and diastolic BPs, total cholesterol, low-density lipoprotein cholesterol, fasting glucose, HOMA-IR, and serum AST and ALT levels ( Table 4 ). CIMT was positively correlated with LV end-diastolic diameter, LV end-systolic diameter, interventricular septal thickness in diastole and systole, LV posterior wall thickness in diastole and systole, relative posterior wall thickness, LV mass, LV mass index, left atrial dimension, and aortic diameter. There was no significant correlation between CIMT and pulsed-wave Doppler echocardiographic parameters ( Table 5 ).
| Variable | Non-NAFLD | NAFLD | ||
|---|---|---|---|---|
| r | p Value | r | p Value | |
| Age | 0.387 | <0.0001 ∗ | 0.339 | 0.001 ∗ |
| BMI | 0.379 | <0.0001 ∗ | 0.298 | 0.003 ∗ |
| Waist circumference | 0.370 | 0.001 ∗ | 0.278 | 0.006 ∗ |
| Hip circumference | 0.529 | <0.0001 ∗ | 0.380 | <0.0001 ∗ |
| Waist circumference/hip circumference ratio | −0.140 | 0.204 | −0.114 | 0.264 |
| Systolic BP | 0.385 | <0.0001 ∗ | 0.383 | <0.0001 ∗ |
| Diastolic BP | 0.287 | <0.0001 ∗ | 0.344 | <0.0001 ∗ |
| Heart rate | −0.187 | 0.089 | −0.019 | 0.850 |
| Total cholesterol | 0.335 | <0.0001 ∗ | 0.328 | 0.001 ∗ |
| Triglycerides | 0.121 | 0.104 | 0.064 | 0.536 |
| Low-density lipoprotein cholesterol | 0.366 | <0.0001 ∗ | 0.375 | <0.0001 ∗ |
| High-density lipoprotein cholesterol | −0.156 | 0.072 | −0.194 | 0.057 |
| Fasting glucose | 0.275 | 0.012 ∗ | 0.306 | 0.002 ∗ |
| Fasting insulin | 0.212 | 0.052 | 0.652 | <0.0001 ∗ |
| AST | 0.292 | 0.001 ∗ | 0.494 | <0.0001 ∗ |
| ALT | 0.258 | 0.001 ∗ | 0.373 | <0.0001 ∗ |
| HOMA-IR | 0.558 | <0.0001 ∗ | 0.637 | <0.0001 ∗ |
Stay updated, free articles. Join our Telegram channel

Full access? Get Clinical Tree


