The aim of this study was to use 3-dimensional (3D) speckle-tracking echocardiography to test the hypothesis that left ventricular (LV) dyssynchrony may negatively affect LV torsional mechanics in patients with idiopathic dilated cardiomyopathy (IDC) and that LV torsion may improve after cardiac resynchronization therapy. This study included 65 subjects; 20 with IDC with ejection fractions ≤35% and wide QRS complexes (≥120 ms), 20 with IDC with ejection fractions ≤35% and narrow QRS complexes (<120 ms), and 25 controls. LV dyssynchrony index was determined as the SD of time to peak 3D speckle-tracking radial strain and regional heterogeneity of LV rotation (rotational dispersion index) as the SD of 3D speckle-tracking time to peak rotation. All rotational indexes were significantly impaired in patients with IDC, while LV torsion in patients with IDC with wide QRS complexes was significantly smaller than that in patients with IDC with narrow QRS complexes and controls. Conversely, LV dyssynchrony index (127.3 ± 24.0 ms [p <0.01 vs controls and vs patients with narrow QRS complexes] vs 88.8 ± 22.5 ms [p <0.01 versus controls] vs 30.9 ± 10.0 ms) and rotational dispersion index (115.1 ± 27.5 ms [p <0.01 vs controls and vs patients with narrow QRS complexes] vs 96.0 ± 23.4 ms [p <0.01 versus controls] vs 45.0 ± 13.7 ms) were significantly higher in patients with IDC with wide QRS complexes. Multivariate analysis showed that the LV ejection fraction (β = 0.688, p <0.001) and rotational dispersion index (β = −0.249, p <0.01) were independent determinants of LV torsion. Moreover, LV torsion in patients with IDC with wide QRS complexes improved after cardiac resynchronization therapy (p <0.05), along with reductions in LV dyssynchrony and rotational dispersion indexes. In conclusion, these findings obtained with a novel 3D speckle-tracking system feature a novel aspect of LV torsional mechanics and demonstrate its association with LV dyssynchrony.
Left ventricular (LV) torsional deformation is generated by the contraction of the 3-dimensional (3D) spiraling myofibers in the left ventricle. Because of its direct relation to fiber orientation, LV torsion is a valuable addition to strain measures such as longitudinal or circumferential shortening or radial thickening. Several studies have shown that 2-dimensional (2D) speckle-tracking imaging yields results equivalent to those obtained with magnetic resonance imaging for measuring LV torsion. However, because of the 3D nature of cardiac deformation, 2D speckle tracking may not be robust enough for the measurement of LV torsion. A newly developed 3D speckle-tracking system can provide a simultaneous comprehensive evaluation of LV torsional mechanics and dyssynchrony, without assumptions. We therefore used 3D speckle-tracking echocardiography to test the hypotheses that (1) LV dyssynchrony may negatively affect LV torsional mechanics in patients with idiopathic dilated cardiomyopathy (IDC) and (2) LV torsion may improve after cardiac resynchronization therapy (CRT).
Methods
The study group consisted of 73 subjects. Four patients (5%) were excluded from all subsequent analyses because of suboptimal quality of images, and we also excluded 4 patients (5%) with atrial fibrillation. Accordingly, the final study group consisted of 65 subjects: 20 patients with IDC with LV ejection fractions (LVEFs) ≤35% and narrow QRS complexes (<120 ms), 20 patients with IDC with LVEFs ≤35% and wide QRS complexes (≥120 ms) refereed for CRT, and 25 age-matched healthy volunteers. The diagnosis of IDC was established by (1) the presence of LV dilation; (2) a reduced LVEF; (3) coronary angiographic evidence of no coronary artery disease, defined as >75% stenosis of a major epicardial vessel or a history of myocardial infarction; (4) absence of primary valvular heart disease; and (5) absence of cardiac muscle disease secondary to any known systemic diseases. At the time of enrollment, all patients were in clinically stable condition and had no evidence of fluid retention and were receiving optimal pharmacologic therapy. Of 20 patients with IDC with wide QRS complexes, 12 underwent CRT. The atrioventricular interval was optimized for maximal diastolic filling using Doppler echocardiography in all 12 patients 7 ± 1 days after CRT. This study was approved by the local ethics committee of our institution, and written informed consent was obtained from all patients.
All echocardiographic studies were performed with a 2.5-MHz 3D matrix-array transducer using a commercially available echocardiographic system (Aplio Artida; Toshiba Medical Systems, Tochigi, Japan). The patients who underwent CRT were studied at baseline, acute follow-up at 7 ± 1 days, and midterm follow-up at 3 ± 1 months after CRT. Digital 3D volume data were obtained from the apical view using a 6-beat electrocardiographically gated acquisition. Sector width was optimized to allow complete myocardial visualization, while the volume rate was maximized. The mean volume rate was 22 ± 2 volumes/s for grayscale imaging used for 3D speckle-tracking analysis. Digital data were transferred to dedicated software (Ultra Extend; Toshiba Medical Systems) for all subsequent off-line analyses. Three-dimensional speckle-tracking analysis was performed as previously described in detail. Briefly, the acquisition of a full-volume data set requires 6 smaller wedge-shaped subvolumes from 6 consecutive cardiac cycles obtained during 1 breath hold, which are then combined to yield a larger pyramidal volume. Regions of interest are placed on the endocardium and epicardium using apical views, and the software automatically tracks the endocardial and epicardial contours in the subsequent volumes. On the basis of these contours, LV end-diastolic volume and end-systolic volume can then be obtained from the LV volume curves as the respective maximum and minimum values. The LVEF and LV mass index were also obtained automatically.
LV rotational indexes were determined by means of 3D speckle-tracking from 5 different cross sections, as previously described in detail ( Figure 1 ) . Briefly, the gravity of each short-axis plane is created from the average of points defining the short-axis contour, and the rotation center is defined by the center of gravity of each short-axis plane in each frame. The software automatically divides the left ventricle into 16 standard segments and shows the degree of rotation for each segment. Rotation is defined as the angular displacement of each LV segment around the LV central axis. Clockwise rotation as viewed from the apex is expressed as a negative value and counterclockwise rotation as a positive value. The degree of rotation for the base and the apex are then computed by calculating the means of their segments ( Figure 2 ). To assess synchrony between basal and apical rotation, the time interval of peak rotation (apical-basal rotational delay) is obtained ( Figure 2 ). LV twist is calculated as the net difference of LV rotation at isochronal time points between apical and basal segments and LV torsion as LV twist divided by LV longitudinal length at each corresponding time point ( Figure 2 ).
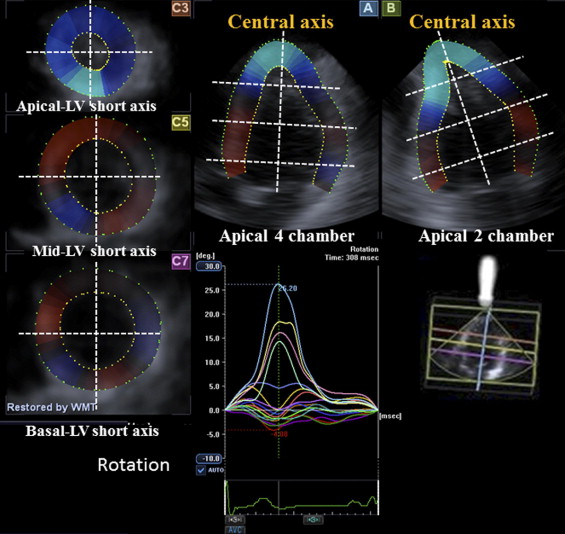

LV dyssynchrony (dyssynchrony index) was quantified from all 16 LV segments as the SD of time to peak radial strain ( Figure 3 ) . Similarly, the rotational dispersion index, as an index of disparity of the timing of the regional rotation, was quantified from all 16 LV segments as the SD of time to peak rotation ( Figure 3 ).

Continuous variables are expressed as mean ± SD or as percentages, while categorical data are summarized as frequencies and percentages. Clinical and echocardiographic measurements of the subgroup of patients with IDC with narrow or wide QRS complexes and of controls were compared using one-way analysis of variance, and post hoc analysis was then performed using Scheffé’s method. Group comparisons between before and after CRT were performed using paired t tests. Proportional differences were evaluated using Fisher’s exact tests or chi-square tests as appropriate. Univariate linear regression analysis was initially used to assess the relation between LV torsion and parameters of remodeling and dyssynchrony. Multiple linear regression analysis on the basis of stepwise selection was then performed for an analysis of independent determinants of LV torsion. The intraclass correlation coefficient was used to determine inter- and intraobserver reproducibility from 10 randomly selected subjects. For all steps, p values <0.05 were considered statistically significant. SPSS version 13.0 (SPSS, Inc., Chicago, Illinois) were used for all calculations.
Results
The baseline clinical and echocardiographic characteristics of the 65 subjects are presented in Table 1 . No significant differences were noted in age, gender, body surface area, or heart rate among the 3 groups. Of 20 patients with IDC with wide QRS complexes, 8 were in complete left bundle branch block, 7 were in intraventricular conduction delay, and 5 were in right ventricular apical pacing. As expected, patients with IDC exhibited significant LV remodeling compared to control subjects, while the 2 groups of patients with IDC showed similar global LV remodeling, including LV volumes, LVEF, LV mass index, and sphericity index. Patients with IDC with narrow QRS complexes were more likely to show greater LV dyssynchrony than control subjects (89 ± 23 vs 31 ± 10 ms, p <0.01), and the dyssynchrony index was much higher for patients with IDC with wide QRS complexes than those with narrow QRS complexes (127 ± 24 vs 89 ± 23 ms, p <0.001) ( Table 1 ).
| Variable | Controls (n = 25) | Patients With IDC | |
|---|---|---|---|
| Narrow QRS Complex (n = 20) | Wide QRS Complex (n = 20) | ||
| Age (years) | 65 ± 15 | 67 ± 17 | 66 ± 11 |
| Men/women | 18/7 | 17/3 | 17/3 |
| Body surface area (m 2 ) | 1.60 ± 0.2 | 1.67 ± 0.2 | 1.60 ± 0.2 |
| Systolic blood pressure (mm Hg) | 126 ± 16 | 110 ± 19 ⁎ | 114 ± 23 ⁎ |
| Diastolic blood pressure (mm Hg) | 70 ± 11 | 65 ± 14 | 70 ± 16 |
| Heart rate (beats/min) | 71 ± 11 | 71 ± 20 | 68 ± 13 |
| QRS duration (ms) | 92 ± 11 | 96 ± 10 | 164 ± 29 † , ‡ |
| Echocardiographic measurements | |||
| End-diastolic volume index (ml/m 2 ) | 62 ± 10 | 111 ± 25 † | 120 ± 39 † |
| End-systolic volume index (ml/m 2 ) | 23 ± 6 | 83 ± 22 † | 88 ± 32 † |
| LVEF (%) | 62 ± 6 | 26 ± 7 † | 27 ± 6 † |
| LV mass index (g/m 2 ) | 76 ± 15 | 123 ± 27 † | 129 ± 33 † |
| Sphericity index | 1.91 ± 0.11 | 1.56 ± 0.10 † | 1.53 ± 0.12 † |
| Dyssynchrony index (ms) | 31 ± 10 | 89 ± 23 † | 127 ± 24 † , ‡ |
| New York Heart Association functional class | |||
| I | 2 (10%) | 2 (10%) | |
| II | 14 (70%) | 3 (15%) | |
| III | 3 (15%) | 12 (60%) | |
| IV | 1 (5%) | 3 (15%) | |
| Medications | |||
| Angiotensin-converting enzyme inhibitors/angiotensin II receptor blockers | 17 (85%) | 20 (100%) | |
| β blockers | 17 (85%) | 18 (90%) | |
| Loop diuretics | 13 (65%) | 14 (70%) | |
| Spironolactone | 10 (50%) | 9 (45%) | |
| Digoxin | 2 (10%) | 2 (10%) | |
‡ p <0.01 versus patients with IDC with narrow QRS complexes.
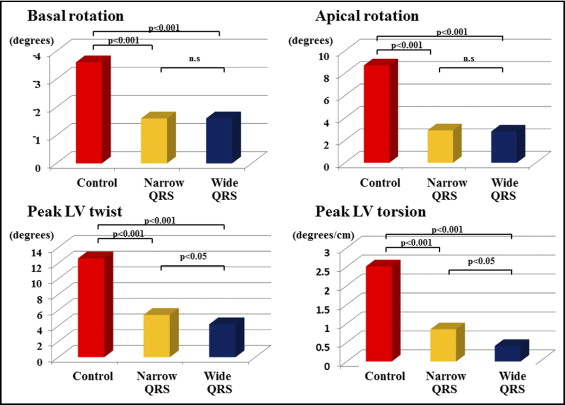
Apical rotation was significantly reduced in patients with IDC, both those with narrow and wide QRS complexes, compared to control subjects (2.9 ± 2.4° vs 8.7 ± 3.7°, p <0.001, and 2.8 ± 2.0° vs 8.7 ± 3.7°, p <0.001, respectively). Basal rotation was also significantly reduced in patients with IDC, both those with narrow (−1.6 ± 1.5° vs −3.6 ± 2.8°, p <0.001) and wide (−1.6 ± 2.2° vs −3.6 ± 2.8°, p <0.001) QRS complexes. As a result, LV twist and torsion were significantly reduced in patients with IDC, both with narrow (5.4 ± 2.3° vs 12.6 ± 4.4°, p <0.001, and 0.81 ± 0.39°/cm vs 2.51 ± 0.70°/cm, p <0.001, respectively) and wide (4.2 ± 1.7° vs 12.6 ± 4.4°, p <0.001, and 0.57 ± 0.25°/cm vs 2.51 ± 0.70°/cm, p <0.001, respectively) QRS complexes compared to normal controls. Interestingly, although each of the apical and basal rotation values was similar for patients with narrow and those with wide QRS complexes, LV twist and LV torsion were significantly smaller in patients with IDC with wide QRS complexes than in those with narrow QRS complexes (4.2 ± 1.7° vs 5.4 ± 2.3°, p <0.05, and 0.57 ± 0.25°/cm vs 0.81 ± 0.39°/cm, p <0.05, respectively; Figure 4 ) .
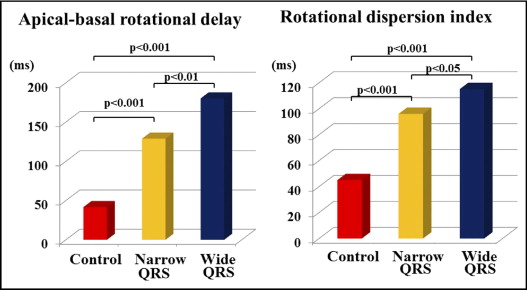
Apical-basal rotational delay, as a marker of synchrony between basal and apical rotation, was significantly larger in patients with IDC with narrow QRS complexes than in controls (129 ± 58 vs 42 ± 23 ms, p <0.001) and much larger in patients with IDC with wide QRS complexes (180 ± 85 vs 129 ± 58 ms, p <0.01, vs patients with IDC with narrow QRS complexes) ( Figure 5 ) . Similarly, the rotational dispersion index, as an index of disparity of the timing of regional rotations, was significantly larger in patients with IDC with narrow QRS complexes than in controls (96 ± 23 vs 45 ± 14 ms, p <0.001). In addition, the rotational dispersion index was much larger in patients with IDC with wide QRS complexes (115 ± 28 vs 96 ± 23 ms, p <0.05 vs patients with narrow QRS complexes) ( Figure 5 ).
Univariate analysis showed that the LV end-diastolic volume index, LV end-systolic volume index, the LVEF, sphericity index, dyssynchrony index, QRS duration, apical-basal rotational delay, and the rotational dispersion index were all associated with LV torsion ( Table 2 ). Multivariate analysis showed that the LVEF (β = 0.688, p <0.001) and rotational dispersion index (β = −0.249, p = 0.006) were independent determinants of LV torsion ( Table 2 ).
| Variable | Univariate Analysis | Multivariate Analysis | ||||
|---|---|---|---|---|---|---|
| LV Torsion (Dependent Variable) | LV Torsion (Dependent Variable) | |||||
| β | SE | p Value | β | SE | p Value | |
| Parameters of LV remodeling | ||||||
| End-diastolic volume index (ml/m 2 ) | −0.681 | 0.003 | <0.001 | |||
| End-systolic volume index (ml/m 2 ) | −0.777 | 0.002 | <0.001 | |||
| LVEF (%) | 0.876 | 0.003 | <0.001 | 0.688 | 0.005 | <0.001 |
| Sphericity index | 0.705 | 0.436 | <0.001 | |||
| Parameters of LV dyssynchrony | ||||||
| QRS duration (ms) | −0.527 | 0.003 | <0.001 | |||
| Dyssynchrony index (ms) | −0.791 | 0.002 | <0.001 | |||
| Apical-basal rotational delay (ms) | −0.647 | 0.001 | <0.001 | |||
| Rotational dispersion index (ms) | −0.767 | 0.002 | <0.001 | −0.249 | 0.002 | 0.006 |
Stay updated, free articles. Join our Telegram channel

Full access? Get Clinical Tree


