Prognosis in patients with Duchenne muscular dystrophy (DMD) is guarded, and most deaths are due to cardiac or respiratory causes. It is unclear if some DMD gene mutations might be predictive of either mild or severe cardiac dysfunction. We studied 75 patients with DMD followed at our institution. Cardiac function, as assessed by yearly echocardiography, showed marked variability in left ventricular (LV) function. Some patients in their 3rd decade had no or minimal dysfunction, whereas others in their 2nd decade had very severe dysfunction. Therefore, 4 severity groups were defined ranging from no or mild LV dysfunction to severe LV dysfunction using patient age at first abnormal echocardiographic finding and degree of LV dysfunction. Genetic data were collected for all patients. Most patients had mutations from exon 1 to 20 to exon 41 to 55. The distribution of the 4 severity groups of LV dysfunction did not significantly differ between these 2 mutation groups. An analysis based on the number of exons involved (<5 vs ≥5 exons) also found no significant difference in cardiac severity. When patients having identical mutations were compared with their cardiac course, concordance was often not evident. Steroid therapy had no apparent protection for the development of cardiomyopathy. In conclusion, 75 patients with DMD showed marked variability in the severity of LV dysfunction. Neither the age of onset nor the severity of cardiomyopathy correlated with any of the mutation groups.
Duchenne muscular dystrophy (DMD) results in skeletal and cardiac muscle dysfunction and is caused by mutations in the DMD gene located at Xp21.1. Most mutations are deletions and result in the absence or minimal amounts of dystrophin, a subsarcolemmal protein product first identified in 1987. As a consequence, cardiac dysfunction and respiratory muscle weakness develop and often result in premature death in the 2nd or 3rd decade of life. Most patients develop myocardial disease characterized by early and extensive fibrosis in the basal inferolateral wall of the left ventricle (LV) and, later, the lateral free wall. Although cardiomyopathy develops in at least 90% of patients, the age when this becomes clinically evident is variable. Several previous reports suggested that some DMD mutations might be predictive of more severe cardiac involvement and some mutations might be cardioprotective. However, no study has specifically focused on characterizing the marked variability in onset and severity of LV dysfunction and whether this variability is predictable by genotype. The clinical implications of such correlations would be significant with the potential of a specific genotype predicting patients at either high or low risk of early LV dysfunction. Conversely, absence of any correlation would not allow predictions of risk.
Methods
Patients (n = 124) with a dystrophinopathy who were followed in the MetroHealth Medical Center Muscular Dystrophy Association Clinic over the years 1999 to 2011 were eligible for inclusion in the study. Patients with DMD and Becker muscular dystrophy have similar DMD mutations, and patients with Becker muscular dystrophy often develop severe cardiac dysfunction. Nevertheless, those with Becker muscular dystrophy were excluded from the present study leaving 104 patients having DMD, none of whom were walking at 12 years of age. Additional exclusion criteria were age <10 years at their last visit or inadequate echocardiographic data. The remaining 75 patients with DMD are the focus of this study. Demographic and clinical data including age, race, and the genetic mutation were collected for all the patients. The hospital’s Institutional Review Board approved the study.
Cardiac function was assessed by echocardiography. One coauthor (MLA), blinded to the specific genotype, reevaluated and measured all echocardiograms to obviate interobserver variability. Standard cardiac imaging was performed using either Philips Sonos 500 or Philips iE33 (Andover, Massachusetts) imaging systems and repeated at approximately yearly intervals. Images were stored in a digital format. The LV internal dimension at end-diastole and the LV internal diameter at end-systole were measured from the 2-dimensional parasternal long-axis view. End-diastole was defined as the largest diameter before the onset of shortening so as to avoid the diastolic compression of the posterolateral wall from gastric pressure. Three cardiac cycles were measured for each study, and the mean values were used to calculate the LV shortening fraction (SF) expressed as a percentage: {[(LV internal dimension at end-diastole − LV internal diameter at end-systole)/LV internal dimension at end-diastole] × 100}.
Although cardiomyopathy may be evident by measurements of circumferential strain, tissue backscatter, and myocardial tissue velocities before reductions in ejection fraction or SF, we considered LV dysfunction and cardiomyopathy to be present only if the SF was <29% and focal hypokinesia was present. SF rather than ejection fraction was chosen for the serial observations because (1) ejection fraction is best calculated from apical images, but the quality of apical images in patients with DMD markedly deteriorates with increasing age because of loss of intercostal windows and (2) SF incorporates the function of the basilar inferolateral wall, which is the earliest and dominant region of LV dysfunction in almost all patients; thus, the SF may be reduced when the LV ejection fraction is normal.
When SF was normal throughout the period of observation, the patient’s age at the last normal SF was noted; when the SF was abnormal, the patient’s age at the first abnormal SF was noted. To integrate age with the variability of SF, a rating scale to reflect the severity of cardiac dysfunction was developed based on both the age at onset of LV dysfunction and the severity of dysfunction as determined by the SF at the patient’s first abnormal echocardiographic finding. LV function was defined as follows: normal: SF ≥29% and no wall motion abnormalities; minor LV dysfunction: SF of 24% to 28% with wall motion abnormalities; and major dysfunction: SF <24%. This scale resulted in the following 4 a priori severity groups ( Table 1 ). Group 1 was indicative of no or minimal cardiac involvement during the 2nd and 3rd decades. Group 4 was indicative of severe cardiac involvement as reflected by major cardiac dysfunction at an early age. Five patients aged <15 years and with normal LV function were not included in the analyses of the severity groups or in the prevalence of cardiomyopathy because their subsequent cardiac future could not be predicted. However, these patients were included in the survival analyses because they would be treated as a censored case for the period beyond their last echo.
| Severity Group | Age | Degree of Left Ventricular Dysfunction |
|---|---|---|
| 1 | ≥15 | None |
| 1 | >19 | Minor |
| 2 | <15 | None |
| 2 | 15–19 | Minor |
| 3 | <15 | Minor |
| 3 | >19 | Major |
| 4 | ≤19 | Major |
The DMD gene mutation analyses were performed by a variety of techniques, depending on the methods that were clinically available in the year in which they presented for genetic evaluation or re-evaluation. Beginning in the early 1990s, the patients were tested for duplications and deletions by polymerase chain reaction and Southern blots using standard techniques. When the mutation was not identified, standard DMD gene sequencing was performed when the technology became clinically available. Those without a definitive result had blood analyzed using a comparative genomic hybridization array that was custom designed for analyzing the DMD gene. This technique became clinically available in the mid-2000s. If no mutation was found, the patient underwent a muscle biopsy. If dystrophin was not present, they were presumed to have DMD but were not included in the study as their mutation remained unknown. Currently, patients are tested first with the dystrophin microarray, and then, the gene is sequenced. Tests done in 65 patients were polymerase chain reaction or Southern blot (52 [69%]), sequencing (7 [9%]), and dystrophin array (6 [8%]), and 10 (13%) siblings were not tested.
Patients were divided into 4 genetic groups based on the first exon involved in the mutation. Group A with mutations starting from exon 1 to 20, group B with mutations starting from exon 21 to 40, group C with mutations starting from exon 41 to 55, and group D with mutations starting at any level greater than exon 55. In a separate analysis based on the number of exons involved, patients were classified as having <5 exons (<5E) or ≥5 exons (≥5E) in their mutation.
The data are described using percentages (nominal data), medians with interquartile ranges (ordinal or nonparametric interval data), and means with standard deviations (parametric interval data). Parametric interval data are defined as having both skewness and kurtosis from −3.00 to +3.00. Differences between groups for unpaired data were assessed by the following statistical tests: chi-square or Fisher’s exact test (nominal data), Mann-Whitney U test (ordinal or nonparametric interval data), and either the pooled or separate variance t test depending on the F value of the variances (parametric interval data). For paired data, the Wilcoxon signed rank test (ordinal data) and the paired t test (parametric interval data) were used. Kaplan-Meier analyses were used to compare the survival curves (time of onset of cardiomyopathy) regarding both steroid usage and the genetic data. The log-rank test was used to compare survival curves when the assumption of proportional hazards was met. If that assumption was not met (i.e., curves intersect), then the Breslow test was used. The survival curves are summarized as the median time of onset of cardiomyopathy with the corresponding 95% confidence interval. Linear regression analysis was used for generating the Pearson r values. The residuals were examined to determine if all the assumptions of regression modeling were met (if not, then appropriate transformations were made). The data were analyzed with IBM SPSS Statistics, version 20 (IBM Inc, Armonk, New York). Statistical significance was defined a priori as a p value <0.05 (two-tailed).
Results
The clinical, genetic, and cardiac features of the 75 male patients are listed in Table 2 . Most patients were Caucasian. Deletions were the most common type of mutation. The largest genetic group was C with the mutation starting from exon 41 to 55, and most patients had <5 exons involved.
| Race | |
| European American | 70 (93%) |
| African American | 3 (4%) |
| Hispanic | 2 (3%) |
| Mutation type | |
| Deletion | 54 (72%) |
| Duplication | 14 (19%) |
| Nonsense | 4 (5%) |
| Frame shift | 2 (3%) |
| Splice site | 1 (1%) |
| Medication usage | |
| ACE-inhibitor ∗ | 45 (60%) |
| Angiotensin receptor blocker ∗ | 3 (4%) |
| Beta-blocker ∗ | 26 (35%) |
| Digoxin ∗ | 18 (24%) |
| Steroid | 11 (15%) |
| Location of mutations | |
| Group A (exon 1–20) | 22 (29%) |
| Group B (exon 21–40) | 3 (4%) |
| Group C (exon 41–55) | 46 (61%) |
| Group D (exon >55) | 4 (5%) |
| Number of mutations | |
| Group L5E (<5 exons) | 47 (63%) |
| Group G5E (≥5 exons) | 28 (37%) |
| Severity of cardiomyopathy | |
| Severity group 1 | 31 (41%) |
| Severity group 2 | 10 (13%) |
| Severity group 3 | 21 (28%) |
| Severity group 4 | 13 (17%) |
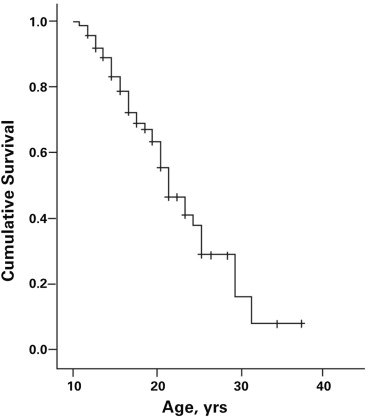
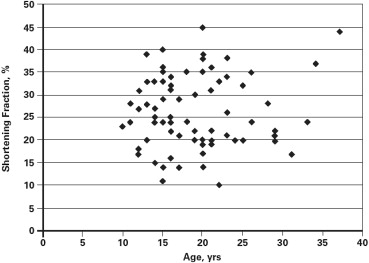
Cardiomyopathy was evident in 43 patients (57.3%). The prevalence of cardiomyopathy increased with age, with the median age for the onset of cardiomyopathy being 21.0 years (95% confidence interval 18.2 to 23.8 years; Figure 1 ). There was marked variability in the SF at the time of diagnosis of the cardiomyopathy ranging from 11% to 28% (21.2 ± 3.9%). There was no correlation of age at onset and the SF at the time of diagnosis of cardiomyopathy (n = 43, r = −0.08, p = 0.61) nor were age and SF related among those without evidence of cardiomyopathy (SF ≥29; r = 0.19, p = 0.30; Figure 2 ). These observations were not affected by cardiac therapies because the Muscular Dystrophy Association Clinic initiated cardiac medications only after there was echocardiographic evidence of LV dysfunction.
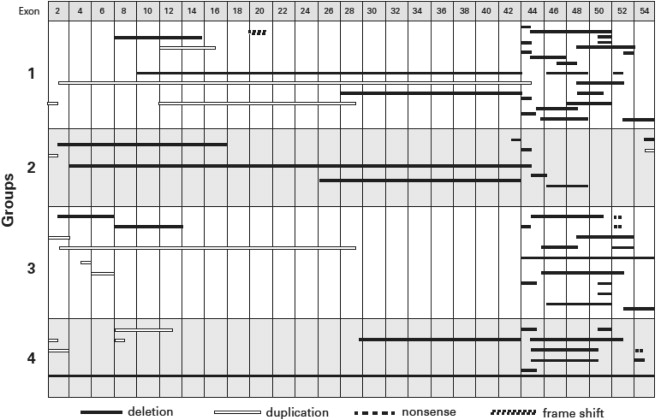
The mutations in the DMD gene for all DMD patients, stratified by the cardiac disease severity groups, are presented in Figure 3 . The distribution of mutations appeared similar for the 4 severity groups. Most patients had mutations between either exon 1 to 20 (n = 21) or exon 41 to 55 (n = 42), and the distribution of the 4 severity groups of LV dysfunction did not significantly differ among these 2 mutation groups (median [interquartile range] 3 [1.0 to 3.5] vs 2.5 [1.0 to 3.0]; p = 0.76; Table 3 ). An analysis based on the number of exons involved (<5 exons [n = 43] vs ≥5 exons [n = 27]) also found no significant difference in cardiac severity (median [interquartile range] 1 [1.0 to 3.0] vs 3 [1.0 to 3.0]; p = 0.224). Specific statistical comparisons for the different genetic groups confirmed no difference in prevalence of cardiomyopathy, severity of the cardiomyopathy, or the age of onset of cardiomyopathy in relation to the location of the first exon mutation (≤40 and >40), exon grouping (0 to 20 and 41 to 55), or number of exons involved (<5 and ≥5; p >0.05; Table 3 ). There was no association between the severity groups and whether the exon alteration was a deletion or duplication. The exon deletions that included 48 to 49 and 51 to 52 that previously were suggested to be either associated with more severe disease or to be cardioprotective were randomly distributed among the 4 severity groups ( Figure 3 ).
| Exon location | ≤40 | >40 ∗ |
| (n = 24) | (n = 46) | |
| Cardiomyopathy (%) | 71% | 57% |
| Severity group (median, IQR) | 2.5 (1.0, 3.8) | 2 (1, 3) |
| Median time (years) † | 25.6 (21.2, 30.0) | 21.6 (19.7, 23.5) |
| Exon grouping | 0–20 | 41–55 ∗ |
| (n = 21) | (n = 42) | |
| Cardiomyopathy (%) | 71% | 60% |
| Severity group (median, IQR) | 3 (1.0, 3.5) | 2.5 (1, 3) |
| Mean time (years) † | 21.0 (12.9, 29.1) | 21.0 (18.5, 23.5) |
| Exons involved | <5 exons | ≥5 exons ∗ |
| (n = 43) | (n = 27) | |
| Cardiomyopathy | 54% | 74% |
| Severity group (median, IQR) | 1 (1, 3) | 3 (1, 3) |
| Median time (years) † | 23.0 (19.1, 26.9) | 21 (19.8, 22.2) |
Stay updated, free articles. Join our Telegram channel

Full access? Get Clinical Tree


