Fig. 15.1
A schematic depicting the distribution of Gd-DTPA contrast in myocardium (a), with two stylized cells, situated within a section of myocardium: a normal cell (left), with an intact, selectively permeable cell membrane, and an irreversibly damaged cell (right), with disrupted cell membranes. If we introduce an extravascular/extracellular contrast agent such as Gd-DTPA into the intravascular space, Gd-DTPA will not be able to penetrate the cell membrane of healthy myocytes, and therefore only distributes to the extracellular space (b). In acutely infarcted tissue, however, breaches in the cell membrane will permit the agent to enter the spaces previously occupied by the cell (c). In chronically infarcted or scarred myocardium (d), the remodelling process also results in a net decrease in the extravascular/cellular compartment, as the lost myocytes are ultimately replaced by mature, collagenous scar, into which Gd-DTPA can accumulate
One early approach toward quantifying the accumulation of Gd-DTPA in the myocardium was to immediately follow the bolus-injection by a constant-infusion of the contrast agent [11]. With this technique, equilibrium concentrations of the tracer can be achieved in the tissue, thus making it possible to estimate the partition coefficient (λ) of Gd-DTPA in ml of contrast medium per gram of myocardium [11]. Assuming normal renal clearance, an optimum constant infusion dose can be chosen such that the concentration of contrast agent will reach equilibrium in approximately 15 min, in all but the most severely ischemic regions of myocardium (perfusion <0.05 ml/min/g) [12]. With breakdown of cell membrane integrity, Gd-DTPA can begin to permeate the formerly intracellular space (Fig. 15.1c). Given that sarcolemmal disruption is a defining characteristic of irreversible injury, it follows that the λ in infarcted myocardium would exceed that of normal tissue and, in fact, it has been shown to be more than double that of normal myocardium (0.8 ml/g versus 0.3 ml/g) [11, 13, 14]. This has been validated in the setting of unreperfused infarction by Pereira and colleagues by a significant increase in λ in infarcted tissue as early as 2 days and for at least 3 weeks following permanent LAD occlusion in canine models [15]. When applied to patients with acutely reperfused AMI, λ was found to be inversely correlated to areas of low count-density on resting Tl-201 images [16]. Flacke et al. also demonstrated that λ can differentiate between normal and infarcted myocardium in patients with either acute or chronic myocardial infarction [17]. Considered together, the available evidence supports the conclusion that λ is increased exclusively in irreversibly injured myocardium.
With respect to dose, the convention at most institutions is to administer a “double dose,” or 0.2 mmol/kg body-weight for all LGE exams. This is to ensure that maximum CNR between healthy and damaged myocardium is achievable at 10–20 min post-injection. Single dose imaging (i.e., 0.1 mmol/kg) will reduce the delay required between injection and image acquisition [18–21]. However, biological clearance of contrast occurs in a non-linear (exponential) fashion and therefore it is still preferable to wait at least 10 min post-injection prior to acquisition, regardless of dose so that areas of hyperenhanced myocardium will appear distinct from the LV or RV blood pools.
Nulling Normal Myocardium
The goal of LGE imaging is to null the signal contribution of healthy myocardium such that areas of scar or fibrosis are rendered as conspicuous as possible. We accomplish this by exploiting the difference in T1 between healthy and fibrotic tissues. As such, all LGE sequences are T1 weighted and most begin by means of a volume inversion preparation pulse. After the inversion pulse, the signal from healthy myocardium will recover according to a longer T1 time than fibrotic myocardium. During this process, the magnetization from both healthy and fibrotic myocardium will pass through a point on the recovery curve where their contribution to the MR signal will be zero or “nulled.” Identifying this inversion time (TI) or “null point” precisely for healthy myocardium is crucial for optimization of LGE imaging (Fig. 15.2). When the prescribed TI is too short, the longitudinal magnetization corresponding to normal myocardium will have a negative value during data readout and could potentially appear hyperenhanced relative to infarcted or fibrotic myocardium. Conversely, if the nominal TI is too long, the magnetization associated with normal myocardium will correspond to a point above the zero-crossing and appear gray, but not black (nulled) [22]. While irreversibly injured myocardium will appear hyperenhanced at long TIs, the CNR will be poor, since the discrepancy between the two tissues will be reduced.
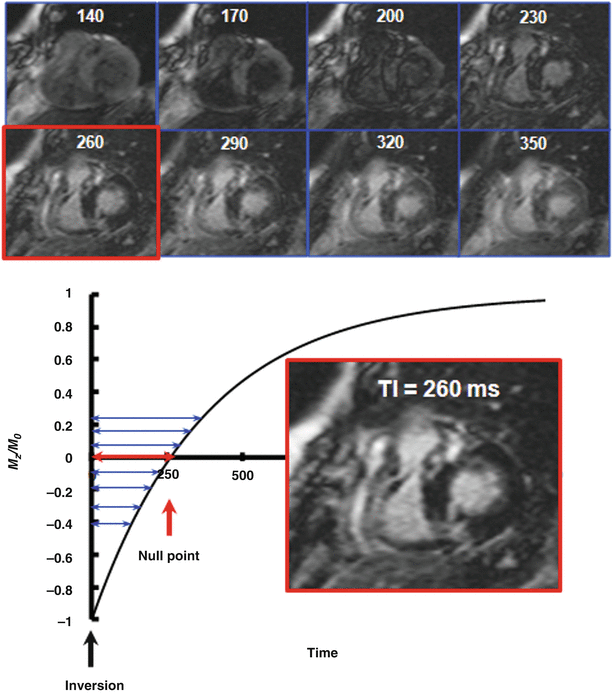

Fig. 15.2
Application of a “TI scout” sequence to determine the optimal TI for nulling normal myocardium. Eight short-axis scout images are shown (top) to illustrate the effect of TI on myocardial enhancement signal intensities in a patient with hypertrophic cardiomyopathy (the TI is indicated on the top of each image in ms). After a 180° inversion pulse at Time = 0, a series of images with incrementally increasing TIs are acquired during longitudinal relaxation (Mz/Mo). Note the increasing intensity of the fibrotic regions (at the RV-LV hinge points) with increasing TI. The time at which the longitudinal magnetization associated with normal myocardium passes through the Mz/Mo = 0 (null) point is recorded as the optimal TI. In this example, the optimal TI is determined to be 260 ms
There are essentially two different strategies for optimizing the TI: one can perform “test” LGE imaging using an initial “best guess” and then re-acquire in the appropriate direction to iteratively select the optimal inversion time. In practice, it is seldom necessary to perform more than two or three “re-tests” as an experienced technologist will be able to estimate the optimal TI merely from experience and a priori knowledge of the dose of contrast administered. For example, if we assume that normal myocardium has a post-contrast T1 of 400 ms, then a patient with an R wave to R wave interval (R-R interval) = 800 ms will require an optimal inversion time of TI = ln (2)*T1 = 0.69*T1 = 280 ms [22]. Alternatively, most vendors provide a so-called “TI scout,” which is usually an inversion recovery prepared cine sequence that systematically acquires test LGE images over a range of TIs (Fig. 15.2), enabling the operator to review and select the optimum inversion time prior to acquisition [23]. When using these sequences, it is important to remain cognizant of the fact that most TI scout sequences utilize a steady-state free precession readout, rather than the spoiled gradient-echo readout common to most LGE acquisitions. In practice, the optimal TI identified by the scout may not effectively match the true ideal required by the LGE sequence.
The Evolution of LGE Pulse Sequence Design
As previously discussed, the basic “recipe” for LGE imaging was first established in the 1980s. The penetration of the technique into mainstream imaging protocols in the last 10–15 years is primarily due to the near-continuous improvement and innovation in both MR hardware (gradient performance, RF coil sensitivity) and pulse sequence design. These advancements have culminated in the sequences we see on our scanners today: sequences that provide sufficient CNR and spatial resolution to resolve not only subendocardial infarcts, but post-ablation scars in the left atrium—achievements that would have been imponderable in the early days of ungated spin-echo LGE.
The preponderance of initial LGE studies published in the 1980s consisted of inversion-prepared spin-echo and fast (“turbo”) spin-echo sequences [1, 2, 4, 5]. Although these sequences provided the T1-weighting needed for delineating areas of gadolinium accumulation, the acquisition times were very long and made breath-holding impractical or impossible. Thus, respiratory artifacts degraded even the most rigorously acquired images. By the mid-to-late 1990s, most of these spin-echo sequences had been replaced by faster gradient-echo varieties. Saturation- [13, 14, 24, 25] or inversion- preparation [26] provided the T1-weighting, along with short TRs and shallow flip-angle readouts. Magnetization-driven “FLASH” (fast low-angle shot) techniques that involved constant RF pulsing also came on the scene at this time [27]. These gradient-echo techniques offered several advantages, as they were sufficiently rapid to be acquired within a reasonable breath-hold, and they could be comfortably repeated, to follow the temporal evolution of contrast accumulation. In fact, the single-shot saturation-prepared fast gradient-echo sequence was used for both perfusion and LGE imaging, and could be acquired either with or without a breath-hold, depending on the post-processing anticipated for quantitative analysis.
Segmented Inversion-Recovery Spoiled Gradient Echo
Unlike perfusion imaging, where the goal is to capture the rapid transit of contrast media during its first pass through the circulation, LGE imaging is performed 10–20 min after administration, to allow for the accumulation of Gd in the extravascular/extracellular space. At this stage, we assume that the contrast has reached equilibrium concentrations in the blood and the tissue. The T1s are no longer changing very drastically and thus, it is no longer crucial to read out each image with high temporal resolution. Given that the goal is to obtain the optimum CNR between healthy and injured or fibrotic myocardium, most LGE imaging is now performed with segmented readout pulse sequences, such as the inversion-prepared spoiled gradient-echo sequence introduced by Simonetti et al. in 2001 [28]. This sequence represented a remarkable breakthrough in CNR, with infarct signal intensities 500–600 % greater than normal myocardium [21, 28, 29] (approximately tenfold improvement in CNR relative to T1-weighted spin-echo sequences, for example). In this sequence, the initial inversion is achieved using a nonselective 180° pulse, which is typically a hyperbolic secant adiabatic inversion. Slice-selective inversion sequences have also been developed, and may improve edge-detection between healthy myocardium and scar. This could be particularly advantageous for imaging small areas of fibrosis or non-transmural infarcts [30].
A pulse sequence diagram for a typical implementation of the segmented inversion recovery spoiled gradient echo LGE sequence is depicted in Fig. 15.3. Before applying the initial inversion pulse, most scanners allow the technologist to select a variable delay time so that the image readout occurs at mid-diastole, or when we presume the heart is moving the least. We can then begin reading out the first segment of k-space after the pre-determined TI delay. Shallow flip-angle RF pulses (approximately 20–25°) are used during the readout of each line, so that the recovery of the post-inversion magnetization is largely unaffected and in accordance with the nominal TI. The size of the k-space segment (i.e., the number of lines of k-space) that we can read during each R-R interval will necessarily depend on the duration of diastole. In a typical implementation of the sequence [28], with a TR of 8 ms, a segment consisting of 23 lines of k-space can be acquired in 184 ms, which is within the period of mid-diastole for most patients. It is important to be cognizant that the segmented LGE sequences are more sensitive to arrhythmias and variable heart rates than their single-shot counterparts. While gradient-moment refocusing mitigates motion artefact to some extent, the duration of the mid-diastolic phase will also shorten with increasing heart rates, so the number of k-space lines acquired per R-R interval will have to be reduced to further minimize motion artifacts. The heart rate will also dictate sequence planning in terms of selecting the optimal inversion time. Unless the patient’s heart rate is very slow (e.g., <50 bpm), the sequence is triggered every other heartbeat to allow sufficient longitudinal relaxation to occur between inversion pulses. The bulk magnetization M(t) will recover post-inversion according to the following: M(t) = Mo(1 − 2e−t/T1). Thus, if we return to our earlier example with the patient (R-R interval = 800 ms), normal myocardium with a post-contrast T1 = 400 ms will require approximately 4 × T1 = 1,600 ms to recover approximately 96 % of its bulk magnetization.
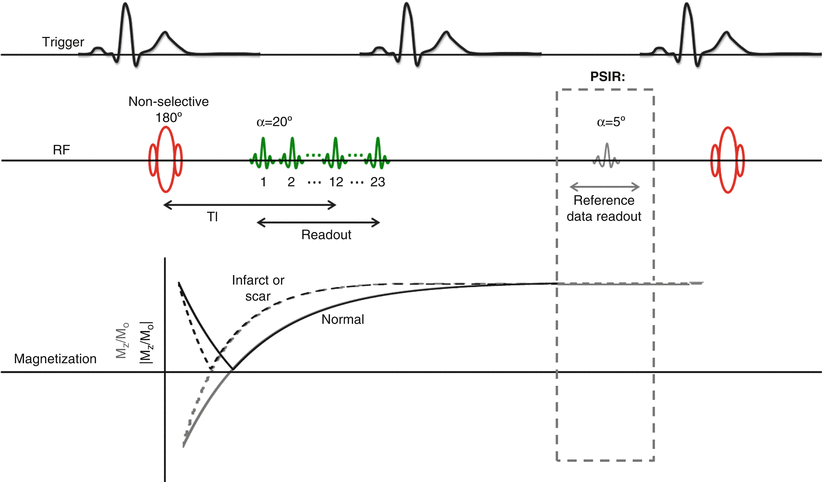

Fig. 15.3
Pulse sequence diagram and associated longitudinal magnetization for a segmented inversion-recovery spoiled gradient echo sequence. The phase-sensitive modification for this sequence is indicated in gray. In both sequences, the non-selective inversion pulse is triggered following a variable delay following detection of the R-wave so that readout occurs at mid-diastole. The first segment of k-space is acquired after the inversion delay TI using shallow flip angle pulses (20°). In this example, each segment consists of 23 lines of k-space. The subsequent segment is collected after allowing for sufficient recovery of longitudinal magnetization, which for most cases translates to every other heartbeat. In the phase-sensitive modification of this sequence (gray), these quiet periods between inversion pulses are used to collect reference images using very shallow RF pulses (5°), so that longitudinal recovery is not unduly disrupted. These reference images are used to remove the background phase from the IR images during reconstruction and restore the signal polarity of the image. For phase-sensitive images, the image intensity is displayed as Mz/Mo (gray recovery curves) rather than the |Mz/Mo| seen in magnitude reconstructed images (black recovery curves)
Phase-Sensitive Inversion-Recovery Imaging
The advent of phase-sensitive reconstruction LGE sequences in 2002 [31] has greatly improved the consistency of image quality over a wide range of TIs, particularly with respect to the CNR between infarcted and normal myocardium [32]. Recall from our earlier discussion that the longitudinal magnetization associated with infarcted or fibrotic myocardium will recover more quickly than that of normal myocardium, since its T1 is shorter. With conventional magnitude reconstruction, if we prescribe a TI that is too short to null normal myocardium, then the normal myocardium will appear too bright and the CNR between normal and infarcted or fibrotic myocardium will be poor. Even when care is taken to isolate the optimal TI for the first slice (e.g., the first of a short-axis stack covering the LV), the continued clearance of contrast over the 5 min multi-slice acquisition will mean that the T1 will have increased non-negligibly by the time the final slice is acquired. Phase-sensitive detection is insensitive to small drifts in T1, enabling the acquisition of a full complement of high CNR images without the need to interrupt the acquisition to repeat the search for optimal TI. The phase-sensitive detection aspect of this technique involves the acquisition of reference phase maps in between the collection of inversion recovery data (Fig. 15.3, gray inset). These phase images include information regarding background phase as well as surface coil field maps. The phase can be subsequently removed from the IR image during reconstruction to reveal the real component of the inversion recovery image. By restoring the signal polarity of the image, phase-sensitive reconstruction effectively avoids the enhancement artifacts to which magnitude images are prone.
3D and Free-Breathing Techniques
All of the LGE sequences discussed thus far involve 2D imaging, or the acquisition of one 2D slice per breath-hold. Depending on the indication for LGE imaging, comprehensive coverage could potentially involve more than ten breath-holds, which can prove difficult for some patients, particularly those with advanced disease. Fortunately, many scanners are also equipped with 3D LGE sequences, in which the entire LV can be imaged in a single (albeit long) breath-hold. In most implementations, 3D LGE is accomplished using a segmented inversion-recovery gradient echo sequence with shallow flip-angle readout (e.g., 15° rather than the 25° typical of most 2D acquisitions). In 3D LGE, the inversion pulse is triggered every heartbeat (instead of every second heartbeat), which can potentially degrade CNR due to incomplete magnetization recovery. Approximately 20 contiguous sections are acquired in the z direction, often with the aid of zero-filling and interpolation to maximize spatial resolution in this direction [33]. If the breath-hold required to cover the LV is potentially too long, the LV can be covered in a quasi-3D fashion by dividing the acquisition into three “slabs,” with a commensurate number of manageable breath-holds [34]. While the strategy for finding the optimal TI should be the same as described for 2D LGE, the advantage is that this TI need only be selected once. The correct TI is particularly crucial for 3D imaging, as there is no opportunity to utilize alternate R-R intervals for acquiring reference images for phase-sensitive reconstruction. Additionally, the need to trigger every heartbeat results in greater sensitivity to arrhythmias. Optimization of 3D acquisitions is a subject of considerable ongoing research. While breath-hold 3D slab acquisitions are promising, they may still present difficulties for some patients. In 2004, Saranathan and colleagues presented a free-breathing 3D LGE alternative, in which a navigator-echo segment is acquired immediately following the gradient echo acquisition [35]. The navigator echo segment is essentially a spin echo sequence that selects a column of spins craniocaudally across the right hemidiaphragm [36]. When combined with their hybrid k-space segmentation scheme, the free-breathing sequence proposed by Saranathan et al. was capable of acquiring 16 × 5 mm thick sections in less than 2 min.
Common Clinical Applications
LGE has become an undeniably powerful tool for the assessment of many clinical cardiac entities. While much of the early development of LGE imaging was centered on the assessment of post-infarction scar, the technique has become increasingly valuable in the characterization of a wide variety of cardiomyopathies as well as in the rule-out of infectious or infiltrative disease. This section is far from an exhaustive accounting of the myriad applications of LGE imaging. Rather, the intention of the following discussion is to illustrate how the technique has been adapted to address a variety of clinical and research questions.
Acute and Chronic Myocardial Infarction
In many ways, the assessment of myocardial viability and infarct scar was the driving force behind the initial development of LGE imaging. Before the advent of the high CNR segmented inversion-recovery gradient echo techniques, most studies were limited to pre-clinical research in rats [37–42] and dogs [43–47] and small “proof of principle” clinical series [16, 17, 19, 21, 26, 29, 48–52]. The veritable explosion of reports involving LGE imaging in the last decade belies the fact that we owe a great deal of its current appeal to the fundamental basic science and development that preceded this recent popularity.
Many of the early contributions to the development of the technique were focused on establishing the kinetics of MR contrast in ischemic and infarcted myocardium. Specifically, there was a great deal of debate regarding the distribution of Gd-DTPA in areas of reversibly injured myocardium [41, 53]. In a rat model of reperfused infarction, Saeed and colleagues found that Gd-DTPA enhanced regions were 33 % larger than the extent of infarcts identified by triphenyltetrazolium chloride (TTC) staining at day 2 post-reperfusion [40], suggesting that reversibly injured myocardium might also accumulate Gd-DTPA. However, similar studies in canine models such as the one reported by Fieno and colleagues, found excellent agreement between both in vivo and ex vivo gadolinium enhanced images and TTC staining (r = 0.95) [47], which supports the notion that myocardial hyperenhancement is specific to irreversible injury (infarction). Establishing the “bright equals dead” principle was a key step, as the management of patients with coronary artery disease (CAD) post-infarction is complicated by the presence of both reversibly damaged and infarcted myocardium. The success of revascularization depends on both the existence and extent of viable but dysfunctional myocardium present, as there are few benefits from revascularizing a territory devoid of viable myocardium. Infarction follows a characteristic path or “wavefront” in the myocardium, beginning in subendocardial tissue and progressing towards the subepicardium. Nuclear medicine methods that are often used for assessing myocardial perfusion (e.g., PET, Tl-201, Tc-99m-sestamibi SPECT) lack the ability to resolve transmural variations in viability. LGE CMR, however can identify subendocardial infarcts that would be otherwise missed by Tc-99m-sestamibi SPECT, for example [20]. Choi et al. investigated the relationship between the transmural extent of LGE hyperenhancement and long-term functional improvement in AMI patients at 1 week and 8–12 weeks following reperfused-infarction [18]. In this important work, the authors showed that the extent of the dysfunctional but normally enhancing region at 1 week post-reperfusion was the single best predictor of functional recovery 8–12 weeks post-reperfusion.
In acutely infarcted myocardium, cell membranes lose their integrity and the Gd-DTPA suddenly gains access to what was formerly intracellular space and shortens T1 to a much greater extent than if the agent was in contact with extracellular space alone. In contradistinction, there does not appear to be an increase in the distribution volume of Gd-DTPA in reversibly dysfunctional myocardium (i.e., “stunned” or “hibernating” myocardium). The ultrastructural changes typical of hibernating myocardial cells include a progressive loss of contractile proteins, which are predominantly replaced by glycogen within the cytoplasm. However, there is no appreciable decrease in cell volume and therefore no evidence of increased gadolinium distribution in hibernating myocardium [51, 54]. Similarly, there does not appear to be any hyperenhancement associated with transiently dysfunctional or “stunned” myocardium [55, 56], which has been confirmed by high-resolution Gd-enhanced imaging of ex-vivo specimens.
Although we conceptualize LGE imaging as “viability” or “scar” imaging, there are certainly settings where perfusion has an outsized influence on late enhancement patterns. One such scenario is in unreperfused infarction, where microvascular damage can severely impede contrast wash-in to the myocardium. On LGE images, microvascular obstruction can manifest as a persistent core of hypoenhancement surrounded by hyperenhancement. Interestingly, this core appears to involute as the infarct heals, regardless of reperfusion status. As the initial inflammation begins to subside and macrophages have left with their cargo of necrotic debris, type I collagen is deposited into the infarcted region. By this point, there should be no residual capillary plugging interfering with Gd-DTPA distribution [57]. Infarct remodelling involves organization of the collagenous scar, with a concomitant loss of myocytes. The net result is a predominantly acellular area, and one that an extravascular/extracellular agent such as Gd-DTPA can occupy in observable volumes (Fig. 15.1d) [58]. Additionally, the potential recruitment of collateral circulation should not be neglected, as it may partially contribute to Gd-DTPA distribution as the infarct matures. Wu et al. demonstrated that LGE hyperenhancement was present in both Q wave and non-Q wave infarcts at 3 months and 14 months following acute myocardial infarction (AMI), and yet none of the patients in the comparison group with idiopathic dilated cardiomyopathy (DCM) exhibited hyperenhancement [21]. This was consistent with the findings reported by Klein et al. in a group of patients with chronic CAD and severely reduced LV function. Klein and colleagues demonstrated that LGE can delineate the location and extent of nonviable myocardium, in close agreement with NH3/FDG PET measurements of perfusion and glucose metabolism [51]. In fact, the authors demonstrated that the sensitivity and specificity of hyperenhancement for detecting either transmural or non-transmural scar tissue (as defined by NH3/FDG PET mismatch) were 83 % and 88 %, respectively.
Ischemic Cardiomyopathy
The term ischemic cardiomyopathy is often used by clinicians to describe chronic ischemic heart disease, such as that experienced by patients with post-infarction remodelling and LV dysfunction. As with post-infarct LGE, the hyperenhancement associated with “ischemic type” cardiomyopathy has three main characteristics: it always involves the subendocardial layer, it is localized in the territories supplied by the epicardial coronary arteries, and it is consistent with regional wall motion abnormalities (Fig. 15.4). Furthermore, ischemic cardiomyopathy is inconsistent with hyperenhancement located exclusively in the subepicardium or mid-myocardium [59].
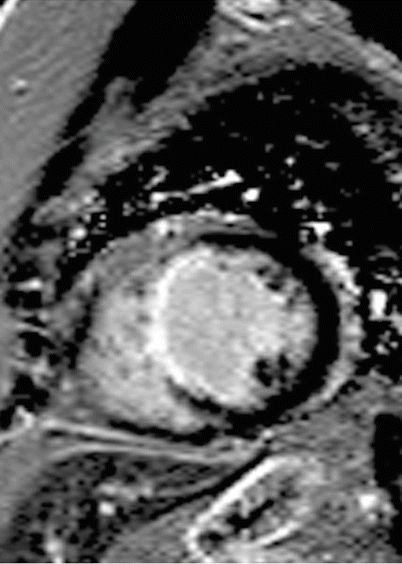

Fig. 15.4
70-year-old woman who presented with dilated cardiomyopathy and an ejection fraction of 35 %. Coronary angiography demonstrated 100 % stenosis in the mid left anterior descending coronary artery. Cardiac MR was performed to assess myocardial viability. Late gadolinium enhancement phase sensitive inversion recovery image in short axis view demonstrates transmural extent of enhancement in the mid septal wall in a left anterior descending artery territory diagnostic of a prior myocardial infarction
When a patient initially presents with LV dysfunction, one of the first objectives is to determine whether the dysfunction arises from an ischemic etiology and if so, the next most important objective is to assess if the myocardium is viable. In a meta-analysis, Allman et al. showed that revascularization may reduce annual mortality in up to 80 % of patients with LV dysfunction and viable myocardium when compared to medical treatment [60]. Kim et al. [29] showed that segments demonstrating ≤50 % of transmural extent of hyperenhancement are likely to recover function after revascularization.
Non-ischemic Cardiomyopathies
To increase the likelihood of clinical improvement in patients with cardiomyopathy, proper determination of the etiology is essential as it then guides proper management. While the cause of non-ischemic cardiomyopathies (NICM) can theoretically be confirmed via endomyocardial biopsy, in practice this invasive approach offers limited sensitivity, particularly for conditions in which myocardial fibrosis or infiltrate may be sparse or heterogeneous in distribution [61]. LGE CMR is not only a key tool for differentiating between ischemic and NICM, it is also crucial for differential diagnosis, since several cardiomyopathies have been associated with their own “signature” enhancement patterns. Ultimately, these patterns that are summarized in the following section may also be used to guide endomyocardial biopsy, helping secure a histopathological diagnosis.
Dilated Cardiomyopathy
After a thorough medical history, including family history, and examination with laboratory testing have been conducted, CMR is often considered as an essential part of the diagnostic evaluation for patients with DCM of unknown cause. While echocardiography and CMR both demonstrate ventricular enlargement and decreased systolic function as measured by ejection fraction, McCrohon et al. [62] showed that the midwall enhancement pattern by LGE-CMR typified non-ischemic DCM. Figure 15.5 demonstrates an example of a patient with new onset heart failure and this characteristic enhancement pattern. Of note, 13 % of DCM patients in this cohort previously labeled as nonischemic DCM based on nonobstructive coronary arteries at by invasive angiography actually had subendocardial infarct scar. This suggested a prior myocardial infarction with recanalization or dispersion of an embolic source, with cardiac enlargement and systolic function ensuing as a result of post-infarct adverse remodeling. Midwall enhancement has been identified as an adverse prognostic finding, predicting events such as sudden cardiac death and heart failure with incremental value beyond ejection fraction [63].
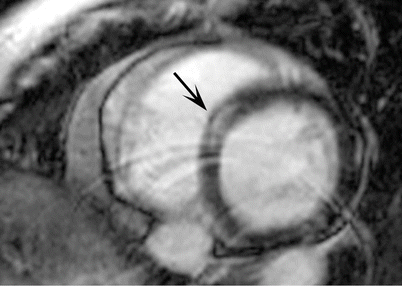

Fig. 15.5
Dilated cardiomyopathy in a 54-year-old man who presented with heart failure. Late gadolinium enhancement magnitude inversion recovery image in a short axis plane demonstrates a characteristic linear mid-myocardial hyperenhancement in the basal septum (arrow)
Hypertrophic Cardiomyopathy
HCM, typically due to mutations in genes encoding for sarcomeric proteins, is characterized by a cardiac phenotype with myocardial disarray, hypertrophy and fibrosis. Early diagnosis of HCM is crucial, as it remains both the most common cause of SCD among young people [64] and a not infrequent cause of heart failure. Given the varied clinical and phenotypic manifestations of the disease, HCM can pose a considerable diagnostic challenge [65]. Non-invasive markers for focal myocardial fibrosis can potentially track progression to heart failure in patients with HCM and help characterize the risk of SCD. Positive LGE occurs in up to 80 % of patients with HCM [66–68] and represents replacement myocardial fibrosis histologically [29, 69]. The typical LGE pattern in HCM is patchy and in a non-coronary distribution, most commonly associated to the regions of hypertrophy such as the insertion points of the interventricular septum in the classic asymmetric septal hypertrophy phenotype [67, 70–72]. Its presence is an independent predictor of adverse outcomes in HCM [72–76]. An example of the pattern of scarring typically observed in HCM is provided in Fig. 15.6.
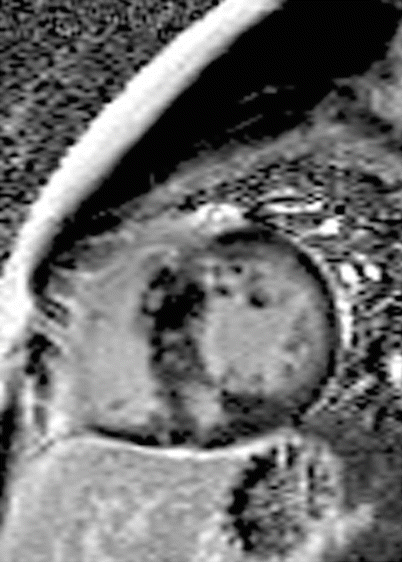

Fig. 15.6
Hypertrophic cardiomyopathy in a 18-year-old man presenting with multiple syncopal episodes. Late gadolinium enhancement phase sensitive inversion recovery image in a short axis plane demonstrates patchy, mid-myocardial enhancement matching the regions of hypertrophy in the septum
Arrhythmogenic Right Ventricular Cardiomyopathy
ARVC is a progressive cardiomyopathy due to fibrofatty replacement of normal myocytes that is associated with right heart failure and SCD. Like HCM, accurate diagnosis of ARVC is important for the prevention of SCD [77, 78]. ARVC is particularly difficult to diagnose, as several of the presentations of ARVC can mimic that of cardiac sarcoidosis (CS). Furthermore, biopsy for the diagnosis of CS or ARVC is frequently inaccessible owing to the random and patchy distribution of fibrofatty infiltration along the RV septum. It is important to mention that abnormal LGE is not included in the new Task Force Criteria for the diagnosis of ARVC [79], which are based on the presence of increased RV size, decreased RV EF, and RV wall motion abnormalities. Nevertheless, Steckman and colleagues recently reported that LGE hyperenhancement was seen in 73 % of CS and 19 % of ARVC patients, with isolated LV involvement seen only in the CS group [80]. Forty-three percent of the CS group and none of the ARVC group demonstrated intraventricular septum dysfunction or hyperenhancement of the septum. Septal enhancement was observed in 78 % of those with CS and 0 % of those with ARVC. Given the overlap in clinical presentation and high false-negative rate of endomyocardial biopsy, a tool for the accurate differentiation of these conditions is needed.
< div class='tao-gold-member'>
Only gold members can continue reading. Log In or Register to continue
Stay updated, free articles. Join our Telegram channel

Full access? Get Clinical Tree


