Most clinicians regard isolated, minor, or nonspecific ST-segment and T-wave (NS-STT) abnormalities to be incidental, often transient, and benign findings in asymptomatic patients. We sought to evaluate whether isolated NS-STT abnormalities on routine electrocardiograms (ECGs) are associated with increased risk of cardiovascular mortality (CM) and all-cause mortality (AM) in a cross-sectional United States population without known coronary artery disease. We included all adults 40 to 90 years of age without known coronary artery disease or risk equivalent based on history and laboratory values, enrolled in the NHANES III from 1988 to 1994, with electrocardiographic data available, and a total follow-up period of 59,781.75 patient-years. NS-STT abnormalities were defined by Minnesota Coding. Subjects were excluded if their mortality data were missing or if they had major electrocardiographic abnormalities, heart rate >120 beats/min, nonsinus rhythm, cardiac infarction/injury score ≥20 on ECG, left ventricular hypertrophy by Minnesota Codes 3.1 and 3.3, or patient-reported history coronary artery disease, congestive heart failure, stroke, diabetes, or peripheral arterial disease. The remaining 4,426 subjects were stratified by presence or absence of NS-STT abnormalities. Mortality was judged based on International Classification of Diseases, Tenth Revision coding linked to the National Death Index. Cox proportional hazard ratio was used for multivariate analysis, showing that CM (hazards ratio 1.71, 95% confidence interval 1.04 to 2.83, p = 0.04) and AM (hazards ratio 1.37, 95% confidence interval 1.03 to 1.81, p = 0.02) were significantly higher in the isolated NS-STT abnormalities group. In conclusion, isolated NS-STT abnormalities on ECG were associated with a higher incidence of CM and AM in this large nationally representative cross-sectional cohort without known coronary artery disease or coronary artery disease risk equivalents.
Major ST-segment and T-wave (STT) abnormalities have been shown to be risk factors for cardiovascular mortality (CM). However, most clinicians regard isolated, minor, or nonspecific STT (NS-STT) abnormalities as incidental, transient, and benign findings in asymptomatic patients. NS-STT abnormalities have been found to be associated with benign factors such as food ingestion, posture, emotional stressors, hyperventilation, electrolyte disturbances, and use of antiarrhythmic or psychotropic drugs in addition to being prevalent in middle-aged men, women, and blacks. However, NS-STT abnormalities may be signs of early coronary artery disease, with some studies showing a two- to threefold increase in all-cause mortality (AM) in patients with NS-STT abnormalities. Despite these findings, few studies have explored the prognostic value of these abnormalities in asymptomatic subjects and most have been limited to small cohorts in specific communities. Our study evaluated whether isolated NS-STT abnormalities found on routine electrocardiogram (ECG) are associated with increased risk of CM and AM in a cross-sectional United States population without known coronary artery disease or coronary artery disease equivalent participating in the Third National Health and Nutrition Examination Survey (NHANES III).
Methods
This is a retrospective cohort study on prospectively collected data designed to assess the relation between NS-STT abnormalities found on routine ECG and mortality (CM and AM) in a United States population without known coronary artery disease or equivalent using NHANES III.
The NHANES III, conducted by the National Center for Health Statistics, is a cross-sectional study that includes data from oral surveys and general health examinations designed to assess demographic, socioeconomic, dietary, and overall health status in a nationally representative sample of noninstitutionalized patients from all 50 states. The study population consists of 39,695 patients selected over the course of 6 years. Of those patients selected to participate, 33,994 (86%) were interviewed and offered a health examination, with 30,818 (78%) completing the health examination.
Our initial cohort of 8,561 subjects was selected from all adults enrolled in NHANES III from 1988 to 1994 with electrocardiographic data available. We then excluded patients with major electrocardiographic abnormalities (n = 1,550) defined according to Minnesota Codes 1.1, 1.2, 4.1, 4.2, 5.1, 5.2, 6.1, 6.4, 6.8, 7.1, 7.2, 7.4, 8.3, and 9.2. In short, subjects were also excluded if they had a heart rate >120 beats/min (n = 7), left ventricular hypertrophy (LVH) by Minnesota Codes 3.1 and 3.3 (n = 553) or LVH with STT abnormalities (n = 6), probable myocardial infarction by electrocardiography (myocardial infarction injury score ≥20, n = 324), rhythm other than sinus on ECG (n = 170), if data were missing for NS-STT abnormalities (n = 91), a self-reported or physician-reported heart attack (n = 223), congestive heart failure (n = 84), stroke (n = 126), exertional chest pain suggestive of angina (n = 285), history of exertional leg pain suggestive of intermittent claudication (n = 31), and history of diabetes, use of diabetes medications, or increased glycohemoglobin levels (≥6.5%, n = 684). Fourteen subjects with missing follow-up mortality data were also excluded.
Hypertension was defined as self-reported history of high blood pressure or hypertension, use of medication for high blood pressure, or a finding during physical examination of a mean systolic blood pressure ≥140 mm Hg and/or diastolic blood pressure ≥90 mm Hg after 3 measurements. History of hypercholesterolemia was defined as a self-reported history of hypercholesterolemia, taking medications for hypercholesterolemia, or a laboratory test result showing increased low-density lipoprotein according to Adult Treatment Panel III guidelines.
In NHANES III every subject >40 years old underwent baseline 12-lead electrocardiography at rest in a supine position at the mobile examination center. ECG was recorded using a Marquette MAC 12 (Marquette Medical Systems, Inc., Milwaukee, Wisconsin), which uses simultaneous multiple leads, thus facilitating the recording of superior quality ECGs. The mobile examination center physician was responsible for approving the quality of the ECG based on predefined minimum standards. ECGs were analyzed at the Epidemiological Cardiology Research Center at Wake Forest University using the NOVACODE (Wake Forest University School Of Medicine, Winston-Salem, North Carolina) electrocardiographic program, which classified ECGs according to the Minnesota Coding System.
The remaining 4,426 subjects were stratified by the presence of minor NS-STT abnormalities according to Minnesota Coding: ST-J segment downward sloping or T-wave nadir ≥0.5 mm below PR baseline (Minnesota Code 4.3); STJ depression ≥1.0 mm and ST-segment upward sloping or U-shaped (Minnesota Code 4.4); T amplitude 0 (flat), or negative, or diphasic with <1.0-mm negative phase when R amplitude is ≥5.0 mm ; and T amplitude positive and T/R amplitude ratio <1/20; and R-wave amplitude must be ≥10.0 mm.
Mean follow-up was 13.5 ± 3.8 years per patient, representing a total follow-up period of 59,781.75 patient-years. The primary determination of mortality for eligible NHANES III participants is based on matching records to the National Death Index. Mortality status was obtained from the NHANES III–linked mortality public-use file, which provided mortality data through December 31, 2006. Underlying causes of death were provided by death certificate data contained in the same mortality files and classified according to International Classification of Diseases, Tenth Revision injury and cause-of-death guidelines. Codes for cardiovascular disease were identified according to American Heart Association guidelines and included codes I00 to I99 for circulatory disease: essential hypertension, hypertensive heart, and kidney disease (I10 to I13); ischemic heart diseases (I20 to I25); acute rheumatic fever and chronic rheumatic heart diseases (I00 to I09); acute and subacute endocarditis (I33); diseases of pericardium and acute myocarditis (I30 to I31, I40); other heart diseases (I26 to I51); heart failure (I50); all other forms of heart disease (I26 to I28, I34 to I38, I42 to 49, I51); cerebrovascular diseases (I60 to I69); atherosclerosis (I70); and other diseases and disorders of the circulatory system (I71 to I78, I80 to I99).
Because NHANES III had a complex nonrandom multistage stratified sample design, all analyses were performed using the designated weighting specified in the NHANES III dataset to minimize biases. We used the total NHANES III pseudostratum as our stratum variable, the total NHANES III pseudoprimary sampling units as our survey sampling units, and the total mobile examination center final weight as our sampling unit weight.
Baseline characteristics of the study population were studied overall and according to the presence and absence of NS-STT abnormalities. For categorical variables, chi-square analysis was used to evaluate group differences. For continuous variables, simple linear regression was used to evaluate group differences. Kaplan–Meier curves were then used for univariate analysis, whereas Cox proportional hazard regression modeling was used to calculate hazard ratios of CM and AM and for possible predictors of death, respectively. In addition to NS-STT abnormalities, variables evaluated in the regression model were age, gender, race, body mass index, hypertension, smoking, serum cholesterol, glomerular filtration rate, potassium, heart rate, corrected QT interval, and left ventricular mass index. Statistical analyses were performed using STATA SE 11.1 (STATA Corp. LP, College Station, Texas). A 2-sided p value <0.05 was considered statistically significant.
Results
The study population included 4,426 patients from the NHANES III, which is representative of the United States population. Prevalence of NS-STT abnormalities in our population was 9.3%. Patients with NS-STT abnormalities were significantly older, women, and more likely to be hypertensive compared to patients with no NS-STT abnormalities on ECG ( Table 1 ).
| Variable | NS-STT Absent | NS-STT Present | p Value |
|---|---|---|---|
| (n = 4,015) | (n = 411) | ||
| Age (years) | 56.71 ± 12.90 | 62.43 ± 12.40 | <0.01 |
| Men | 44.58% | 32.41% | 0.0004 |
| Black race | 6.75% | 8.48% | 0.08 |
| Body mass index (kg/m 2 ) | 27.04 ± 5.12 | 27.89 ± 5.27 | 0.037 |
| Hypertension ⁎ | 33.38% | 58.15% | <0.01 |
| Current smoker | 22.16% | 20.00% | 0.43 |
| Family history of heart attack before 50 years of age † | 9.82% | 12.6% | 0.23 |
| History of hypercholesterolemia ‡ | 56.93% | 63.92% | 0.10 |
| Serum cholesterol (mg/dl) | 215.94 ± 42.40 | 222.99 ± 43.53 | 0.002 |
| High-density lipoprotein (mg/dl) | 52.21 ± 16.10 | 51.75 ± 17.37 | 0.88 |
| Serum triglycerides (mg/dl) | 146.44 ± 99.96 | 157.38 ± 100.01 | 0.02 |
| Calculated low-density lipoprotein (mg/dl) § | 135.60 ± 38.28 | 140.30 ± 38.03 | 0.06 |
| Glomerular filtration rate (ml/min) □ | 66.14 ± 19.84 | 62.18 ± 19.99 | <0.01 |
| Serum potassium (mEq/L) ¶ | 4.07 ± 0.32 | 4.02 ± 0.38 | 0.001 |
| Serum normalized calcium (mmol/L) # | 1.23 ± 0.05 | 1.24 ± 0.05 | 0.80 |
| Heart rate (beats/min) | 67.90 ± 10.75 | 68.65 ± 11.40 | <0.01 |
| Corrected QT interval (ms) ⁎⁎ | 427.23 ± 21.88 | 436.20 ± 26.13 | <0.01 |
| QRS duration (ms) | 95.55 ± 9.90 | 96.39 ± 9.63 | 0.19 |
| PR interval (ms) | 161.92 ± 25.98 | 165.59 ± 28.90 | 0.20 |
| Electrocardiographic left ventricular mass index | 98.80 ± 17.08 | 110.88 ± 19.56 | <0.01 |
⁎ Hypertension was defined as a self-reported history of high blood pressure/hypertension or use of medications for high blood pressure or a finding during physical examination of systolic blood pressure ≥140 mm Hg and/or diastolic blood pressure ≥90 mm Hg.
† Family history of heart attack was defined as participants having any first-degree relative with this diagnosis or who died from a heart attack before 50 years of age.
‡ History of hypercholesterolemia was defined as a participant’s self-reported history of hypercholesterolemia or use of medication or low-density lipoprotein not in the range of the target goal according to Adult Treatment Panel III guidelines.
§ Low-density lipoprotein was calculated by the following formula: low-density lipoprotein (milligrams per deciliter) = total cholesterol minus high-density lipoprotein minus 0.20 multiplied by serum triglycerides.
□ The Modification of Diet in Renal Disease formula was used to calculate glomerular filtrate rate (milliliter per minute per 1.73 m 2 of body surface area): 186 multiplied by serum creatinine −1.154 multiplied by age −0.203 multiplied by 1.210 (for African-Americans) multiplied by 0.742 (for women).
¶ Serum potassium is presented as miliequivalents per liter.
# The normalized calcium value was derived from adjusting the measured ionized calcium for pH (laboratory procedures used for the Third National Health and Nutrition Examination Survey).
⁎⁎ Corrected QT interval was derived using the Bazzett formula: corrected QT interval = QT interval/(RR interval) ½ . All intervals are in milliseconds.
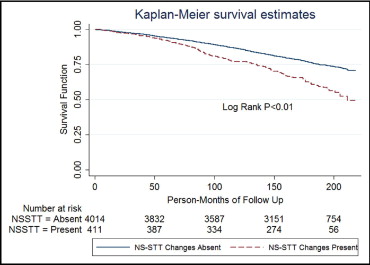
Of the 1,116 subjects who died over the mean follow-up of 13.5 ± 3.8 years per patient, 38% were cardiovascular related. There was a significantly higher incidence of cardiovascular and overall deaths in subjects with NS-STT abnormalities on univariate analysis ( Figures 1 and 2 ). Multivariate analysis after adjustment for baseline demographics and cardiovascular risk factors showed that NS-STT abnormalities were significantly associated with an increased risk of CM and AM ( Table 2 ). We further analyzed data by stratifying subjects into subgroups of NS-STT abnormalities based on Minnesota Codes 4.3, 4.4, 5.3, and 5.4. There was a significantly higher incidence of cardiovascular death in participants with Minnesota Codes 4.3 and 5.3, whereas no such association was found in subgroups with codes 4.4 and 5.4 ( Table 3 ). We also carried out subgroup analysis in normotensive subjects (n = 2,659) because of the significant association of hypertension with NS-STT abnormalities. This showed that even in the normotensive cohort, NS-STT abnormalities were significantly associated with CM and AM ( Table 4 ).

| Variable | AM (n = 1,116) | CM (n = 427) | ||
|---|---|---|---|---|
| HR ⁎ (95% CI) | p Value | HR ⁎ (95% CI) | p Value | |
| Age | 1.11 (1.10–1.12) | <0.01 | 1.13 (1.11–1.15) | <0.01 |
| Male gender | 1.56 (1.35–1.80) | <0.01 | 1.43 (1.13–1.80) | 0.004 |
| Black | 1.26 (1.02–1.56) | 0.03 | 1.27 (0.87–1.86) | 0.21 |
| Body mass index | 1.01 (0.98–1.03) | 0.51 | 1.02 (0.98–1.05) | 0.29 |
| Hypertension | 1.29 (1.03–1.62) | 0.03 | 1.56 (1.09–2.24) | 0.02 |
| Smoking | 2.33 (1.92–2.81) | <0.01 | 2.11 (1.40–3.17) | 0.001 |
| Cholesterol | 1.26 (1.06–1.50) | 0.01 | 1.05 (0.77–1.43) | 0.76 |
| Glomerular filtration rate | 1.00 (0.99–1.00) | 0.32 | 0.98 (0.97–1.00) | 0.03 |
| Potassium | 1.18 (0.92–1.51) | 0.19 | 1.01 (0.68–1.50) | 0.96 |
| Heart rate | 1.02 (1.01–1.03) | <0.01 | 1.02 (1.00–1.03) | 0.05 |
| Corrected QT interval | 1.00 (0.99–1.01) | 0.32 | 1.00 (0.99–1.01) | 0.78 |
| Left ventricular mass index | 1.00 (0.99–1.01) | 0.63 | 1.01 (0.99–1.02) | 0.35 |
| Nonspecific ST-segment and T-wave change † | 1.37 (1.03–1.81) | 0.02 | 1.71 (1.04–2.83) | 0.04 |
Stay updated, free articles. Join our Telegram channel

Full access? Get Clinical Tree


