Invasive electrophysiology
Abbreviations
| 3D | three dimensional |
| ACT | activated clotting time |
| AD | afterdepolarization |
| AF | atrial fibrillation |
| AICD | automated implantable cardioverter defibrillator |
| AP | accessory pathway |
| ASD | atrial septal defect |
| ATP | antitachycardia pacing |
| AV | atrioventricular |
| AVN | atrioventricular node |
| AVNERP | atrioventricular nodal effective refractory period |
| AVNRT | atrioventicular node re-entrant tachycardia |
| AVRT | atrioventricular re-entrant tachycardia |
| AWCL | anterograde Wenckenbach cycle length |
| BBB | bundle branch block |
| BP | blood pressure |
| CFAE | complex and fractionated atrial electrogram |
| CS | coronary sinus |
| CT | computed tomography |
| DVT | deep vein thrombosis |
| ECG | electrocardiogram |
| EP | electrophysiology |
| ERP | effective refractory period |
| FAT | focal atrial tachycardia |
| FFP | fresh frozen plasma |
| HCM | hypertrophic cardiomyopathy |
| HRA | high right atrium |
| HSVPB | His syndrome ventricular premature beat |
| IAP | incremental atrial pacing |
| ICD | implantable cardiac defibrillator |
| ICegram | intracardiac electrogram |
| IVC | inferior vena cava |
| IVP | incremental ventricular pacing |
| LA | left atrium |
| LAA | left atrial appendage |
| LAO | left anterior oblique |
| LBBB | left bundle branch block |
| LIPV | left inferior pulmonary vein |
| LSPV | left superior pulmonary vein |
| LV | left ventricle |
| MI | myocardial infarction |
| MRI | magnetic resonance imaging |
| MV | mitral valve |
| NYHA | New York Heart Association |
| PE | pulmonary embolism |
| PV | pulmonary vein |
| RAO | right anterior oblique |
| RF | radiofrequency |
| RSPV | right superior pulmonary vein |
| RVA | right ventricular apex |
| RVOT | right ventricular outflow tract |
| RWCL | right Wenckenbach cycle length |
| SA | sinoatrial |
| SAN | sinoatrial node |
| SCD | sudden cardiac death |
| SR | sinus rhythm |
| SVC | superior vena cava |
| SVT | supraventricular tachycardia |
| TIA | transient ischaemic attack |
| TOE | transoesophageal echocardiography |
| TV | tricuspid valve |
| VERP | ventricular effective refractory period |
| VF | ventricular fibrillation |
| V/Q | ventilation–perfusion |
| VT | ventricular tachycardia |
| WCL | Wenckenbach cycle length |
| WPW | Wolff–Parkinson–White (syndrome) |
Mechanism of tachycardias
Knowledge of how arrhythmias are initiated and perpetuated is fundamental to understanding the techniques described in this chapter.
The electrical wavefront
The excitable impulse is generated at the cell membrane by the action potential. As one cell depolarizes, it causes a reduction in negativity of the resting potential in the adjacent cell such that it this cell also reaches the threshold potential and depolarizes. The shape, orientation, and presence of gap junctions between myocardial cells allow rapid progression of this depolarization, which can be described as an electrical wavefront. After a cell has depolarized, it cannot depolarize again until a fixed period of recovery time has passed, the refractory period. Cells that are able to depolarize are excitable and those that cannot are refractory.
In sinus rhythm (SR), the source of these wavefronts is the sinoatrial node (SAN), and they may be modulated between the atrium and ventricle by the atrioventricualar (AV) node. They are initiated (and therefore the heart rate is controlled) by regulation from the autonomic nervous system and circulating cathecholamines. This control is lost in tachyarrhythmia, and heart rates are inappropriate.
Conduction block
A wavefront will propagate as long as there are excitable cells in its path. Anatomical barriers such as the mitral valve annulus, vena cava, aorta, etc. do not contain myocardial cells and therefore the progression of wavefronts is halted there. This is described as fixed conduction block, as block is always present. Dead cells are another important source of fixed conduction block e.g. the left ventricular scar of a myocardial infarction (MI).
Functional conduction block describes the situation when block is only present under certain conditions. An example is myocardial ischaemia, which may alter the electrical properties of myocytes so that they do not conduct. It is also functional block that prevents a wavefront turning back on itself, as the cells behind the leading edge are temporarily refractory and force the wavefront to continue in one direction. Other causes of functional block are: cyanosis, myocardial stretch, rate of wavefront, and direction of wavefront.
Arrhythmia mechanism
Three distinct mechanisms are described:
The first two account for nearly all clinical tachycardias, and their characteristics are compared in Table 11.1.
Table 11.1 Characteristics of automatic and re-entry tachycardiasa
| Automatic | Re-entrya | |
| Autonomic sensitivity? (e.g. to exercise, emotion) | Often | Unusual |
| Reproducible induction and termination by programmed pacing? | No | Yes |
| Entrainment of the tachycardia by pacing (p)? | No | Yes |
| Induced by atropine/isoprenaline infusion? | Yes | May augment induction by pacinga |
| Related to metabolic causes | Often | Unusual |
| Onset/offset | May be gradual (warm up and down) | Sudden |
| Specific tachycardias caused | Focal atrial tachycardia, RVOT VT | Macroreentrant atrial tachycardia, AVNRT, AVRT, VT |
aThe conduction properties of, e.g. the AV node, are influenced by autonomic tone. Spontaneous or drug-induced changes in this may then influence the development of re-entry tachycardias such as AV-nodal re-entry tachycardia (AVNRT); AF (atrial fibrillation); AVRT (atrioventricular re-entrant tachycardia); RVOT (right ventricular outflow tract); VT (ventricular tachycardia).
Mechanism of arrhythmias
Enhanced automacity
If a nidus of myocardial cells depolarizes faster (rapid phase 4 of the action potential) than the SAN, they will act as the source of wavefronts that conduct through the heart. They may be atrial or ventricular, but if they occur in the atria they will override the SAN. As they occur from a single site they are often termed focal. Common sites are where myocardial cells suddenly change shape/size or those under abnormal pressures such as; the junction of veins/atrium (superior vena vava (SVC), pulmonary veins (PVs)), crista terminalis, coronary sinus (CS), AV node area, mitral/tricuspid ring, ventricular outflow tracts.
Re-entry
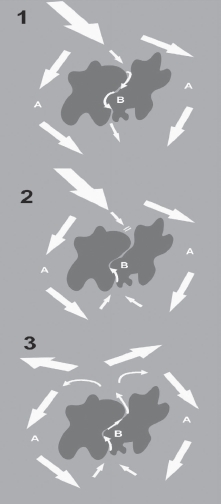
Re-entry accounts for >75% of clinical arrhythmias. It is caused by a perpetually propagating wavefront that it is constantly meeting excitable myocardium. For re-entry to occur, at least two distinct pathways must exist around an area of conduction block. This is best described using the example of VT due to re-entry around a LV myocardial scar (see Fig. 11.1).
Thus, a re-entry wavefront has been formed that is constantly meeting excitable myocardium.
Triggered activity
This has features of both the above mechanisms. They are caused by spontaneous (hence automatic) afterdepolarizations (ADs) occurring late in phase 3 (early ADs) or in phase 4 (delayed ADs) of the action potential. These ADs, however, are often triggered by premature beats and are therefore inducible (like re-entry). If these ADs reach the threshold level, then a single or burst of action potentials is set off. The ADs can be induced experimentally by ischaemia, QT-prolonging drugs, cell injury, or low potassium. This mechanism underlies torsades de pointes and arrhythmias due to digoxin toxicity.
The electrophysiology study
The electrophysiology (EP) study is most useful for the diagnosis of tachycardia. When this has already been documented or is strongly suspected, then it is usually the first part of a combined procedure with catheter ablation to cure the arrhythmia. Note that in EP it is usual to discuss cycle lengths (in ms) rather than heart rates e.g. 60/min = 1000 ms, 100/min = 600 ms, 150/min = 400 ms.
Mapping electrical activity in the heart
EP is wrongly considered to be complex. Fundamentally, it is just recording of the heart’s electrical signals either during sinus rhythm, arrhythmia, or in response to pacing at specific sites. The electrocardiogram (ECG) provides a great deal of this information and so a full 12-lead ECG is recorded throughout the procedure.
The intracardiac electrogram (ICegram)
The ECG summates the entire cardiac activation. By placing 2 mm electrodes directly on the heart’s endocardial surface, the electrical activity at precise locations is known. The ICegram is therefore much narrower than the ECG and is best appreciated at a sweep speed of 100 m/ms, four times faster than a standard ECG recording.
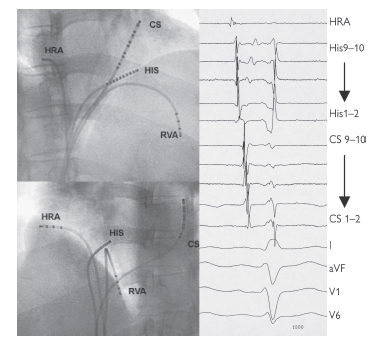
The potential difference between either two closely spaced electrodes (a bipolar electrogram) or one electrode and infinity (a unipolar electrogram) can be recorded. The unipolar electrogram is more accurate regarding direction and location of electrical activity; however, it is subject to much greater interference. Note that a pacing current can be passed through any of these electrodes. Standard catheter location is shown in Fig. 11.2.
Pacing protocols
Pacing in the EP study is done in a predefined manner, termed programmed stimulation. This has three forms:
The ICegrams are conventionally ordered HRA, HIS, CS, and RV (not displayed here), with an ECG lead at the bottom. On each catheter, bipoles are then ordered proximal to distal. In SR then activation is seen to start at the HRA, pass across the His bundle, and then along the CS catheter proximally to distally. Earliest ventricular activation is at the RVA (where the Purkinje fibres insert).
Normal sinus intervals are PA = 25–55 ms, AH = 50–105 ms, HV 35–55 ms, QRS <120 ms, corrected QT <440 ms men, <460 ms women.
Uses of the electrophysiology study
Sinus node function
The corrected sinus node recovery time and sinoatrial conduction time are both measures of SAN function. Unfortunately, however, they are unreliable tests as SAN function is greatly influenced by autonomic tone, drugs and observer error. SAN dysfunction is best assessed with ambulatory monitoring and exercise testing. It is very rare that invasive EP testing would contribute to the decision to give a patient a permanent pacemaker and therefore it is not part of our routine procedure.
AV conduction
Heart block:
The degree of heart block is assessed via the ECG, which can also indicate the level (i.e. either at the AV node itself or in the His Purkinje system, infra nodal. The level of block is ascertained easily in the EP study. The AH time is prolonged in nodal and the HV time in infranodal block. The AH (but not the HV) time may be shortened by exercise, isoprenaline or atropine and prolonged by vagal manoeuvres.
AV nodal function:
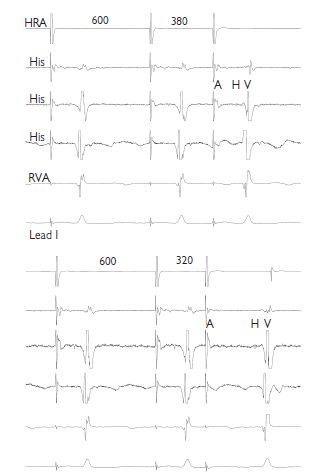
This is assessed both anterogradely (A to V) and retrogradely (V to A), using both incremental and extrastimulus pacing. By incremental pacing at the HRA, conduction is observed in the His bundle and RVA until block occurs. The longest pacing interval at which block occurs is the anterograde Wenckebach cycle length (WCL). Normal values are <500 ms; however, this increases with age and autonomic influences. The retrograde WCL is also measured; however, absent VA conduction can be normal. From the HRA, extrastimulus pacing is performed. As the coupling interval between S1 and S2 is reduced, AV conduction is observed. The longest S1–S2 interval at which AV block occurs is the anterograde atrioventricular node (AVN) effective refractory period (ERP). This is measured at drive trains of 600 and 400 ms. If VA conduction is present, the retrograde atrioventricular nodal effective refractory period (AVNERP) is measured.
Decremental conduction:
This is the key physiological property of the AV node. As the interval between successive impulses passing through the AV node decreases, the conduction velocity within the AV node also decreases. In AV conduction, this is manifest as a prolongation of the AH (and AV) interval, as the atrial pacing interval decreases. This phenomenon can be observed during incremental and extrastimulus pacing. During extrastimus pacing, if the AH interval is plotted against the S1–S2 (=A1–A2), then an anterograde conduction curve can be plotted.
Dual AV nodal physiology:
It is possible in many patients (but not all) to identify two electrical connections between the atrial myocardium surrounding the compact AV node and the node itself, which have different conduction properties. The slow pathway has slower conduction velocity but a shorter ERP than the fast pathway. This is observed by plotting an anterograde conduction curve. For longer A1–A2 intervals, AV conduction is preferentially via the fast pathway; however, once the fast-pathway ERP is reached, conduction is via the slow pathway and consequently the AH time suddenly prolongs. This is called an AH interval jump and is defined as a lengthening of the AH by >50 ms, following reduction in the A1–A2 interval of 10 ms. Dual AV nodal pathways are the substrate for AVNRT.
Indications for electrophysiology study
Identifying abnormal AV connections
In normal hearts there is only one connection between the atrium and ventricle, the AV node. Activation of the atrium (during V pacing) or ventricle (during A pacing or SR) should therefore start at the AV node. Accessory pathways (APs) do not decrement. Their presence can be identified by both abnormal activation patterns and conduction physiology using incremental and extrastimulus pacing.
Atrial pacing: As the AV node decrements, a greater proportion of ventricular activation will occur via the AP. Thus, non-decremental AV conduction times and broadening of the QRS complex will be observed as the pacing interval shortens. Note: If the ERP of the AP is shorter than the ERP of the AV node, then the QRS will suddenly narrow and the AV time suddenly prolong when the AP blocks.
Ventricular pacing: The normal order of atrial activation is His then CS (proximal to distal) and finally the HRA, termed concentric activation. If the atrium is activating via an AP, an eccentric activation pattern is observed. The site of the earliest atrial activation will localize the AP. Non-decremental VA conduction is also seen.
Induction of arrhythmia
The presence of an AP, dual AVN physiology or a known ventricular scar provides the substrate for a tachycardia but does not necessarily imply it will occur. A diagnosis can only be confirmed by inducing the tachycardia.
In addition to the pacing techniques described, burst pacing, extra-stimulus pacing with multiple extrastimuli, and sensed extras are deployed. If this fails, pacing manoeuvres can be repeated during an isoprenaline infusion (1–4 mcg/min) or boluses (1–3 mcg). This is particularly important for tachycardias with an enhanced automaticity mechanism. ‘Aggressive’ induction protocols increase the likelihood of inducing an unwanted arrhythmia such as AF or VF (ventricular fibrillation).
Once a tachycardia is initiated, it is useful to compare it with a 12-lead ECG recorded during symptoms to ensure this is the clinical arrhythmia. How individual tachycardias are diagnosed and treated is considered in subsequent chapters.
Programmed ventricular stimulation
An EP study focusing on induction of ventricular arrhythmias (the VT stimulation study) has previously been used to risk stratify for SCD, and to decide on the effectiveness of antiarrhythmic drugs in suppressing VT, and the need for an ICD. Evidence has now accumulated, however, that it is of little predictive value, and that decisions regarding ICD prescription should be based on other risk factors, particularly LV function. The EP study can be useful prior to ICD implant for other reasons:
Programmed ventricular stimulation is performed using the protocol devised by Wellen, or a modification thereof (see below).
Protocol for programmed ventricular stimulation
Thus, the pacing protocol becomes gradually more aggressive. The more aggressive the induction protocol, the less specific the result. The most useful result is induction of a sustained monomorphic VT with one or two extrastimuli. This indicates a potential substrate for ventricular arrhythmias. Non-sustained VT, polymorphic VT, and VF are all non-specific results.
New technologies
Non-fluoroscopic three-dimensional mapping
EP procedures have become increasingly complex (e.g. ablation of AF or atrial tachycardia in congenital heart disease), leading to longer procedures with greater X-ray exposure. Non-fluoroscopic electroanatomical mapping systems help overcome these challenges by generating a three-dimensional (3D) image as the ablation catheter is moved around the cardiac chamber being mapped. Two systems are commonly used; Carto (Biosense Webster) and Navx (St Jude Medical), which locate the catheters using magnetic and electrical fields respectively.
These maps can be used as anatomical guides, and can display the timings (activation maps) or voltages of ICegrams represented by colours. The maps can be viewed in any orientation or from internally. Points of interest or labels, e.g. ablation lesions, can be marked, which gives memory of where the catheter has been. This is particularly useful in ablation of AF where a series of ablation points need to be delivered to from continuous circular or linear ablation lines. The identification of areas of scar (voltage mapping) is essential in VT ablation, as these are critical to its re-entrant mechanism.
Non-contact mapping (Ensite Array, St Jude Medical), allows simultaneous collection of ICegrams from the entire endocardial surface of the chamber in which the catheter is placed. An array of 64 unipolar electrodes, mounted on a balloon, records the signals from the endocardium conducted through the blood. The ‘virtual’ ICegrams are reconstructed and displayed on a map of the chamber. The mechanism of a regular tachycardia can be determined from a single ectopic beat.
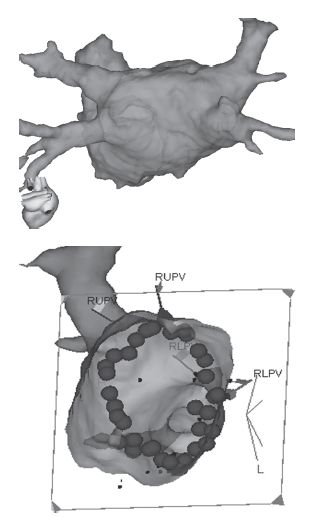
Image integration (Fig. 11.4)
A computed tomography (CT) or magnetic resonance imaging (MRI) scan of the patient’s thorax can be segmented to provide a 3D image of the patients own LA (or other chamber). This is then registered with the mapping system (Carto or NavX) by moving the mapping catheter to at least four anatomical points (e.g. junction of a pulmonary vein and the LA) and simultaneously marking them on the image and mapping system. The reconstruction of the LA is then locked into the mapping system, so that the operator can navigate around the complex unique anatomy of a patient’s LA without the need for X-ray.

Fig. 11.4 Image integration. The top image of a LA from the PA perspective reconstructed from an MR scan of the heart taken pre-procedure. The image is registered with the 3D mapping system. The bottom image is the LA viewed from within at a left lateral projection so that the ablation lesions that have been delivered around the right pulmonary veins are visible.
Stay updated, free articles. Join our Telegram channel

Full access? Get Clinical Tree


