After quickly recognizing the absence of an emergent clinical situation, a systematic approach can be undertaken. Particular attention should be paid to:
- Rate
- Rhythm
- QRS axis
- Intervals (PR, corrected QT, and QRS width)
- T waves (inversion or peaking)
- ST segments and Q waves
- Chamber enlargement
- Other waves (e.g. the presence of U waves or delta waves).
2.2.1 Rate
Tachycardia is usually defined as a ventricular rate greater than 100 bpm, and bradycardia as a ventricular rate less than 60 bpm. The presence of tachycardia is important as it can signify the overall clinical condition of the patient. It should not be surprising to find tachycardia in a patient who is septic, febrile, post-operative, in pain, or anxious. Resting tachycardia can often signify congestive heart failure, patients with cardiac transplant, or thyrotoxicosis. Resting tachycardia due to arrhythmias, however, should not be overlooked, especially in elderly patients. One study performed in an Emergency Department found that more than 80% of subjects ≥51 y/o with a heart rate greater than 141 bpm were not in sinus rhythm. Conversely, subjects ≤50 y/o with a heart rate less than 120 bpm had a 99% probability of having sinus tachycardia. The sinus node’s ability to generate rapid rates decreases with increasing age, making rapid sinus rhythms quite unlikely at advanced ages.
Significant bradycardia can also be highly relevant when applied to the appropriate clinical context. A resting heart rate of less than 40 bpm in a patient who is symptomatically light-headed, or who presents with syncope, may be due to an excess of drugs that have atrioventricular (AV) nodal activity (e.g. beta-blockers, calcium-channel blockers, digitalis) or due to intrinsic conduction disease (e.g. sick sinus syndrome, AV block). Conversely, a resting heart rate less than 40 bpm can be considered normal in a conditioned athlete with heightened vagal tone at rest.
AV block, particularly complete heart block, should be considered when significant bradycardia is encountered. The ECG pattern of complete (3rd degree) AV block is characterized by the following traits: (1) a HR usually less than 40 bpm; (2) an atrial rate faster than the ventricular rate; and (3) AV dissociation, where the atrium and ventricle are both electrically independent of each other.
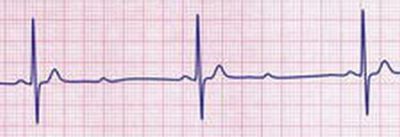
Other forms of AV block should also be considered when bradycardia without complete heart is present. Second degree type I block (also known as Wenckebach block) manifests with progressive prolongation of PR intervals followed by a blocked P wave and “dropped” QRS complex (Figure 2.2). AV Wenckebach is sometimes seen in healthy individuals, and can be noted during sleep or periods of heightened vagal tone. Second degree type II block (also known as Mobitz II block) occurs when a single QRS complex is “dropped” without a detriment in PR conduction (Figure 2.3).
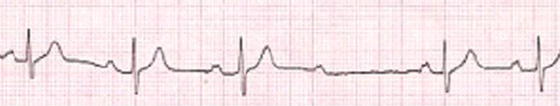
Figure 2.3 2:1 second degree type II block seen in a 78-year-old who presents with symptoms of presyncope.
Calculation of rate should be performed as precisely as possible. When taking an overall look at the ECG, tachycardia should be readily identifiable. With regular rhythms, a quick estimation of the rate can be calculated by multiplying the total number of QRS complexes present by 6 (the standard ECG paper moves at 25 mm/sec, and takes 10 seconds to print). With irregular rhythms, this is particularly helpful (and necessary) because of the variability in RR intervals. Another quick means of calculating the heart rate is to count the number of large boxes between QRS complexes and divide by 4 (because 300 × 0.02 seconds = 60 and the heart rate is calculated as the number of beats in 60 seconds).
2.2.2 Rhythm
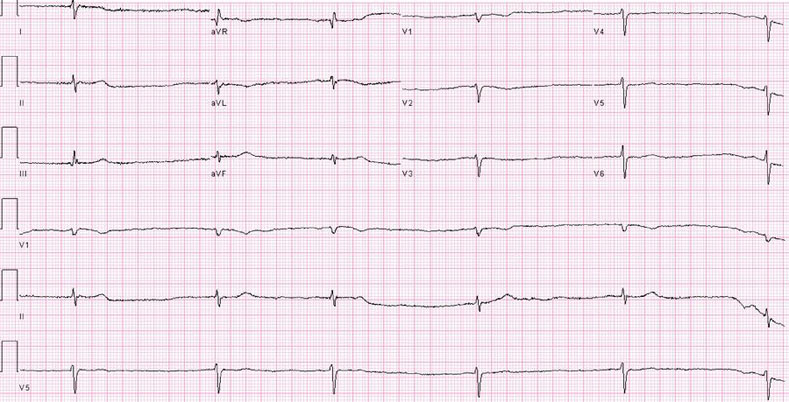
Identifying the inherent rhythm involved is critical, as differentiating between sinus and non-sinus rhythm confers different treatment strategies. An irregular rhythm may signify the presence of atrial fibrillation or atrial flutter with variable block, both of which may necessitate anticoagulation and possibly antiarrhythmics or cardioversion. Conversely, irregular rhythms such as multifocal atrial tachycardia or sinus rhythm with premature beats do not require such treatment strategies. Caution should be taken with rates that are very fast or very slow, as they may appear regular at first glance (Figure 2.4).
Figure 2.4 Atrial fibrillation with a very slow, relatively regularized ventricular response at approximately 42 bpm. Patient is not on digoxin. Findings are consistent with atrial and AV nodal conduction disease. A pacemaker was implanted. The ECG also shows an unusual rightward axis and slow R wave progression, raising question of COPD.
The term “sinus rhythm” denotes the presence of sinus P waves; however, it does not speak to the presence of a “normal” ECG. For example, the ECG of a patient with complete heart block could be described as “sinus tachycardia at a rate of 60 bpm with a ventricular escape rhythm at 25 bpm and 3rd degree AV block.” A sinus P wave should be upright in lead II, as lead II is pointed toward 60 degrees, which is roughly the direction the current takes when originating in the high right atrium toward the AV node. Ectopic P waves originating in the high right atrium may mimic sinus P waves, but will have a subtle morphologic distinction from the true sinoatrial P wave.
2.2.3 Axis
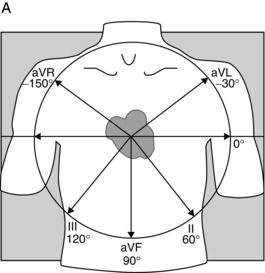
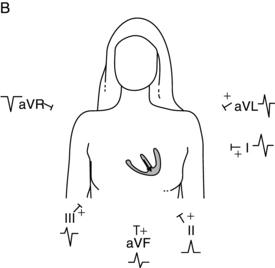
QRS axis configuration can be a difficult aspect of the ECG. As the depolarization current spreads through the ventricles, it changes direction throughout the cardiac cycle—it may be directed toward and away from any given lead at a moment in time. However, the overall electrical axis reflects the summed direction of the mean QRS vectors in the frontal plane (leads I, II, III, aVR, aVL, aVF). A normal axis is often defined as –30 degrees to 100 degrees. An axis less than –30 degrees is termed left axis deviation, and an axis greater than 100 degrees is defined as right axis deviation. Precise calculation of the axis is rarely necessary, and the electrocardiograph can perform this calculation accurately. However, one must be able to quickly determine the overall direction of the mean QRS axis (normal, leftward, or rightward; see Figure 2.5). To determine the axis on an ECG:
- Look at leads I and II.
- Identify the direction of the QRS complexes in those leads.
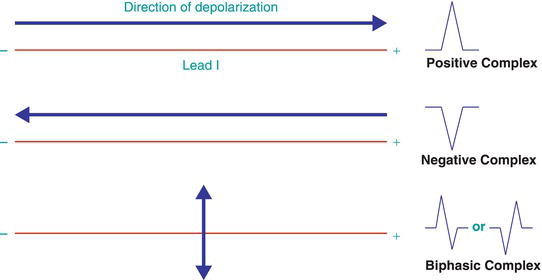
- If both are upright, the axis is normal; if lead I shows a positive QRS complex and lead II a mostly negative complex (S > R), the axis is leftward; if lead I shows a negative QRS complex and lead II a positive complex (R > S), the axis is rightward.
- The presence of biphasic QRS complexes will signify an orthogonal direction in that particular lead (Figure 2.6). For example, lead II is pointed toward 60 degrees. If there is a biphasic complex in lead II, forces are going at 90 degrees toward lead II, meaning at –30 degrees or at 150 degrees. Discerning which one is present involves looking at lead I (if lead I is negative, the axis would be extremely rightward at 150, and if positive, the axis would be –30 degrees). Of note, looking at leads I and aVF to determine axis may be unhelpful, especially if biphasic complexes are present, given leads I and aVF are at 90 degrees to each other. An upright QRS in lead I with a somewhat biphasic complex in aVF would signify an axis close to 0 degrees. However, if a biphasic complex is also present in lead II, the axis is more accurately determined as being less than 0 degrees.
- An undetermined axis may be present if the QRS complex has an unusual morphology, or if biphasic complexes are present in several of the limb leads.
Figure 2.5 A Axis determination via frontal plane leads. B Normal QRS axis. (Source: Adapted from F. Kusumoto, ECG Interpretation for Everyone, 2012. Reproduced with permission of John Wiley & Sons Ltd.).
The QRS axis has clinical significance. For example, a shift from normal to rightward axis may reflect acute rightward strain, as is present with an acute pulmonary embolism. Right ventricular hypertrophy may often be seen in cases of pulmonary hypertension and COPD. A leftward axis may represent left ventricular hypertrophy or a left anterior fascicular block.
2.2.4 Intervals
Stay updated, free articles. Join our Telegram channel

Full access? Get Clinical Tree


