Introduction to Echocardiographic Principles
Jose A. Madrazo
Suzanne V. Arnold
High-Yield Concepts
Pulsed-wave Doppler is RANGE specific but limited in the peak velocity it can measure.
Continuous-wave Doppler is able to measure HIGH velocities but cannot localize the origin along its beam.
M-mode has high TEMPORAL resolution but is limited by oblique imaging of structures of interest.
Key Formulas
Simplified Bernoulli Equation: ΔP(mmHg) = 4 × V 2 (V = m/sec)
LVOT area = π × (LVOT diameter in cm/2)2
Stroke volume = (LVOT area) × (LVOT TVI)
QP/QS = (RVOT area) × (RVOT TVI)/(LVOT area) × (LVOT TVI)
Continuity principle for aortic valve area = (LVOT area) × (LVOT VTI)/(AoV VTI)
Echocardiography uses sound waves to create images of the heart and other structures.
Sound waves are mechanical vibrations described in terms of frequency or Hertz (Hz) = the number of cycles per second.
The frequency used by the ultrasound transducer affects image resolution and tissue penetration.
High frequency = high resolution image, low tissue penetration.
Low frequency = low resolution image, high tissue penetration.
Ultrasound refers to sound waves with 20 kHz or higher.
Adult echocardiography typically uses frequencies of 2 to 7 MHz.
Transthoracic echocardiography employs low-frequency transducers (2 to 4 MHz), which allows deeper penetration through the chest wall but at the expense of reduced resolution.
Transesophageal echocardiography does not require deep tissue penetration and can use higher frequency transducers (3.5 to 7 MHz) to produce higher resolution images.
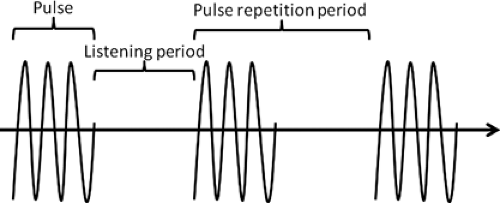
Figure 1-1. Description of ultrasound waves using standardized nomenclature.
Piezoelectric elements are crystals that convert electrical energy into mechanical sound waves and vice versa. These crystals are in the transducer and their properties, number, and movement determine the characteristics of the images obtained.
Harmonic imaging: Tissue and contrast bubbles not only reflect ultrasound at the transmitted frequency but also resonate at multiples of that frequency (harmonic frequencies). Harmonic imaging refers to setting the transducer to receive frequencies at multiples of the emitted frequency (e.g., Transmit at 3 MHz and receive at 6 MHz, the second harmonic). Harmonic imaging improves signal to noise ratio and the delineation of the endocardial border.
Mechanical index (MI): A measure of the mechanical pressure exerted on tissues by the ultrasound waves. It is important to lower the MI during contrast echocardiography so as not to burst the contrast bubbles quickly.
Frame rate: The number of still images displayed sequentially per unit of time. Multiple still images displayed sequentially lead to the perception of motion, thus higher frame rates lead to better temporal resolution but may sacrifice image quality and vice versa.
Pulse repetition period: A pulse of ultrasound of a given frequency is sent by the transducer followed by a prespecified “listening period” before the transducer senses waves of the same frequency and generates an image. The duration of the pulse plus the time spent listening is referred to as the pulse repetition period. The longer this period is the deeper the images obtained (Fig. 1-1).
Basic Imaging Modalities:
M-mode echocardiography:
M-mode echocardiography depicts the structures along the path of a single line of the ultrasound beam. The still image of these structures is continuously updated over time on the ‘x’ axis. Thus, the structures along the line of the ultrasound beam are depicted as they change with time (Fig. 1-2).
Because of its high sampling frequency (up to 1000 pulses per second), M-mode has excellent axial resolution and is useful in identifying the relative location of structures and measuring range of motion.
M-mode also has better temporal resolution than 2D imaging and thus subtle abnormalities in motion and timing may be better appreciated with M-mode. For
example systolic anterior motion of the mitral valve in HCM and right ventricular diastolic collapse in cardiac tamponade may be better appreciated by M-mode.
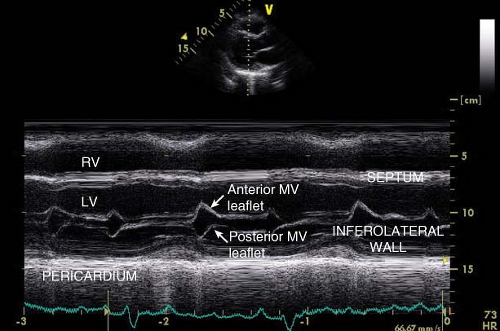
Figure 1-2. M-mode providing an “ice-pick” view of changes in cardiac structures seen in the parasternal long-axis view over time.
Two-dimensional echocardiography:
The cardiac structures in the plane defined by the transducer position are depicted in two dimensions on the screen and the screen is updated continuously (see frame rate above), thus producing a “movie.”
In adult echocardiography, structures closest to the transducer are displayed at the top of the screen, and the side of the ultrasound plane that corresponds to the notch on the transducer is on the right side of the screen.
Imaging the heart in multiple 2D planes allows for the reconstruction and visualization of all the parts of a 3D structure.
Three-dimensional echocardiography:
Multiple 2D planes can be pieced together in order to recreate a 3D structure. Modern 3D echocardiography transducers accomplish this by imaging along a pyramidal ultrasound beam (instead of a knife, the beam is an inverted cone with the tip at the transducer).
Doppler Principle and Applications:
Doppler effect:
Proposed in 1842 by Austrian physicist Christian Doppler, it is the change in frequency of a wave received by an observer (the reflected frequency) relative to the source of the wave (originating frequency).
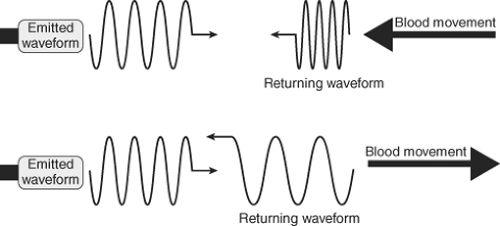
Figure 1-3. Diagram showing how the direction and speed of movement of an object changes the frequency of the reflected ultrasound wave (Doppler shift).
When sound is emitted from a source at a given frequency and it is reflected from a static source the waves return at the same frequency emitted.
However, when sound is reflected from a moving source the received frequency is shifted proportionally to the source’s velocity.
If the object is moving toward the transducer, the resulting frequency is higher than the originating frequency and there is a “positive Doppler shift.”
If the object is moving away from the transducer, the resulting frequency is lower than the originating frequency and there is a “negative Doppler shift” (Fig. 1-3).
The angle at which the object is moving relative to the observer influences the magnitude of the Doppler shift—that is, the measured velocity of the blood is related to both the true velocity of the blood and the angle at which it is measured.
From a mathematical perspective, the Doppler shift is proportional to the cosine of the angle between the sound emitter and the moving object: velocitymeasured = cosine of angle (Θ) × velocitytrue (Fig. 1-4).
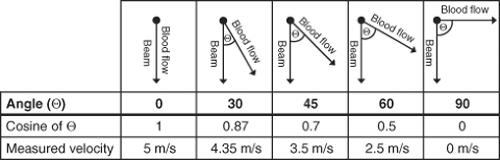
Figure 1-4. The effect of angle of insonation in measuring a jet with a true velocity of 5 m/s by Doppler echocardiography.
Pulsed-wave Doppler:
In pulsed-wave (PW) Doppler, the transducer sends pulses of ultrasound at a given frequency and interrogates for Doppler shift at a specific site defined in a 2D image (sample volume).
Pulse repetition frequency (PRF) refers to the number of pulses in one second, and is therefore inversely proportional to pulse repetition period. A low PRF is used to image deeper structures.
The PRF determines the depth at which the Doppler shift is evaluated.
Lower PRF allows for longer “listening time” between the pulses and therefore interrogates at a deeper level and vice versa.
Nyquist limit: Named after Swedish-American engineer, Harry Nyquist, who discovered that the number of pulses per unit time is limited to twice the bandwidth of the channel. In practical terms, Nyquist limit = one-half PRF.
If the velocity of blood flow exceeds the Nyquist limit, the direction and velocity are inaccurately displayed and appear to change direction, a phenomenon termed aliasing.
Stay updated, free articles. Join our Telegram channel

Full access? Get Clinical Tree


