% per year. In this chapter we give discuss the history and growth of 4D CT, describe the variability in respiratory motion, and state both the applications and limitations of 4D CT imaging.
1.1 Introduction
Four-dimensional (4D) radiotherapy started to emerge in the early 2000s. An American Society of Radiation Oncology (ASTRO) panel on Time: the  th Dimension in Radiotherapy at the 2003 annual meeting defined 4D radiotherapy as “the explicit inclusion of the temporal changes during the imaging, planning and delivery of radiotherapy”. The definitions were further refined as: [35]
Each of these areas have been substantially researched and developed in the intervening years, with key areas of motion estimation and modeling, deformable registration, and applications of these methods well beyond those originally envisaged such as lung ventilation imaging. Also, the limitations of existing hardware and software have been identified, with further refinements suggested and implemented. This book gives a detailed state-of-the-art insight into 4D CT image acquisition, 4D motion estimation and modeling, and 4D radiotherapy.
th Dimension in Radiotherapy at the 2003 annual meeting defined 4D radiotherapy as “the explicit inclusion of the temporal changes during the imaging, planning and delivery of radiotherapy”. The definitions were further refined as: [35]
4D thoracic computed tomography (CT) imaging: The acquisition of a sequence of CT image sets over consecutive segments of a breathing cycle
4D treatment planning: Designing treatment plans on CT image sets obtained for each segment of the breathing cycle
4D treatment delivery: Continuous delivery of the designed 4D treatment plan throughout the entire breathing cycle
1.2 Brief History of 4D CT
A key driver in 4D motion modeling and radiotherapy has been the development and widespread implementation of the more correctly termed respiratory correlated CT but more commonly termed 4D CT. The phenomenal growth of the technology is shown in Fig. 1.1. From its first inception and commercial availability in 2002–03 there has been a steady 7 % annual growth in the clinical implementation of this technology. In 2009 44 % of US cancer centers [71] used 4D CT; it is estimated that over 60 % of centers use this technology now. At Stanford University 4D CT is in routine use for planning lung, pancreas, liver and breast cancer treatments, with over 1000 scans estimated to have been acquired in the single institution.
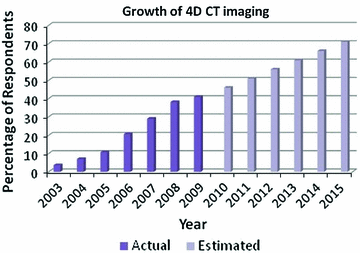
Fig. 1.1
The growth of the clinical implementation of 4D CT with time based on a survey of US radiation oncologists (394 respondents) [71]. Survey data courtesy of Drs. Daniel Simpson and Loren Mell, UC San Diego
Table 1.1
History of the development of 4D thoracic CT acquisition from 2003–2006
Development | Year | First author |
|---|---|---|
Multislice cine | 2003 | Low [46] |
Single slice helical | 2003 | |
Multislice cine (commercial) | 2003 | Pan [57] |
Cone beam (benchtop) | 2003 | Taguchi [79] |
Multislice helical | 2004 | Keall [38] |
Multislice cine PET/CT | 2004 | |
Cone beam (clinical) | 2005 | Sonke [73] |
Applications outside radiation oncology | 2005–2006 |
A summary of the early history of 4D CT developments is shown in Table 1.1. Despite the first 4D thoracic CT articles dating back only to 2003, there has been an intense clinical and commercial interest in this new technology, and the number of systems and clinical implementation of 4D CT are fast growing. The initial developments of 4D thoracic CT were on single slice scanners published in 2003 with the first commercial implementation on a multislice scanner available in the same year. 4D CT is now available from all major CT vendors. Four-dimensional cone-beam CT (CBCT) [73] and 4D PET/CT are currently active areas of development.
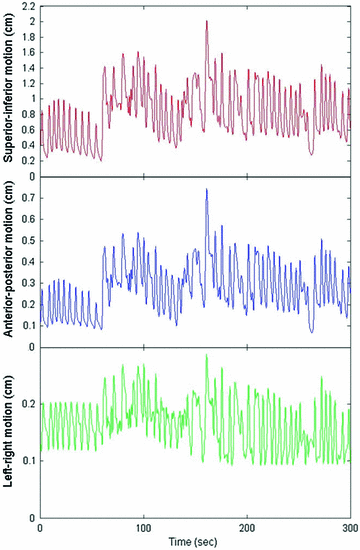
Fig. 1.2
Tumor motion variations over time in three dimensions observed during stereotactic body radiotherapy in Cyberknife Synchrony [77]: there are significant variations in tumor positions, respiratory baseline, and respiratory patterns
1.3 Respiratory Motion Statistics
During medical imaging and therapy procedures motion in the thorax and abdomen is predominantly caused by breathing, and therefore it is worth briefly reviewing respiratory motion statistics. Organs in the thoracic and abdominal regions move due to respiration. Patients’ respiration may vary, resulting in variations in the organ motion. Figure 1.2 shows an example of the variations in tumor positions, respiratory baseline, and respiratory patterns over time. The respiration-induced organ motion and the extent and degree of its variations are acknowledged in the literature. Table 1.2 summarizes the literature of the respiration-induced organ motion. A few guidelines for the respiration-induced organ motion are:
Organs translate, rotate, and deform due to respiration.
Significant variations have been observed in the extent, phase, direction, regularity, and linearity of the respiration-induced organ motion
The motion variations result in wide variations in tumor positions, tumor positions relative to critical structures, tumor motion hysteresis, respiratory baseline, and respiratory patterns, from cycle to cycle, from fraction to fraction, and from patient to patient.
The motion can be from 0 to 5 cm for free breathing, and averages cm for lung tumors and
  cm for liver and pancreas tumors
For lungs, the greatest motion is generally in the superior-inferior direction, whereas the least motion is in the left-right direction, and the motion tends to increase from the upper lobes to the lower lobes of the lungs.
Table 1.2
Literature summary of respiration-induced motion of organs in the thoracic and abdominal regions in three dimensions: mean extent (minimum-maximum) in millimeters. This is a summary and an update of Tables I and II in The American Association of Physicists in Medicine Task Group 76 [37]
Literature | Sites | Direction | ||
|---|---|---|---|---|
Superior-inferior | Anterior-posterior | Left-right | ||
(mm) | (mm) | (mm) | ||
Barnes et al. [5] | Lung, lower lobe | 18.5 (9–32) | – | – |
Lung, middle/upper lobe | 7.5 (2–11) | – | – | |
Bryan et al. [6] | Pancreas, shallow respiration | 20 (0–35) | – | – |
Case et al. [7] | Liver | 8.0 (0.1–18.8) | 4.3 (0.1–12.1) | 1.8 (0.1–7) |
Chen et al. [9] | Lung | (0–50) | – | – |
Davies et al. [11] | Diaphragm, shallow respiration | 12 (7–28) | – | – |
Diaphragm, deep respiration | 43 (25–57) | – | – | |
Kidney, shallow respiration | 11 (5–16) | – | – | |
Liver, shallow respiration | 10 (5–17) | – | – | |
Liver, deep respiration | 37 (21–57) | – | – | |
Ekberg et al. [15] | Lung | 3.9 (0–12) | 2.4 (0–5) | 2.4 (0–5) |
Engelsman et al. [16] | Lung, lower lobe | (2–9) | – | – |
Lung, middle/upper lobe | (2–6) | – | – | |
Erridge et al. [17] | Lung | 12.5 (6–34) | 9.4 (5–22) | 7.3 (3–12) |
Ford et al. [20] | Diaphragm, shallow respiration | 20 (13–31) | – | – |
Giraud et al. [24] | Diaphragm, deep respiration | 35 (3–95) | – | – |
Grills et al. [25] | Lung | (2–30) | (0–10) | (0–6) |
Hanley et al. [30] | Lung | 12 (1–20) | 5 (0–13) | 1 (0–1) |
Harauz et al. [31] | Liver, shallow respiration | 14 | – | – |
Korin et al. [41] | Diaphragm, shallow respiration | 13 | – | – |
Diaphragm, deep respiration | 39 | – | – | |
Murphy et al. [51] | Lung | 7 (2–15) | – | – |
Plathow et al. [59] | Lung, lower lobe | 9.5 (4.5–16.4) | 6.1 (2.5–9.8) | 6.0 (2.9–9.8) |
Lung, middle lobe | 7.2 (4.3–10.2) | 4.3 (1.9–7.5) | 4.3 (1.5–7.1) | |
Lung, upper lobe | 4.3 (2.6–7.1) | 2.8 (1.2–5.1) | 3.4 (1.3–5.3) | |
Redmond et al. [60] | Lung | 6.7 | 2.9 | 2.1 |
Ross et al. [64] | Lung, lower lobe | – | 1 (0–4) | 10.5 (0–13) |
Lung, middle lobe | – | 0 | 9 (0–16) | |
Lung, upper lobe | – | 1 (0–5) | 1 (0–3) | |
Seppenwoolde et al. [67] | Lung | 5.8 (0–25) | 2.5 (0–8) | 1.5 (0–3) |
Shimizu et al. [68] | Lung | – | 6.4 (2–24) | – |
Sixel et al. [72] | Lung | (0–13) | (0–5) | (0–4) |
Stevens et al. [74] | Lung | 4.5 (0–22) | – | – |
Suh et al. [77] | Lung | 4.8 (0.2*-14.4) | – | – |
Suramo et al. [78] | Kidney, shallow respiration | 19 (10–40) | – | – |
Kidney, deep respiration | 40 (20–70) | – | – | |
Liver, shallow respiration | 25 (10–40) | – | – | |
Liver, deep respiration | 55 (30–80) | – | – | |
Pancreas, shallow respiration | 20 (10–30) | – | – | |
Pancreas, deep respiration | 43 (20–80) | – | – | |
Wade [83] | Diaphragm, shallow respiration | 17 | – | – |
Diaphragm, deep respiration | 101 | – | – | |
Weiss et al. [84] | Diaphragm, shallow respiration | 13  5 5 | – | – |
Liver, shallow respiration | 13  5 5 | – | – | |
Chapter 4 is further expanding on the biophysics and on the possibility of computational modeling of pulmonary motion.
1.4 Methods for 4D Thoracic CT Imaging
An example of 4D CT scan acquisition is shown in Fig. 1.3. 4D CT image acquisition involves, firstly, the real-time recording of a respiratory signal simultaneously with over-sampled CT image acquisition. Over-sampling by re-imaging the same anatomy at different respiratory positions, typically by a factor of 8–15, is performed in order to obtain sufficient number of CT slices over a given longitudinal width so that there are enough images to achieve respiratory sorting with acceptable spatial accuracy. Over-sampled images from the CT dataset are sorted into several bins based on the information obtained from the respiratory signal. Such a sorting procedure results in the classification of the over-sampled images into several respiratory-sorted image bins, such as end-exhale, mid-inhale etc. A complete set of image bins acquired over a respiratory cycle constitutes a 4DCT dataset. Typically 8–15 respiratory bins are used. Further details and alternative a pproaches for 4DCT image acquisitions are given in Chaps. 2 and 3 of this book.
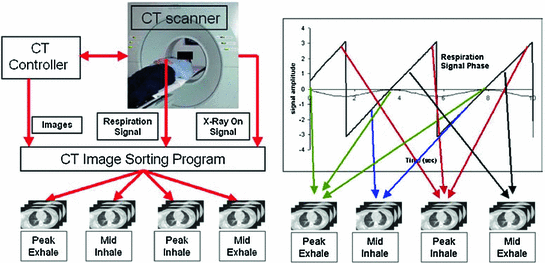
Fig. 1.3
An example of the basics of 4D CT image acquisition. The 4D CT sorting process: the CT images, breathing tracking signal and ‘X-Ray ON’ signal form the input data stream. The breathing cycle is divided into distinct bins (for example, peak exhale, mid inhale, peak inhale, mid exhale). Images are sorted into these image bins depending on the phase or displacement of the respiratory cycle in which they are acquired, yielding a 4D CT dataset. From Vedam et al. [81]. Further details on 4D CT image acquisitions are given in Chaps. 2 and 3 of this book
1.5 Respiratory Motion Estimation and Analysis
4D CT image data provides a rich source of information about pulmonary motion which is, however, not trivial to exploit for the benefit of radiation therapy. A tumor may be interactively tracked by defining landmarks in a set of CT images. To do this for several tumors is already cumbersome and very time consuming. Assessing breathing motion properties of the whole lungs, however, renders impossible without suitable image processing algorithms. Deformable image registration algorithms as discussed in Chaps. 5–8 play a crucial role in this context. They deliver whole lung motion vector fields that allow following an arbitrary tissue element through the breathing cycle. Based on this information, not only tumor motion can be assessed, but also further physiologically relevant lung properties like the local expansion and contraction of lung parenchyma (local ventilation ).
Non rigid image registration can also be used to adjust the treatment plan in case of organ motion, to avoid completely anew organ contouring. The motion may have occurred between two radiation fractions or within, e.g. due to breathing motion.
While 4D CT imaging is well suited to assess pulmonary motion, it is not always available when needed, especially not during the actual treatment sessions. Therefore the idea has been followed to create patient specific motion models based on 4D CT image data. In combination with breathing motion surrogates, which can be measured during radiation therapy, these models can be used to estimate the location and velocity of an arbitrary lung tissue element during treatment. Suitable surrogates can be body motion visible from outside the body, e.g., chest wall and abdominal motion, but also internal motion, e.g., diaphragm motion as imaged using an on-board X-ray imaging device. Methods to generate breathing motion models, how to correlate them with breathing surrogates, are introduced in Chaps. 9 and 10.
1.6 4D CT Artifacts
Despite the potential and clinical applications of 4D CT, there are several limitations, such as the increased acquisition time (by an additional 2–10 min depending on the scanner configuration), additional post-processing time and additional radiation dose as the same anatomy is imaged several times at different respiratory states. However, a major limitation of current 4D CT technology are the imaging artifacts due to irregular breathing. The prevalence of artifacts, as well as ongoing methods to improve these artifacts are discussed below.
1.6.1 Quantification of Artifact Frequency and Magnitude
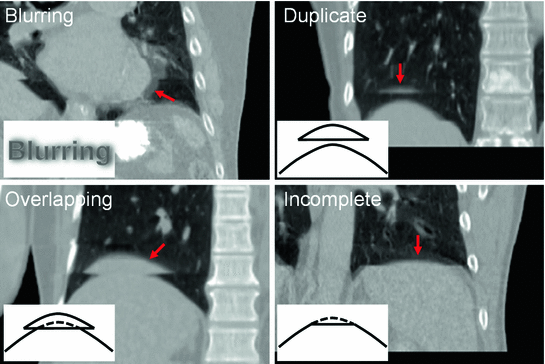
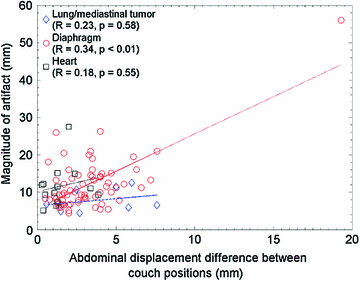
Typically there are temporal variations in patient breathing patterns, which lead to mismatches in the respiratory phases or displacements between two adjacent couch positions (data segments) in a 4D CT scan. These variations could manifest as artifacts in the coronal 4D CT images for the current retrospective phase-based sorting methods [1, 14, 18, 26, 44, 48, 52, 56, 58, 62, 63, 90]. 4D CT artifacts can be classified into four types: blurring, duplicate structure, overlapping structure, and incomplete structure as shown in Fig. 1.4. The blurring artifact occurs within a couch position, when the organ motion exceeds the temporal resolution of scanning due to the finite gantry rotation time. In contrast, all the other artifacts occur at an interface between two adjacent couch positions due to a difference in respiratory states. We manually quantified the frequency and magnitude of artifacts in 50 consecutive cine 4D CT images created by retrospective phase-based sorting, and found an alarming result, i.e., 45 of 50 patients (90 %) had at least one artifact (except blurring) with a mean magnitude of 11.6 mm (range, 4.4–56.0 mm) in the diaphragm or heart [90]. Statistical analysis revealed that the patients with artifacts had a significantly larger motion variability between respiratory cycles compared to the patients without artifacts ( ). Furthermore, the magnitude of artifact in the diaphragm was found to be weakly, but significantly correlated with the abdominal displacement difference (surface mismatch) between two adjacent couch positions (
 ,
,  , see also Fig. 1.5). These results indicate a need for improved respiratory reproducibility and/or significant improvements in 4D CT methods.


). Furthermore, the magnitude of artifact in the diaphragm was found to be weakly, but significantly correlated with the abdominal displacement difference (surface mismatch) between two adjacent couch positions (, , see also Fig. 1.5). These results indicate a need for improved respiratory reproducibility and/or significant improvements in 4D CT methods.Fig. 1.4
Example 4D CT images with artifacts: blurring, duplicate structure, overlapping structure, and incomplete structure. Schematic diagrams of respective types of artifacts are also shown. Corresponding artifacts are indicated by red arrows. From Yamamoto et al. [90]
Fig. 1.5
Abdominal displacement difference between two adjacent couch positions (data segments) versus absolute magnitude of artifacts in tumor, diaphragm and heart. From Yamamoto et al. [90]
< div class='tao-gold-member'>
Only gold members can continue reading. Log In or Register to continue
Stay updated, free articles. Join our Telegram channel
Full access? Get Clinical Tree
