, Xiaoyi Jiang1, Mohammad Dawood2 and Klaus P. Schäfers2
(1)
Department of Mathematics and Computer Science, University of Münster, Münster, Germany
(2)
European Institute for Molecular Imaging, University of Münster, Münster, Germany
Molecular imaging is gaining more and more importance, particularly Positron Emission Tomography (PET) being the tomographic modality with the highest molecular sensitivity. However, motion is a known problem for many medical imaging modalities that require a minimum acquisition time to collect the relevant information for image generation. Emission tomography techniques, such as PET or Single Photon Emission Computed Tomography (SPECT) are particularly affected by motion since respiratory and cardiac motion lead to image degradation in thoracic studies. Image blurring and wrong attenuation correction are possible unwanted consequences which can impair clinical diagnosis.
The aim of this chapter is to provide insight into the backgrounds necessary for motion estimation and motion correction in PET. This includes an introduction to the modality PET itself, gating, and effects which impair image quality, i.e., Partial Volume Effects (PVE). This chapter concludes with an overview of state-of-the-art literature regarding motion estimation respectively motion correction.
1.1 Motivation
Both respiratory and cardiac motion are sources of degradation in thoracic PET since the PET images are acquired over an elongated period of time (in the range of minutes). During this acquisition time lung and heart motion occurs which leads to imaging artifacts: wrong attenuation correction and image blur. Attenuation correction is the method of correcting the PET data for the effects of photon absorption in the body. Dense tissues like bones absorb a larger part of the photons than less dense tissues like lungs. Therefore, PET images without attenuation correction show apparently greater activity in areas with less density. This effect is corrected by scaling the number of photons registered in the PET scanner in accordance with the density of tissues. When using Computed Tomography (CT) for attenuation correction, the CT images themselves hardly suffer from motion since they are usually acquired during breath holding and can be corrected for cardiac motion by prospective electrocardiogram (ECG) triggering. In the presence of severe motion, however, part of the PET data may not be in spatial correspondence with the CT data and will be wrongly corrected for attenuation, e.g., activity from the heart may be corrected with lung density [11, 34, 56, 105, 106], cf. Fig. 2.13.
Another unwanted effect of motion is image blur. Motion at the source of radioactive emission results in a spatial blurring in the reconstructed PET images proportional to the magnitude of motion and thus loss of contrast. Generally, the inherent motion during PET image acquisition has a number of negative consequences like wrong attenuation correction (see above), misstaging of tumors [42], inaccurate localization of lesions [105], and wrong calculation of standard uptake values [96]. Therefore, there is a strong need of reducing motion artifacts for advanced PET imaging.
Gating-based techniques were found applicable for this purpose [87]. Gating is the decomposition of the whole data set into units that represent different breathing and/or cardiac phases [23], cf. Sect. 1.3. After gating, each single gate shows little motion only, but suffers from a relatively low Signal-to-Noise-Ratio (SNR) and a reduced contrast as only a small portion of all available events is used [133]. The fact that images contain both cardiac and respiratory motion motivates the reduction of both types by means of dual gating introduced in Sect. 1.3.3. Most approaches in the literature deal with respiratory motion only. However, as maximal displacements for cardiac motion of  [134] are in the same range as maximal respiratory displacements of
  [122], the cardiac motion component should be treated as well.
 [134] are in the same range as maximal respiratory displacements of
  [122], the cardiac motion component should be treated as well.
The effect of motion and gating is demonstrated in Fig. 1.1 with cardiac planes of a human heart (20 min18F-FDG PET scan without attenuation correction). An introduction to the used visualizations is given in Sect. 1.6. A reconstruction of the whole data set without gating can be seen in Fig. 1.1a. Respiratory and cardiac motion causes an obvious blurring of the heart contour. In contrast, a single phase of the respiratory and cardiac cycle (dual gating with five respiratory and five cardiac gates) is shown in Fig. 1.1b. The blurring is clearly reduced. However, simultaneously the amount of noise is increased due to the reduced number of events used for the reconstruction. Furthermore, motion leads to an apparently higher blood pool activity in the image without gating compared to the other images. This phenomenon is illustrated with line profiles in Fig. 1.1d. The left plot shows the line profiles of the first column from left to right (respectively the second column from left to right). The middle plot shows the line profiles of the first column from top to bottom (respectively the third column from top to bottom). The right plot shows the line profiles of the second column from bottom to top (respectively the third column from left to right). The maximum peaks of the dotted profile (no gating) are clearly lower in the central plot compared to the dashed profile (single gate). The overall aim of gating-based motion correction is to combine the reduced blurring achieved by gating in Fig. 1.1b with the full statistics of the whole measurement in Fig. 1.1a towards enhanced motion compensated PET images. A preview of the result after applying our proposed methods is finally given in Fig. 1.1c.
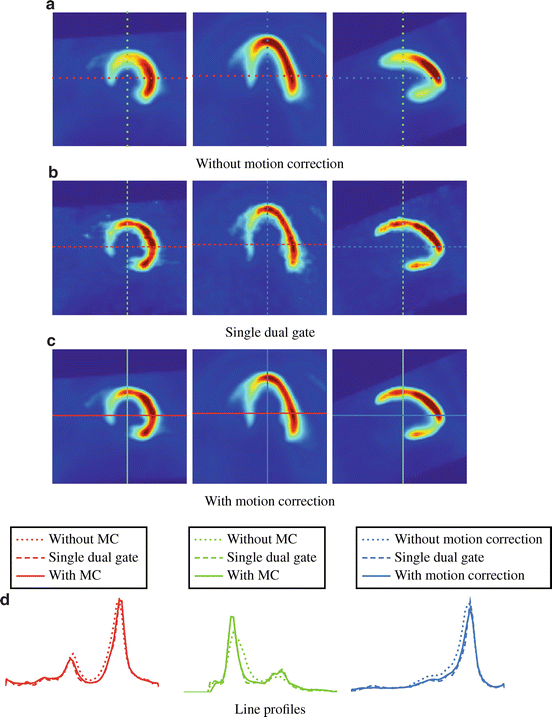
Fig. 1.1
(a) Slices of the cardiac axes of a reconstruction using the whole acquired PET data, (b) one single respiratory and cardiac phase, and (c) after Motion Correction (MC). The image with MC (using our Vampire method) combines the advantages of the above images: reduced motion artifacts and a low noise level. Line profiles are given in (d)
1.2 Positron Emission Tomography
PET is a non-invasive molecular imaging technique used in medical diagnostics. In contrast to morphological imaging modalities like CT, functional, i.e., metabolic, processes can be visualized and quantified.
A radioactively labeled substance called tracer is administered to a patient. A typical tracer is Fluorodeoxyglucose (18F-FDG) where glucose is radioactively labeled using the β + emitting isotope18F. The emission of radiation, based on β + decay, is detected by a scanner and a volumetric image of the tracer concentration can be reconstructed to visualize the metabolism.
During the β + decay of a18F nucleus a proton p is converted into a neutron n while a positron e + and an electron neutrino ν e is emitted

The positron travels through the nearby tissue while loosing energy (velocity) by interacting with adjacent atoms. The positron then collides with a nearby electron e − which is its antiparticle, having the same mass, but opposite charge. As a result of this annihilation, two gamma photons γ are produced with 511 keV which are emitted approximately in opposite directions (angle of ∼ 180°)

This process is illustrated in Fig. 1.2.

(1.1)

(1.2)
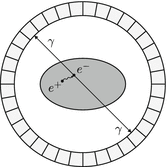
Fig. 1.2
As a result of β + decay, the emitted positron e + annihilates with a nearby electron e − which results in two gamma photons γ traveling in opposite direction. These photons can be recorded by detectors, circularly arranged around the patient. The length of the path of the positron to the electron (positron range, see Sect. 1.4.2) is rather short with about  Full Width Half Maximum (FWHM) [109]
 Full Width Half Maximum (FWHM) [109]
The architecture of most PET scanners is based on circularly arranged detector blocks, see Fig. 1.2. Each detector block consists of a certain number of single detectors elements. To increase the Field Of View (FOV) and the sensitivity of the scanner, several detector rings are usually stacked together.
If a single gamma photon (within a pre-defined energy window) is detected by the scanner, a short time window of a few nanoseconds (ns) is opened. A photon arriving at an opposite detector within this time window is assumed to be the corresponding partner photon originating from the same annihilation process. In this case we speak of a coincidence. It is assumed that the underlying radioactive decay has its origin somewhere on the line connecting these two detectors. This idea forms the basis for image reconstruction where these lines are called Lines Of Response (LOR).
The acquisition mode in PET can either be list mode or sinogram mode. In list mode acquisition, the coincidences that are detected by the PET scanner are written into a list. Each list item contains a time tag and the detector pair that registered the coincidence. For many reconstruction techniques, the list is processed in a rebinning step to a so called sinogram (line-integral data). The sorting of the sinograms is based on the angle of each view and tilt. In sinogram mode acquisition, the sinogram data is computed directly without outputting the list mode data.
Based on a huge number of these coincidences it is possible to reconstruct a 3D image volume. During this reconstruction process, various physical effects (e.g., photon attenuation, photon scattering, randomly detected coincidences, etc.) can be accounted for and dedicated corrections can be applied. Ideally, the underlying radioactivity concentration can be derived from the images in absolute numbers making PET to a unique non-invasive imaging technique.
1.3 Gating of PET Data
We have seen in Sect. 1.1 that the quality of PET images is corrupted by inherent cardiac and respiratory motion. A common approach to reduce motion artifacts is to perform so-called gating. The basic idea of gating is to divide the list mode stream into small units according to the different motion phases. Each of the small units contains only measured data which belongs to the corresponding motion phase. Subsequently the image of each individual motion phase is reconstructed.
As a consequence, the amount of motion in each image is reduced to a minimum. However, the motion reduction comes along with a simultaneous reduction of statistics. An unwanted increase in the noise level and a reduced image contrast is the result [133]. The problem of increased noise and reduced contrast can be overcome by motion correction techniques, as discussed in this book. The basic idea of these techniques is to estimate motion between the different motion phases and correct for it, which finally allows to use all available list mode information for the motion corrected image.
Gating techniques are based on list mode streams (cf. Sect. 1.2) which particularly provide information about the exact time of detection for each coincidence. If a synchronized motion signal (e.g., respiratory and/or cardiac) is recorded simultaneously to the PET measurement, each event can be assigned a particular motion phase. The fraction of events belonging to only one of these motion phases can then be used to reconstruct an image, representing the particular motion phase, which we call gate.
The prerequisite for gating is thus the extraction of motion information in terms of a gating signal. This can either be done extrinsically or intrinsically. Extrinsically means that the actual motion is derived from external measurable correlated motion. Intrinsically means that the actual motion itself is measured. Examples for the acquisition of the gating signal are given for respiratory and cardiac gating in Sects. 1.3.1 and 1.3.2.
The subdivision or binning of the gating signal can be performed
whereas each method can either be with
Equal widths or
Variable widths
throughout all cycles. For variable widths the division can again either be with
Equal widths within each cycle or
Variable widths within each cycle.
Specific information about the individual gating schemes for respiratory and cardiac motion are summarized in Sects. 1.3.1 and 1.3.2. We will further derive the combination of both gating schemes, entitled dual gating, in Sect. 1.3.3. More information regarding gating is also given in Chap. 4 where possible future advances and developments in the field of PET motion correction are discussed.
1.3.1 Respiratory Gating
The correction of respiratory motion is considered primarily in the literature of thoracic PET as respiration can lead to attenuation induced artifacts, cf. Sect. 1.1. The objective of respiratory gating is thus to create a set of images that represent the different motion phases of respiration, going from expiration to inspiration or vice versa. To allow a partition of the list mode stream, a synchronized respiratory signal is needed for the PET measurement.
Extrinsic devices [34, 98] (like pressure sensor, spirometer, temperature sensor, external markers, camera devices) are commonly used to obtain the respiratory signal. A monotonic correlation of the extrinsically obtained signal to the breathing motion is assumed. In practice, this assumption is approximately valid [67, 116].
Recently, intrinsic data driven gating schemes have been investigated as they do not require any extra effort at the time of the scan in terms of auxiliary measurements [23]. The respiratory signal is estimated on basis of list mode data itself. To this end, the list mode stream is divided into small time frames (about 50 ms [23]) with subsequent computation of the axial center of mass along the scanner axis of the measured counting rates in the respective frames. The respiratory signal can then be deduced from changes in the center of mass.
The illustration of an amplitude-based respiratory gating scheme with variable widths and equal widths within each cycle is shown in Fig. 1.3. This scheme was found to be superior to other gating schemes [35].
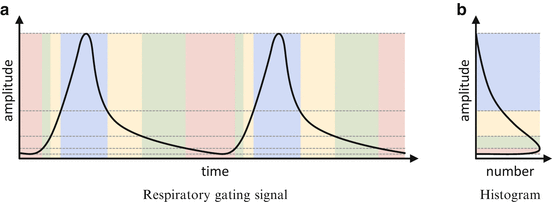
Fig. 1.3
The respiratory signal (solid black curve in (a)) is processed into a histogram in (b). The amplitude is divided into sections (vertical sections in (b)) with variable widths such that each section has the same area under the curve of the histogram. The amplitude subdivision remains constant throughout all cycles. This subdivision is transferred back to the respiratory gating signal which is then divided into different temporal sections (horizontal sections in (a)). All sections belonging to the same vertical section in (b) together represent one of the respiratory gates
An example of respiratory gating applied to patient data can be seen in Fig. 1.4. The list mode data set was divided into four gates according to an amplitude-based respiratory gating scheme with variable widths and equal widths within each cycle, cf. Fig. 1.3. More gates, typically in the range of eight to ten gates, are used in practice [36].

Fig. 1.4
The amplitude-based respiratory gating scheme in Fig. 1.3 was applied to patient data (20 min18F-FDG PET scan without attenuation correction). The respiratory signal was extracted with the data driven method proposed in [23]. The images show coronal slices of the left ventricle going from expiration to inspiration. The axial (up-down) motion is clearly visible
1.3.2 Cardiac Gating
The objective of cardiac gating is to create a set of images that represent the different motion phases of the cardiac cycle, going from diastole over systole back to diastole. For capturing the cardiac motion, a triggered ECG file can be recorded (synchronized) to the PET scan. Usually only the R-wave time points are stored. Based on this information a phase-based subdivision can be performed with equidistant or variable intervals.
Apart from the fact that the whole ECG curve is usually not recorded (only the R-wave time points), the amplitude of the ECG signal does not (monotonically) correlate with the true cardiac motion. Therefore, a phase-based cardiac gating should be preferred. A phase-based cardiac gating with variable widths which are equidistant within one cycle is illustrated in Fig. 1.5.
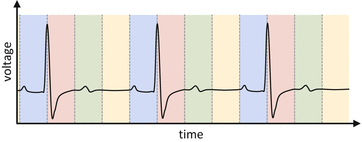
Fig. 1.5
An ECG signal (solid black curve) is divided into variable sections which are equidistant within one cycle (colored areas). The totality of all like-colored sections represent a single cardiac gate
An example of cardiac gating applied to patient data can be found in Fig. 1.6. The list mode data set was divided into four gates according to an phase-based cardiac gating with variable widths which are equidistant within one cycle, cf. Fig. 1.5. Similarly to respiratory gating, more gates (about ten gates) are typically used in practice.

Fig. 1.6
The phase-based cardiac gating in Fig. 1.5 was applied to patient data (20 min18F-FDG PET scan without attenuation correction). The R-wave time points of an ECG signal were used to perform cardiac gating. The images show coronal slices of the left ventricle going from diastole over systole back to diastole. The contraction of the heart is clearly visible
Cardiac motion is hitherto rarely considered in methods for motion correction. It poses new challenges to motion correction techniques due to partial volume effect (see Sect. 1.4) induced intensity modulations. This issue is addressed and resolved in Chap. 2 (Sect. 2.1.4 respectively Sect. 2.2.4) as one of the major contributions of this book.
1.3.3 Dual Gating
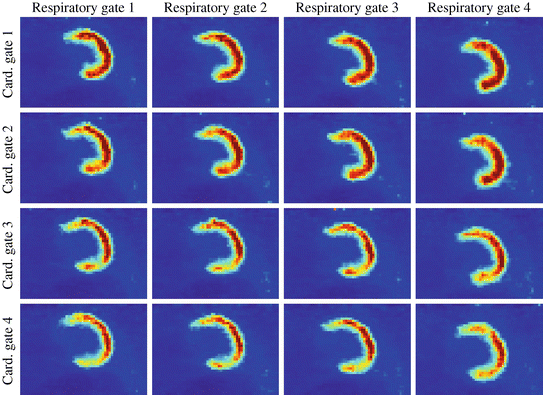
In pure respiratory gated PET, each gate still contains cardiac motion. Analogously, pure cardiac gated PET images still contain respiratory motion. This can be observed in Figs. 1.4 and 1.6. Dual gating is an attempt to even further reduce the amount of motion contained in the images [74, 76, 81, 82, 92, 127]. In dual gating, an n × m matrix of n cardiac and m respiratory images is built, i.e., each cardiac phase is over again divided into all respiratory phases (or vice versa). Consequently, time information about cardiac and respiratory motion is required. Options for the division of the individual components of motion are discussed in the above Sects. 1.3.1 and 1.3.2. For a more detailed explanation of dual gating we refer to [92].
The same patient data used for the pure respiratory and pure cardiac gating in Figs. 1.4 and 1.6 serves as the basis for the 4 × 4 dual gating shown in Fig. 1.7. It can be seen that dual gating features an increased reduction of motion artifacts compared to pure respiratory or pure cardiac gating. This is, of course, accompanied by increased noise levels. Techniques to overcome the noise problem are provided in Sect. 3.2 with a simplified pipeline for motion correction.
1.4 Partial Volume Effect and Mass-Preservation
The basic principles of the PET image generation process were already introduced in Sect. 1.2. In this section we will discuss some further properties of this process, known as the Partial Volume Effect (PVE), which lead to a loss of spatial resolution. The PVE can be divided into two distinct components:
1.


Tissue fraction (Sect. 1.4.1) and
Stay updated, free articles. Join our Telegram channel

Full access? Get Clinical Tree


