, Chandan Karmakar3, Michael Brennan3, Andreas Voss4 and Marimuthu Palaniswami3
(1)
Department of Biomedical Engineering, Khalifa University, Abu Dhabi, UAE
(2)
Department of Electrical and Electronic Engineering, The University of Melbourne, Melbourne, VIC, Australia
(3)
Electrical and Electronic Engineering, The University of Melbourne, Melbourne, VIC, Australia
(4)
Department of Medical Engineering and Biotechnology, University of Applied Sciences Jena, Jena, Germany
Abstract
The study of heart rate variability (HRV) focuses on the analysis of beat-to-beat fluctuations in heart rate and the diagnostic ability that these fluctuations provide. The series of time intervals between heartbeats, referred to as RR intervals, are measured over a period of anywhere from 10 min to 24 h and form the most commonly studied HRV time series (Rompelman et al., Med. Biol. Eng. Comput. 15(3):233–239, 1977). The great majority of variability witnessed in heart rate records is due to the autonomic nervous system modulating heart rate (Jalife and Michaels, Vagal Control of the Heart: Experimental Basis and Clinical Implications, ed. by Levy and Schwartz, Futura, New York, 1994, pp. 173–205). Accordingly, attention has focused on HRV as a method of quantifying cardiac autonomic function. Vagal tone is the dominant influence under resting conditions and the majority of heart rate fluctuations are a result of vagal modulation (Chess et al., Am. J. Physiol. 228:775–780, 1975). This provides clinicians with a reliable, non-invasive technique to monitor parasympathetic nervous activity. This, and other information that can be derived from HRV records, is of great importance to clinicians in the diagnosis, treatment and study of many illnesses related to the cardiovascular and autonomic systems.
1.1 Heart Rate Variability Techniques in Cardiology
The study of heart rate variability (HRV) focuses on the analysis of beat-to-beat fluctuations in heart rate and the diagnostic ability that these fluctuations provide. The series of time intervals between heartbeats, referred to as RR intervals, are measured over a period of anywhere from 10 min to 24 h and form the most commonly studied HRV time series [1]. The great majority of variability witnessed in heart rate records is due to the autonomic nervous system modulating heart rate [2]. Accordingly, attention has focused on HRV as a method of quantifying cardiac autonomic function. Vagal tone is the dominant influence under resting conditions and the majority of heart rate fluctuations are a result of vagal modulation [3]. This provides clinicians with a reliable, non-invasive technique to monitor parasympathetic nervous activity. This, and other information that can be derived from HRV records, is of great importance to clinicians in the diagnosis, treatment and study of many illnesses related to the cardiovascular and autonomic systems.
1.1.1 The RR Intervals
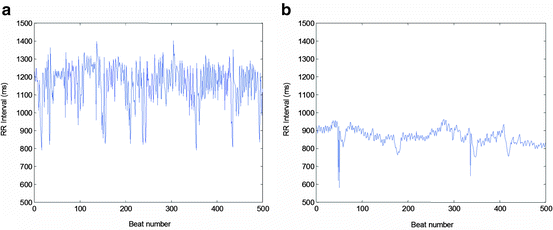
In HRV, an ECG recording is taken and processed to locate the times of the heartbeats. This is done by locating the R waves in the ECG recordings, as they are the largest deflection and the wave that is able to be most precisely located. The times between successive R waves, the so-called RR intervals, is the time series that is a result of this process. Figure 1.1 details the construction of the RR intervals from the ECG. Short-term recordings or long-term recording of ECG can be made. Short-term recordings are usually at least 5 min long, but not substantially longer so as to guarantee stationarity. Long-term recordings are usually made for 24 h using a portable Holter recording device. Subjects who are healthy generally exhibit a large degree of variability in the RR interval records. This is due to the active operation of various control loops governing HRV. Subjects who are diseased tend to have reduced HRV. This may be a consequence of sections (or all) of the systems regulating heart rate being damaged. It might also be due to an alteration in autonomic nervous behaviour secondary to the effects of a disease not directly affecting the cardiovascular system. Figure 1.2 shows two example of RR interval records. The first (Fig. 1.2a) is of a healthy individual and a substantial degree of variability is present, including high- and low-frequency variability. The second (Fig. 1.2b) record is of heart failure subject who has suffered considerable damage to the parasympathetic nervous system. The level of variability in this record is much less than the healthy subject. The lack of variability is primarily of the high-frequency variety as would be expected for degraded parasympathetic function (parasympathetic control is the only quick-acting modulator of heart rate).


Fig. 1.1
The RR intervals are constructed from the intervals between successive R waves

Fig. 1.2
RR interval series is of a healthy subject (a) and is of a subject with heart failure (b)
HRV analysis’ primary purpose is to assess the function of the nervous system. It is specifically not interested in determining whether the heart, as an individual unit, produces normal sinus beats. Analysing the ECG directly best assesses problems with beat formation. HRV analysis assumes that each individual heartbeat is a normal heartbeat with a normal ECG signature. In other words, RR interval records should only contain heartbeats that were generated under sinus origin. This is known as being in “sinus rhythm”. The autonomic nervous system directly controls the sinus nodes rate of firing. When an ectopic pacemaker controls the heart, the RR interval series don’t contain any information on the function of the nervous system. In summary, HRV assesses the hearts rhythm, not how the heart actually forms a beat.
1.2 History of Heart Rate Variability
Since ancient times, it has been known that there exists considerable variability in heart rate even when the body is at rest. The fact that respiration was involved in generating the heart rate fluctuations was well known, even in very early times, because it causes easily noticeable short-term heart rate fluctuations. In 1733, Steven Hales was able to report that beat-to-beat HRV was synchronous with respiration [4]. Even though this cause and effect relationship was established, it took until much later for this fact to be put to a clinical use. That time came with the advent of the digital computer, which allowed long-term heart rate records to be collected and analysed. In 1965 Hon and Lee reported that heart rate patterns during foetal distress altered significantly earlier than did mean heart rate [5]. Bedside tests derived from short-term RR intervals were developed by Ewing to detect diabetic neuropathy [6]. Both these works were based on the known effects of respiration on heart rate. The next major development came as it was being realized that the rhythms in heart rate were more complicated than just respiration. The early 1970s saw a concentration of work describing the physiological rhythms embedded in the heart rate signal, including vasomotor activity, thermal regulation and respiration [7–10]. In 1977 Wolf et al. showed that those with reduced HRV were at higher risk of postinfarction mortality [11]. In other words, patients who have survived a heart attack, but with little to no HRV, were in a high-risk category for low survival probability. Akselrod et al. used power spectral analysis to quantitatively evaluate cardiovascular control in 1981 [12]. The significance of this result was that heart rate records could be decomposed into separate signals that represented the operation of the different divisions of the autonomic nervous system. The emergence of spectral analysis allowed the autonomic basis of HRV to be explored [13, 14]. In the late 1980s the importance of HRV analysis became appreciated when it was shown to be a strong independent predictor of mortality after acute myocardial infarction [15–17]. As heart attack is a major problem in today’s society, this result was received with much enthusiasm, as HRV is a cheap, non-invasive technique that could lead to significantly better health care and recovery management. Lately, with the development of nonlinear mathematics and chaos theory, it has come to light that HRV signals appear to have much in common with chaotic time series. Much has been made of this, and the various statistics used to characterize chaotic time series have been applied to HRV classification [18–20]. These results are not yet convincing, but the hope is that nonlinear dynamics may be able to unravel the high-level operation of the cardiovascular system, which is known to be a nonlinear system.
HRV is becoming a valuable tool for the clinician. Many studies have been done on the use of HRV as an indicator of disease, and an index of risk for sudden death. A brief outline of some of the major findings is as follows:
Myocardial Infarction:
Myocardial infarction or “heart attack” is the death of tissue comprising the walls of the heart chambers (the myocardium). This usually occurs from lack of oxygen (ischaemia) due to low levels of blood flow to the heart. Myocardial ischemia caused by coronary occlusion has been shown to be accompanied by excited sympathetic activity [21]. Autonomic activity has been shown to be closely related to susceptibility to ventricular fibrillation [22]. In general, increased sympathetic activity was found to predispose to malignant ventricular arrhythmias, and increased parasympathetic activity provided a protective and antifibrillatory effect [23]. These findings have provided the impetus to study the use of HRV as a non-invasive tool to evaluate alterations of autonomic control in patients following myocardial infarction [24–34].
Risk Stratification Postinfarction:
Risk stratification is designed for early identification of the patient at high risk for complications. The aim is to implement appropriate prophylactic therapy to prevent re-infarction or sudden death. Of deaths following infarction, 75% are due to an arrhythmic mechanism and the remainder are due to myocardial pump failure [35]. HRV is a very useful prognostic index, probably because it reflects reduced vagal and increased sympathetic activity [16, 36]. A recent major study has shown that reduced 24 h SDRR is a powerful independent predictor of cardiac events following arrhythmic myocardial infarction [37].
Hypertension:
Hypertension is the medical term for high blood pressure. Several functional alterations of the cardiovascular system are frequently found in hypertensive patients. These alterations may increase their risk beyond that induced by elevated blood pressure alone. Left ventricular hypertrophy (LVH), which is a swelling of the left ventricle, secondary to hypertension, is one such example. Reduced high-frequency HRV has been shown to correlate with LVH and a worse prognosis after arrhythmic myocardial infarction [38].
Diabetes:
Diabetes can cause severe autonomic dysfunction that can be responsible for several disabling symptoms, including sudden cardiac death (SCD) [39]. Although traditional measures of autonomic function are able to document the presence of neuropathy, in general they are only abnormal when there is severe symptomatology. Thus, by the time changes in function are evident, the natural course of autonomic neuropathy is well established. HRV analysis is able to detect the change in autonomic balance before neuropathy is established [40].
Sudden Cardiac Death:
Ventricular tachyarrhythmias represent a leading cause of SCD in the community [34, 41]. The study by Farrell et al. [42] reported that decreased HRV was more predictive of subsequent arrhythmic events than the presence of late potentials (Holter-derived arrhythmias treadmill exercise test results or left ventricular ejection fraction). In multivariate analysis of combinations of risk factors, the combination of late potentials recorded by the signal averaged ECG and reduced HRV was more predictive than any other combination.
Coronary Artery Disease:
Studies using short-term measures of HRV demonstrated an inverse relationship between cholesterol and vagal activity [43]. This raises the possibility that a high cholesterol level may directly or indirectly influence cardiac autonomic tone.
Heart Failure:
Conflicting evidence as to the correlation between the degree of myocardial damage sustained following a myocardial infarction and HRV in humans [44, 45]. In patients with heart failure, one study showed a significant linear correlation between HRV and ejection fraction [46] while others have not [45].
Smoking and Alcohol:
Smokers have increased sympathetic and reduced vagal activity as measured by HRV analysis [47]. HRV is reduced following ingestion of alcohol suggesting sympathetic activation and/or parasympathetic withdrawal [48]. Malapas et al. [49] have demonstrated vagal neuropathy in men with chronic alcohol dependence using 24 h HRV analysis.
1.3 Physiological Basis of HRV Analysis
Several physiological rhythms modulate heart rate via the autonomic nervous system. Instantaneous heart rate represents the total summation of all the effects on the autonomic nervous system. In the normal healthy subject there are several reflexes that operate in a simultaneous manner. These reflexes contain rhythms that are transmitted to the cardioregulatory systems in the brain and are effected in heart rate. The correspondence between these rhythms and branches of autonomic nervous system allows HRV analysis to provide information on the function of the different sections of the autonomic nervous system.
Respiration:
Respiratory sinus arrhythmia (RSA) refers to the clinical variation in heart rate associated with breathing. Breathing causes disturbances in blood pressure, which are sensed by the baroreceptors. The baroreflex arc processes the changes in blood pressure and causes a corresponding fluctuation in heart rate [8]. Because respiration is roughly periodic with a relatively short period (about 3 s), the fluctuations are mediated solely by the parasympathetic nervous system. As a result, parasympathetic control is able to operate on a rapid time scale, whereas the sympathetic systems cannot. Some researchers believe that the magnitude of sinus arrhythmia provides an index of the level of cardiac vagal activity [50, 51]. RSA also relies on the baroreceptor reflex to operate and therefore assess the functioning of the baroreceptor reflexes. Whether RSA indicates the entire level of parasympathetic activity or only the modulatory portion thereof is a matter that is under some debate [52].
Vasomotor Oscillations:
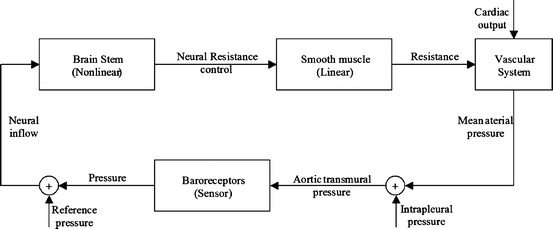
Vasomotor oscillations are a low-frequency spontaneous oscillation in blood pressure with a period of roughly 10 s. Constricting of the cross-sectional area of the arteries via smooth muscle activation regulates blood flow to different regions of the body. This process is controlled in a nonlinear manner by the brain stem and the baroreceptors. Due to delays in the processing system and the properties of smooth muscle activation, a spontaneous oscillation of roughly 10 Hz appears in blood pressure. This oscillation is detected by the baroreceptors and is superimposed onto the heart rate by the baroreceptor reflex arc [8]. Figure 1.3 shows the process diagrammatically. Vasomotor oscillations are mediated by the sympathetic nervous system [12, 53, 54]. There is debate about whether they are also mediated by the parasympathetic system [52, 55] and at this stage the results are inconclusive. This is a gap in the knowledge of how the sympathetic nervous system affects heart rate and requires further research.
Sympathetic-Vagal Interactions:
There is usually a balance between both divisions of the autonomic nervous system with heart rate reflecting the net effect of the two opposing arms of the system. At rest the vagal system is dominant; however with increasing levels of activity the activity of the vagus decreases and the sympathetic increases. However, although heart rate reflects the combined activity of both arms of the autonomic nervous system, it cannot be used to gauge the individual effect of the vagal or sympathetic system. It has been shown that the activity of the vagus nerve is accentuated when heart rate has been accelerated by sympathetic stimulation [56].
Heart Rate Control:
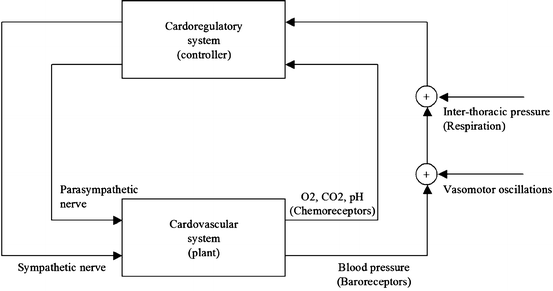
Short-term heart rate control can be considered as a control system where the physiological system is broken down into the following components:
Cardiovascular system: the plant
Cardioregulatory system: the controller
Autonomic nervous system: control inputs/outputs
Vasomotor and respiration: disturbances

Fig. 1.3
The process which generates vasomotor oscillations
Figure 1.4 shows these components as a feedback control system. The disturbances in blood pressure are transmitted via the autonomic nervous system to the controller, which causes sympathetic and parasympathetic activity to fluctuate in rhythm. The fluctuations in blood pressure are therefore seen in heart rate also.


Fig. 1.4
The cardiovascular control system as a feedback control system
1.4 Analysis Methods
The HRV indices can be divided into three major categories: time domain, frequency domain and nonlinear. The time-domain indices were developed quite early in the field and are still very popular. The frequency-domain indices were developed later and allow the variability to be divided into separate rhythms based on frequency. The nonlinear methods are based on the premise that HRV is a chaotic time series. They are the latest development and a very active field at present. To emphasize that edited RR intervals are being analysed, often the RR intervals are quoted as NN intervals. The NN intervals are the normal-to-normal intervals that result from editing ectopic beats and noise from the RR intervals. Either short-term or long-term recordings are analysed.
1.4.1 Time Domain
The time-domain indices of HRV measure the statistical properties of RR intervals, or the delta RR intervals. The delta RR intervals are the series of differences between successive RR intervals. The most common class of time-domain indices are based on statistical measurements of the intervals. Various “geometric” methods also exist, in which various measurements are made of the geometry of patterns made by the intervals. First we describe the most popular statistical techniques.
1.4.1.1 Statistical Techniques
The statistical techniques are based on various moments of the RR intervals and the delta RR intervals:
SDRR


The standard deviation of the RR intervals. This is a measure of total variability of the RR intervals. Low values indicate practically no HRV and this property alone has made it possibly the most used index in the literature [57–68]. SDRR increases as the length of time the measurement is taken over increases. It is able to be used for both long-term and short-term recordings, although it is not advised for use on short-term recordings due to dubious reproducibility [55]. Normal subjects have a value of 141 + / − 39 ms (mean + / − standard deviation) for long-term recordings [55].
Stay updated, free articles. Join our Telegram channel

Full access? Get Clinical Tree


