The purpose of this study was to evaluate long-term changes of transplant coronary arteries, including vessel, plaque, and lumen areas. There are limited long-term data on vessel remodeling after heart transplantation. We analyzed serial intravascular ultrasound images of the left anterior descending coronary artery (LAD) in 54 heart transplantation recipients. Nine patients (16.7%) had a history of rejection. Proximal left anterior descending artery segments were matched among time points, a ≥20-mm long segment was analyzed every 1 mm, and results were normalized for analysis length and reported as mm 3 /mm. During follow-up, vessel area decreased (−0.48 ± 1.3 mm 3 /mm/year), and plaque area did not change (−0.01 ± 0.47 mm 3 /mm/year). As a result, lumen area decreased (−0.52 ± 1.34 mm 3 /mm/year). The change in mean lumen area was well correlated to the change in mean vessel area ( r = 0.94, p <0.01) but not to the change in mean plaque area ( r = −0.27, p = 0.05). In conclusion, lumen loss occurred during long-term follow-up of patients who underwent heart transplantation, primarily secondary to negative remodeling (decrease in vessel dimensions).
Coronary artery vasculopathy (CAV) is one of the main reasons for mortality in patients who underwent heart transplant; mechanisms of late lumen loss in these patients may include diffuse plaque progression and vessel remodeling. Although previous studies have showed vessel-negative remodeling, there was no consistency among them. Although heart transplant patients typically undergo surveillance angiography, coronary angiography is limited in its ability to assess and differentiate plaque progression (or intimal thickening) from vessel remodeling in the setting of coronary artery vasculopathy, just as it is limited in patients with native coronary atherosclerosis. Furthermore, there are limited long-term data regarding remodeling in these patients. Therefore, the purpose of this study was to use serial intravascular ultrasound (IVUS) studies to evaluate long-term changes of transplant coronary arteries, including vessel, plaque, and lumen areas.
Methods
This study included 54 heart transplant recipients. These patients underwent cardiac transplantation at Onassis Cardiac Surgery Center (Athens, Greece) from January 1996 to August 2010 and were followed by angiography and IVUS. The hospital protocol was for IVUS to be performed 1 month after transplantation and then annually until 5 years after transplantation. If IVUS showed pathologic changes, the immunosuppressant therapy was changed to everolimus; and IVUS was performed after 6 months and 1 year of everolimus. However, the ultimate decision to perform or not perform IVUS was that of the attending physician and was based, in part, on the condition of the individual patient(s). Only lesions not treated by percutaneous coronary intervention were assessed.
Quantitative coronary angiography (QCA) was performed using Medis CMS software version 7.0 (Leiden, The Netherlands). Reference diameter, minimum lumen diameter, and percent diameter stenosis within the proximal LAD (<20 mm) were analyzed.
IVUS was performed to the left anterior descending artery (LAD). Galaxy or iLab (with Atlantis SR Pro, 40-MHz catheters; Boston Scientific, Marlborough, Massachusetts) or S5 (with Revolution 45-MHz catheters; Volcano, San Diego, California) IVUS systems were used. IVUS was performed using motorized transducer pullback at 0.5 mm/s from the distal LAD to the aorto-ostial junction. Images were sent to an IVUS core laboratory (Cardiovascular Research Foundation, New York, New York) for offline analysis.
Analysis was performed using validated planimetry software (echoPlaque; INDEC Systems, Santa Clara, California). IVUS images were carefully analyzed by 2 experienced, independent observers (KG and AM). Proximal LAD segments were matched; ≥20-mm-long LAD segments distal to the carina of the left main bifurcation were analyzed every 1 mm. Quantitative grayscale IVUS measurements included the cross-sectional areas (CSA) of the external elastic membrane (EEM), lumen, and plaque and media (EEM minus lumen). Results were normalized for analysis length and reported as mm 3 /mm. Only patients in whom the same IVUS system (Boston Scientific or Volcano) was used at baseline and follow-up were included in this analysis. If more than 2 IVUS studies were performed, then the primary quantitative analysis compared the first versus the last IVUS studies. Positive remodeling was defined as an increase in EEM area; negative remodeling was defined as a decrease of EEM area.
Statistical analyses were performed using SPSS version 22 (IBM, Armonk, New York). Continuous variables were presented using means and standard deviations. Categorical variables were expressed as percentages. Analysis of variance was used for comparison of 3 groups. Post hoc analyses were done using Bonferroni corrections. The correlation between changes in lumen CSA versus changes in EEM or plaque and media CSA were analyzed using Pearson correlation coefficient. A p value of <0.05 was considered statistically significant.
Results
Of the 54 patients in this study, 9 had a history of rejection, occurring before the first IVUS study. Patient characteristics have been summarized in Table 1 .
| Variable | n=54 |
|---|---|
| Age at the time of cardiac transplantation (years) | 37±14 |
| Men | 43 (80%) |
| Indication of heart transplantation | |
| Ischemia | 9 (17%) |
| Cardiomyopathy | 45 (83%) |
| Diabetes mellitus | 13 (24%) |
| Hypertension ∗ | 15 (28%) |
| Hyperlipidemia † | 5 (9%) |
| Current smoker | 12 (22%) |
| Prior myocardial infarction | 7 (13%) |
| Left ventricular ejection fraction <35% | 3 (6%) |
| Medication (at last intravascular ultrasound) | |
| Aspirin | 54 (100%) |
| Clopidogrel | 3 (6%) |
| ACEI or ARB | 31 (57%) |
| Calcium channel blocker | 7 (13%) |
| Cyclosporine A | 42 (78%) |
| Mycophenolate mofetil | 30 (56%) |
| Everolimus | 14 (26%) |
| Tacrolimus | 22 (41%) |
| Duration between heart transplantation and first intravascular ultrasound (years) | 3.6±3.2 |
| Duration between first and last IVUS (years) | 2.4±1.1 |
∗ Systolic blood pressure ≥140 mm Hg and/or diastolic blood pressure ≥90 mm Hg.
† Total cholesterol ≥200 mg/dL (≥180 mg/dL for patients with diabetes), LDL cholesterol ≥100 mg/dL (≥70 mg/dL for patients with diabetes), HDL cholesterol ≤40 mg/dL for men and ≤50 mg/dL for women, or triglycerides ≥150 mg/dL.
Twenty-one cases had 2 IVUS studies, 25 cases had 3 IVUS studies, 6 cases had 4 IVUS studies, and 2 cases had 5 IVUS studies. Of 33 patients with 3 or more IVUS studies, only positive remodeling occurred in 5 cases, only negative remodeling occurred in 11 cases, and a combination of positive and negative remodeling occurred 17 cases. Of 17 patients with a mixture of positive and negative remodeling, positive then negative remodeling occurred in 11 cases, negative then positive remodeling occurred in 4 cases, and 2 cases (with more than 3 IVUS studies) showed a variable pattern of positive and negative remodeling.
Figure 1 shows the individual changes of EEM, lumen, and plaque and media areas of each case. Representative IVUS images of positive remodeling and negative remodeling are shown in Figure 2 .
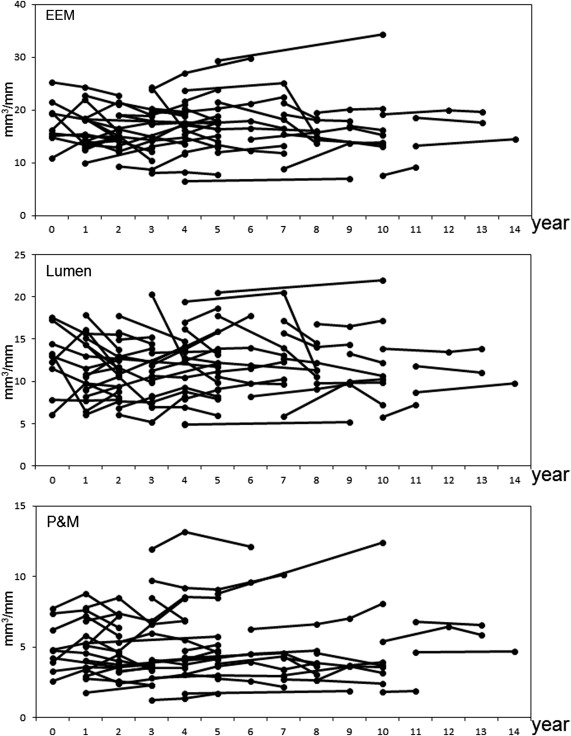
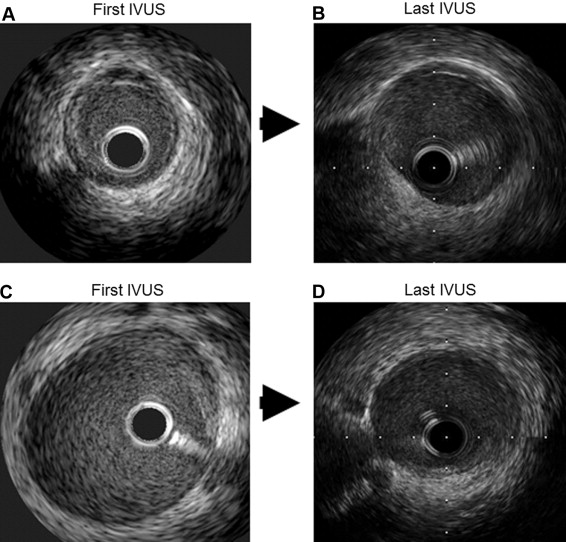
Table 2 summarizes the QCA and quantitative IVUS findings. There were no significant differences in reference diameter, minimum lumen diameter, and percent diameter stenosis in negative remodeling, no change, and positive remodeling groups. Vessel area and lumen area at the time of the first IVUS were larger in the negative remodeling group versus the positive remodeling group. However, there was no significant difference at the time of the last IVUS among 3 groups.
| Variable | All (n=54) | Negative Remodeling (n=21) | No Change (n=20) | Positive Remodeling (n=13) | p Value |
|---|---|---|---|---|---|
| First quantitative coronary angiography | |||||
| Reference diameter (mm) | 3.7±0.7 | 3.9±0.8 | 3.7±0.7 | 3.5±0.5 | 0.34 |
| Minimum lumen diameter (mm) | 3.2±0.7 | 3.3±0.8 | 3.2±0.7 | 2.9±0.5 | 0.35 |
| Diameter stenosis (%) | 14.3±6.6 | 13.9±6.3 | 14.2±6.7 | 15.1±7.5 | 0.90 |
| Last quantitative coronary angiography | |||||
| Reference diameter (mm) | 3.7±0.6 | 3.8±0.4 | 3.4±0.6 | 3.8±0.7 | 0.03 |
| Minimum lumen diameter (mm) | 3.1±0.6 | 3.3±0.5 | 2.9±0.6 | 3.1±0.7 | 0.11 |
| Diameter stenosis (%) | 15.6±8.9 | 14.6±5.3 | 15.2±8.0 | 17.5±13.8 | 0.66 |
| Change between first and last quantitative coronary angiography | |||||
| Reference diameter (mm) | -0.05±0.40 | -0.01±0.33 | -0.20±0.47 | 0.14±0.26 | 0.07 |
| Minimum lumen diameter (mm) | -0.08±0.35 | -0.06±0.29 | -0.18±0.43 | 0.05±0.23 | 0.20 |
| Diameter stenosis (%) | 0.83±3.94 | 1.30±4.16 | 0.13±2.78 | 1.24±5.29 | 0.64 |
| First intravascular ultrasound | |||||
| EEM CSA (mm 3 /mm) | 17.2±5.0 | 19.4±3.9 | 16.2±4.0 | 15.4±6.8 | 0.04 |
| Lumen CSA (mm 3 /mm) ∗ | 12.7±4.2 | 15.1±3.6 | 11.5±3.5 | 10.5±4.6 | <0.01 |
| Plaque and media CSA (mm 3 /mm) | 4.8±2.2 | 4.4±1.4 | 4.9±2.1 | 5.1±3.3 | 0.65 |
| Last intravascular ultrasound | |||||
| EEM CSA (mm 3 /mm) | 16.4±4.8 | 15.8±3.1 | 16.0±4.0 | 18.1±7.3 | 0.34 |
| Lumen CSA (mm 3 /mm) | 11.7±3.4 | 11.6±2.4 | 11.1±3.5 | 12.7±4.6 | 0.40 |
| Plaque and media CSA (mm 3 /mm) | 4.8±2.4 | 4.2±1.5 | 5.0±2.2 | 5.4±3.5 | 0.35 |
| Change between first and last IVUS | |||||
| EEM CSA (mm 3 /mm/year) † | -0.48±1.3 | -1.75±1.00 | -0.12±0.28 | 1.04±0.38 | <0.01 |
| Lumen CSA (mm 3 /mm/year) ‡ | -0.52±1.34 | -1.77±1.10 | -0.13±0.58 | 0.91±0.45 | <0.01 |
| Plaque and media CSA (mm 3 /mm/year) | -0.01±0.47 | -0.03±0.54 | -0.05±0.53 | 0.07±0.24 | 0.78 |
Stay updated, free articles. Join our Telegram channel

Full access? Get Clinical Tree


