Technology
Advantages
Limitations
Conventional angiography
Precise definition of graft patency, gold standard
Invasive, requires contrast agent, hybrid operating room, and catheter skills
Transit-time flowmetry
Precise graft flow value
Nonvisual, inability to define degree of stenosis
Thermal angiography
No contrast agent or radiation
Needs temperature differential to image, no clarity with increasing depth
Intraoperative fluorescence imaging
Real-time angiographic images
Only semiquantitative, limited experience
18.2 Transit-Time Flow Measurement
18.2.1 Principle
Transit-time flow measurement is based on the transit-time principle. It uses a flow probe, which is placed around the vessel and creates a uniform ultrasound field across the vessel. Two separate piezoelectric crystals, which are located on the same side of the probe, send ultrasound pulses. A reflector is located on the opposite side of the probe and at the same distance from the two crystals. Ultrasound pulses transmit the vessel and are reflected back to the crystals. The duration spent by the ultrasound pulse to travel from one crystal across the vessel and then to be reflected (by the reflector on the opposite side of the probe) and reach the other crystal is called transit time. Ultrasound waves that travel upstream of the flow will travel slower than those going downstream. The difference in transit time between the pulse going upstream and the one going downstream is used to provide a precise measure of the volume of flow passing through the probe.
18.2.2 Practice
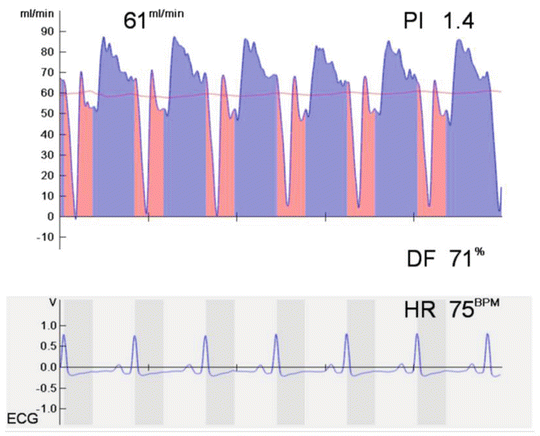
As shown in Fig. 18.1, TTFM provides a synchronous flow waveform and various calculated derivatives including mean graft flow, flow curve pattern, and pulsatility index.


Fig. 18.1
Transit-time flowmetry display (Medistim ASA, Oslo, Norway) showing the flow waveform in a right internal thoracic artery grafting to the left anterior descending artery with a mean graft flow of 61 mL/min, pulsatility index (PI) of 1.4, and diastolic flow (DF) of 71 %. Simultaneous electrocardiogram (ECG) is displayed on the auxiliary option
Mean graft flow is expressed as mL/min: this value depends on many factors such as mean arterial pressure, graft-coronary resistance, and run-off in the distal microvasculature. The vascular resistance is calculated in the following formula: R = 8Lr4, where myu refers to blood viscosity, L to graft length, and r to the radius of the graft. The mean flow value per se should not be considered as a good indicator of the quality of the anastomosis because it often alters even if the anastomotic quality is excellent. Therefore, it’s always interpreted with taking the other parameters into consideration [20].
The flow curve is the visual representative of the hemodynamic function of the graft. It provides the percentage of the systolic and diastolic flow and the total areas under the curve for the systolic and diastolic flow. The curves should always be linked with the electrocardioghic tracing in order to correctly differentiate the systole from the diastole.
Diastolic filling percentage (DF %) indicates the percentage of coronary filling in diastole (the blood volume filling in diastole divided by the total blood volume in one heart cycle). The flow curve patterns can be classified according to dominancy, systolic dominant when peak systolic flow exceeds peak diastolic flow by 10 % and diastolic dominant or balanced when peak diastolic flow exceeds peak systolic flow by 10 % [21]. Different flow patterns may be related to the target vessel and grafts. The proportion of measured diastolic flow may increase as the flow probe is placed distally on the graft. The flow dominancy in diastolic phase is more marked in the left coronary system because of a comparatively greater systolic flow component in grafts to the right coronary system because of a lower right ventricular transmyocardial pressure gradient.
The percentage of backward flow (%BF) is another parameter provided by the flow curve. It is the percentage of flow that is directed backward within the graft compared with the total forward flow of the same cardiac cycle. The lower the rate of backward flow, the better the quality of the grafting.
The pulsatility index (PI) is an estimate of the vascular resistance and expressed as an absolute number summarized in the following formula: Qmax – Qmin/Qmean, where the mean flow is calculated across five cardiac cycles (Qmean), maximum flow is recorded in one cardiac cycle (Qmax), and minimum flow is recorded through one cardiac cycle (Qmin). The pulsatility index can be affected by several factors that increase the resistance to blood flow, including graft stenosis or occlusion, distal native coronary artery stenosis, and poor run-off in the distal microvasculature. Generally a pulsatility index value of more than 5 is considered to indicate unsatisfactory graft flow.
18.2.3 Current Experience and Results
A recent meta-analysis summarizes the clinical outcome of TTFM [22]. A total of 1411 grafts in 509 patients were assessed; 3.2 % of the grafts in 8.8 % of the patients were revised based on the TTFM findings. Many authors have tried to define threshold values for the different TTFM findings and to distinguish patent from occluded grafts. A mean flow of 15 mL/min or less, a PI of 5 or higher, and a BF of 4 or higher seem to be the optimal cutoff criteria to predict early graft failure [23–25]. A systolic dominant flow curve pattern is a risk factor in grafts to the left coronary artery [25].
18.2.4 Limitations
Although transit-time flowmetry reliably validates graft patency in the majority of grafts with good flow, in some cases interpretation of the TTFM parameters is difficult and substantial uncertainty about graft patency may remain. Hirotani and colleagues [26] compared intraoperative TTFM results in 291 internal thoracic artery grafts and 190 saphenous vein grafts in 171 patients with postoperative coronary angiography performed before hospital discharge. They reported that although the graft flow was significantly correlated with the grafted perfusion areas and the diameter of the bypassed coronary arteries, no significant difference was observed between the flows of the ITA grafts with and without stenosis or string sign. Hol and colleagues [27] investigated TTFM measurements and angiography in 124 grafts in 72 patients, reported that TTFM did not detect significant angiographic abnormalities in arterial and venous grafts including an occluded internal mammary artery graft, and concluded that TTFM alone may underestimate graft failure.
18.3 Intraoperative Fluorescence Imaging
18.3.1 Principle
Intraoperative fluorescence imaging is a novel vascular imaging technique based on the fluorescent properties of indocyanine green (ICG) dye. After intravenous injection, ICG quickly binds to plasma proteins, and, when illuminated with a monochromatic light source at 806 nm (near infrared), it emits light with a wavelength of 830 nm. This fluorescence is then captured and analyzed with a charge-coupled device video camera. The total output of the laser is 2.7 W, and the camera is placed 30 cm above the heart and analyzes an area of 7.5 cm × 7.5 cm. The laser light depth of tissue penetration is about 1 mm and has been demonstrated not to cause myocardial thermal damage. This laser light source has been shown to be safe. No protective eyewear is necessary, and ICG has been demonstrated safe over a 40-year period. The incidence of allergic reaction to ICG is strongly dose dependent, being greatest with doses in excess of 0.5 mg/kg, and is reported to be approximately 1:40000, especially in patients allergic to iodine [28].
18.3.2 Practice
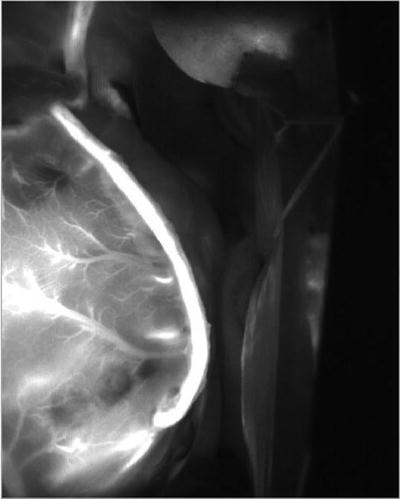
The camera is covered with a sterile polyethylene drape and positioned 30 cm above the heart. ICG is made up of a concentration of 2.5 mg/mL. At the completion of the distal anastomoses, a bolus of 1 mL of ICG dye can be injected wither in the ascending aorta [29] or in the central venous pressure catheter (if the operation is performed off pump) or directly into the oxygenator in on-pump surgery. The dye is rapidly flushed with 10 mL of normal saline. Immediately after intravenous dye injection (or after a 5-s delay if the dye is injected into the oxygenator), the laser power is activated and captured images are recorded on the computer hard drive. The appearance of fluorescent ICG dye passing antegradely inside the bypass grafts and perfusing the coronary artery tree confirms graft patency (Fig. 18.2). This procedure takes approximately 3 min per graft. The visualization of dye fluorescence is better with skeletonized conduits compared with pedicled conduits. ICG injections can be administered repeatedly.


Fig. 18.2
Left internal thoracic artery graft to the left circumflex artery demonstrated by intraoperative fluorescence imaging (SPY, Novadaq, Toronto, Canada)
18.3.3 Current Experience and Results
The first experience with intraoperative fluorescence imaging in coronary artery surgery was reported by Rubens [30] in 2002. As listed in Table 18.2, several investigators have reported their experience with this technology [19, 31–37]. The assessment of 2,197 bypass grafts in 783 patients demonstrated an overall graft revision rate of 2.0 % in 6.2 % of patients. The sensitivity and specificity of IFI to detect graft occlusion or stenosis greater than 50 % was 83–100 % and 100 %, respectively.
Table 18.2
Studies with IFI
Revised grafts | ||||||||
|---|---|---|---|---|---|---|---|---|
Year | First author | No. patients | No. grafts | No | % of grafts | % of patients | Sensitivity | Specificity |
2002 | Rubens [23] | 20 | 1 | N/A | N/A | N/A | N/A | |
2003 | Reuthebuch [24] | 38 | 107 | 4 | 3.7 | 10.5 | N/A | N/A |
2003 | Taggart [11] | 84 | 213 | 4 | 1.9 | 5 | N/A | N/A |
2004 | Balacumaraswami [25] | 200 | 533 | 8 | 1.5 | 4 | N/A | N/A |
2004 | Takahashi [26] | 72 | 290 | 4 | 1.4 | 5.6 | N/A | N/A |
2005 | Desai [27] | 120 | 348 | 5 | 1.4 | 4.2 | 83.3 | 100 |
2009 | Handa [28] | 39 | 116 | 2 | 1.7 | 5.1 | 100 | 100 |
2010 | Handa [29] | 51 | 153 | 4 | 2.6 | 7.8 | 85.7 | 100 |
2012 | Kuroyanagi [30] | 159 | 437 | 12 | 2.1 | 7.5 | N/A | N/A |
783 | 2197 | 44 | 2 | 6.2 | ||||
18.3.4 Strength
The great advantage of IFI assessment is that it makes blood flow through a grafted vessel visible, and where there is no enhancement in the graft, revision of the graft is obviously required. Furthermore, it does a more physiologic assessment of graft flow than conventional angiography because there is no selective pressure injection into a graft that changes the baseline physiologic state.
18.3.5 Limitations
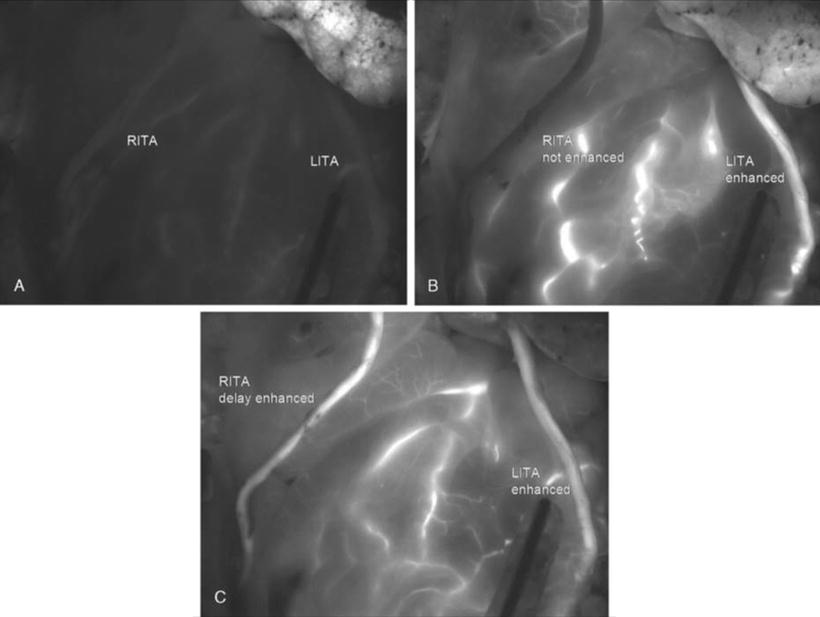
Fluorescence imaging does not produce precise measurements of flow in patent grafts, but gives a semiquantitative and monoplane assessment of graft patency. There are no clear intermediate criteria between “enhanced” and “not enhanced” by which to assess graft quality, and it may be difficult to decide whether to revise in cases where IFI indicates positive but slow enhancement of the graft vessel (Fig. 18.3). In IFI, the enhancement effect develops from ICG injected through the venous line, through the superior vena cava and right side of the heart, and the pulmonary vasculature, emerging from the left side of the heart. The time until enhancement of graft or other vessels is thus influenced by various factors such as arterial anatomic path length and blood flow velocity (involving cardiac output, systemic vascular resistance, and any limitation of blood flow velocity in a graft vessel as dictated by flow rate through anastomoses). Thus, for example, the enhancement effect normally arrives later in the GEA than in the ITA because of greater distance from the heart, but when enhancement begins, it should move along each graft vessel at a speed dictated by the blood flow velocity through the anastomoses. For the same reason, intraoperative fluorescence imaging arrival times can be important. In view of path length differences, it might seem inappropriate to use the delay until manifestation of fluorescent enhancement to assess graft quality. However, in a situation where both RITA and LITA are used together, the delay to start of enhancement is very important. They represent similar path lengths from the heart, and if blood flows through both at similar rates, then the time to start of enhancement should also be similar. In practice, delayed enhancement can be very useful for finding problematic grafts.


Fig. 18.3
Bilateral ITAs were enhanced, but there was a little time lag between the RITA and the LITA. The LITA graft to the left circumflex coronary artery showed slower blood flow than the RITA. (a–c): Progress is shown in chronological order: (a, b, and c)
Because this system requires direct “line-of-sight” imaging, the heart needs to be distracted from its native position to visualize the grafts and anastomoses. Therefore, grafts are not evaluated in their native state when graft kinking could theoretically be present and absent when the heart is in the distracted position to allow access to the camera. This is particularly problematic for circumflex grafts.
Since tissue penetration is limited and image is acquired from directly above the anastomoses, precise assessment of anastomotic quality cannot be provided. This is particularly problematic when the anastomosis is located subepicardially or ITA or GEA grafts are not completely skeletonized.
Fluorescence imaging may not allow complete visualization of the whole length of a graft, and, whenever an abnormality (a compression, twist, or bend) occurs in the graft at a point far away from the laser light, the finding may be erroneously interpreted as a graft failure.
In conditions in which the native flow creates competition, the reason for poor graft flow may not be immediately evident and fluorescence imaging may lead to erroneous interpretation of the graft status. If competitive flow is suspected to be the cause, snaring of the native coronary artery proximal to the anastomosis may elucidate suspicious findings.
18.3.6 Prospective Comparison of IFI and TTFM
In a prospective comparison of IFI and TTFM, Balacumaraswami [38] compared the simultaneous use of IFI and TTFM to evaluate graft patency and found that although in the majority of the patients both techniques are useful to confirm graft patency (91 % of the grafts), in 3.8 % of grafts (10 % of patients) TTFM showed persistently poor flow when IFI demonstrated satisfactory flow. They concluded that the use of TTFM alone may prompt unnecessary graft revision. Desai studied 46 patients receiving 139 grafts; the sensitivity and specificity for detecting graft failure (defined as occlusion or stenosis greater that 50 % at postoperative standard angiography) was 83.3 % and 100 % for IFI and 25 % and 95 % for TTFM, respectively [39]. The difference in sensitivity between IFI and TTFM in detecting graft failure was significant (p = 0.023), and the authors concluded that IFI provided better diagnostic accuracy for detection of graft failure. Kuroyanagi investigated outcomes in 159 patients receiving off-pump CABG with 435 grafts and commented that delayed enhancement of one ITA in comparison with the other suggested either native competitive flow or a bypass graft problem [37].
Stay updated, free articles. Join our Telegram channel

Full access? Get Clinical Tree


