57 Intracoronary Pressure and Flow Measurement
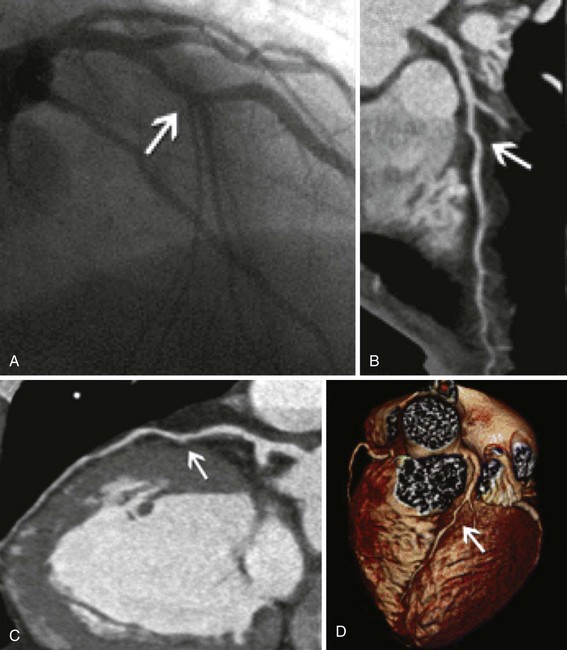
It is of historical interest that Andreas Grüntzig understood this problem from the very first percutaneous transluminal coronary angioplasty (PTCA) performed in 1977. Because of the poor quality of angiography, he developed and used a 4 French (F) balloon dilation catheter with a double lumen, one for balloon inflation and one for distal lesion pressure recordings. The procedure was guided by a reduction in the trans-stenotic pressure gradient. With improvements in angiography and PCI equipment, especially drug-eluting stents (DESs) over the last three decades, many interventional cardiologists believe that angiographic information alone is sufficient for decision making regarding patient care and that lesion assessment by pressure and flow recordings can be reserved for research purposes. This erroneous “conventional wisdom” is no longer supported by substantial multi-center long-term clinical outcome studies of the benefits of physiologic lesion assessment. The rationale for physiologic lesion assessment is simple. The angiogram cannot be relied on exclusively to direct coronary revascularization.1 Angiography cannot fully characterize the clinical or hemodynamic significance of many coronary stenoses. This fact is well recognized and documented repeatedly by intravascular ultrasound (IVUS) imaging, computed tomographic angiography (CTA), and the ubiquitous necessity for stress testing to clarify lesions seen on coronary angiography. Moreover, even sophisticated imaging modalities such as densitometry, rotational angiography, and CTA with three-dimensional reconstruction do not reliably reflect the physiologic significance of a given lesion (Fig. 57-1).2
 Fundamental Concepts of Coronary Blood Flow
Coronary blood flow can increase from a resting level to a maximum, depending on increases in myocardial oxygen demand or in response to neurogenic or pharmacologic hyperemic stimuli. Normally, large epicardial vessel resistance to blood flow is trivial. Most of the regulation of coronary flow is by the myocardial precapillary arteriolar resistance vessels. In a normal adult artery supplying normal myocardium, coronary blood flow can increase more than threefold. However, several conditions, including left ventricular hypertrophy, myocardial ischemia, and diabetes, can affect the microcirculation, blunting the maximal absolute increase in coronary flow or increasing resting flow above the expected level for myocardial oxygen demand at rest. The regulation of coronary vasomotor tone and the influence of several mechanisms such as α-adrenoreceptor–mediated vasoconstriction have been extensively reviewed elsewhere and are beyond the scope of this chapter.3 A significant atherosclerotic stenosis produces epicardial conduit resistance. In response to the loss of perfusion pressure and flow to the distal (poststenotic) vascular bed, the small resistance vessels dilate to maintain satisfactory basal flow appropriate for myocardial oxygen demand. Viscous friction, flow separation forces, and flow turbulence at the site of the stenosis produce energy loss at the stenosis (Fig. 57-2). Energy (heat) is extracted, reducing pressure distal to the stenosis, thereby producing a pressure gradient between the proximal and distal artery regions. The pressure loss or gradient increases with increasing coronary flow.4 There exists an absolute poststenotic myocardial perfusion pressure threshold, below which myocardial ischemia may be easily induced.
Coronary Flow and Flow Reserve
As the severity of stenosis increases, maximal coronary flow becomes attenuated, and coronary flow reserve (CFR) decreases. CFR is a combined measure of the capacity of the major resistance components (the epicardial coronary artery and the supplied vascular bed) to achieve maximal blood flow in response to hyperemic stimulation. A normal CFR implies that both epicardial and microvascular bed resistances are low (normal) (Fig. 57-3). However, if they are abnormal, CFR does not indicate which component is affected, a fact that limits the clinical applicability of this measurement. Although early studies in animals and humans indicated an absolute normal value for CFR of 3.5 to 5, the CFR in adult patients with chest pain syndromes and CAD risk factors undergoing cardiac catheterization with angiographically normal vessels was 2.7 ± 0.6, suggesting a degree of patient variability and microvascular disease. In patients with essential hypertension and normal coronary arteries and in those with aortic stenosis and normal coronary arteries, CFR may be reduced, in part related to myocardial hypertrophy and an abnormal microvasculature. Furthermore, CFR can be altered by changes in basal and hyperemic flows, which are influenced by hemodynamics, loading conditions, and contractility. For example, tachycardia increases basal flow and decreases hyperemic flow, thus reducing CFR by 10% for each 15-beat increase in heart rate. In clinical terms, CFR is best used to assess the microcirculation in the absence of epicardial artery narrowings. CFR should not be used to assess stenosis significance because of the influence of hemodynamics and the unknown impact of the microcirculation.
Intracoronary Pressure Measurements and Fractional Flow Reserve
As the limitations of invasive CFR were recognized, the development of pressure sensor guidewires yielded a new concept of lesion assessment. Pressure measurements, which were made across a lesion during maximal hyperemia, termed the myocardial fractional flow reserve (FFRmyo), were introduced.5 When blood flows from the proximal to the distal part of the normal epicardial coronary artery, virtually no energy is lost; therefore, the pressure remains constant throughout the conduit. In the case of epicardial coronary narrowing, potential energy is transformed into kinetic energy and heat when blood traverses the lesion. The energy loss results in a pressure drop, which reflects the total loss of energy. To maintain resting myocardial perfusion at a constant level, a decrease in myocardial resistance compensates for any resistance of flow caused by the epicardial narrowing. The decrease in myocardial resistance reserve is proportional to the resistance that can be computed from the pressure gradient–flow relation; therefore, the pressure at constant maximal flow can represent an index of the physiologic consequences of a given coronary narrowing on the myocardium. The maximal myocardial blood flow in the presence of a stenosis is reduced relative to expected normal flow in the absence of a stenosis and can be expressed as a fraction of its normal expected value if there were no lesion. This value can be derived from pressure data alone for the myocardium (FFRmyo), the epicardial coronary artery (FFRcor), and the collateral supply (FFRcoll), based on several assumptions regarding trans-lesional pressure measured during maximal hyperemia.5,6 The proposed equations have been derived from a theoretical model of the coronary circulation and have been validated experimentally in instrumented dogs, and later in humans, by comparison with myocardial flow measured by positron emission tomography (PET).7 During maximal hyperemia (pharmacologic challenge with papaverine or adenosine), coronary resistance is at the lowest level and remains constant, so that flow is directly related to the measured pressure gradient. The total myocardial blood flow (Qn) in an area served by a coronary artery with a stenosis is the sum of the flow through the stenosis (QS) and the collateral flow (QC). FFRmyo is defined as the ratio of the measured flow (Qs) to the maximal flow that should be present without any stenosis (QN):
In practice, Pv is considered negligible relative to Pa, and hence:
FFRcoll and FFRcor are calculated with similar equations:
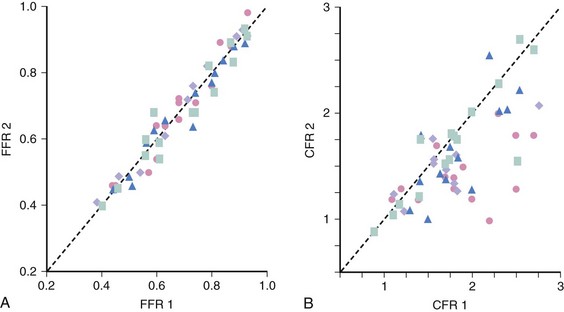
Unlike most other physiologic indexes, FFR has a normal value of 1.0 for every patient and every coronary artery. FFR has high reproducibility and low intra-individual variability (Fig. 57-4). Moreover, FFR, unlike CFR, is independent of gender or CAD risk factors such as hypertension and diabetes and has less variability with common doses of adenosine. De Bruyne and associates demonstrated that in humans, FFRmyo is independent of hemodynamic conditions. Changes in heart rate affected by pacing, in contractility by dobutamine infusion, and in blood pressure by nitroprusside infusion did not alter FFRmyo.8 The coefficient of variation between two consecutive measurements was 4.2%, lower than the 17.7% for CFR measured with a Doppler wire.
 Methodology of Coronary Pressure Measurement
General Setup and Guidewire Manipulation
The measurement of coronary pressure is similar to performing an angioplasty in that a sensor guidewire is passed through an angioplasty Y-connector attached to a guiding catheter, with anticoagulation (intravenous [IV] heparin) given beforehand. To minimize measurement variability caused by vessel spasm, intracoronary (IC) nitroglycerin (100 to 200 mcg) is given before the guidewire is advanced into the artery. For coronary pressure measurements, two pressure wire systems are available at this time: (1) the PressureWire (St. Jude Medical Inc., Minneapolis, MN) and (2) the PrimeWire (Volcano Therapeutics, Rancho Cardova, CA). Both can be used as angioplasty guidewires with mechanical properties close to standard “workhorse” guidewires. For both wires, a pressure sensor is located 3 cm from the tip, at the junction of the radiopaque and radiolucent portions of the wire, and the tip can be shaped to facilitate delivery to the distal vessel (Fig. 57-5). Before inserting the guidewire into the patient, the sensor-wire and guiding-catheter pressure signals are calibrated and set at zero. The sensor wire is then introduced and positioned at the tip of the guiding catheter, where the guiding catheter and wire pressures are equalized (assuming an accurate baseline before advancing down the artery). Next, the wire is advanced down the vessel and across the stenosis or to the most distal part of the coronary artery for assessment of serial lesions or diffuse disease. A pharmacologic hyperemic stimulus (e.g., adenosine, see below) is then administered through the guiding catheter or can be given by IV infusion. The mean and phasic pressure signals are continuously recorded, and at peak hyperemia (represented by the nadir, or lowest, distal pressure), the FFR is calculated as the ratio between the mean distal coronary pressure (measured by the pressure wire) and the mean aortic pressure (measured by the guiding catheter):
To study the distribution of abnormalities along a diseased coronary artery (with serial lesions or diffuse disease), the pressure wire can be pulled back slowly during intravenously induced hyperemia. Simultaneously, observing the location of the wire and the pressure tracings indicates the location of hemodynamically significant atherosclerotic abnormalities. On pulling back the pressure wire, one can observe gradual pressure recovery because of diffuse atherosclerosis compared with a focal stenosis that is associated with an abrupt increase in pressure proximal to the lesion. By moving the sensor back and forth, the exact location of a pressure drop representing a focal obstruction to flow can be determined. After pressures are measured, the interface coupler can be disconnected and the pressure wire can be used as a “workhorse” guidewire to advance balloons or to deliver a stent. FFR is often measured using 6F guiding catheters but diagnostic catheters as small as 4F have been used. At the end of the procedure, the wire is withdrawn, and the guidewire pressure is verified in comparison with the guiding catheter pressure, thus ensuring that no pressure signal drift has occurred. A more complete description of the application and pitfalls of coronary pressure measurements can be found elsewhere.9
Safety of Intracoronary Sensor Wire Measurements
Qian and coworkers examined the safety of IC Doppler wire measurements in 906 patients.10 Fifteen patients (1.7%) had severe transient bradycardia after administration of IC adenosine (14 in the right coronary artery [RCA] and 1 in the left coronary artery [LCA]). Nine patients (1%) had coronary spasm during passage of the Doppler guidewire (5 in the RCA and four in the left anterior descending [LAD] coronary artery). Two patients (0.2%) had ventricular fibrillation (VF) during the procedure. Hypotension with bradycardia and ventricular asystole occurred in one patient. Transplant recipients had more of these complications than did patients undergoing either diagnostic or interventional procedures. All complications were managed medically without long-term adverse consequences. These data support the safe clinical practice of sensor wire measurements with IC adenosine.
Radiation, Procedure Time, Contrast Use for Fractional Flow Reserve
Performing FFR may increase the amounts of radiation dose, procedural time, and contrast medium after a diagnostic coronary angiogram. Ntalianis et al measured the amounts of radiation dose (mSv), procedural time (min), and contrast medium (mL) in 200 patients (mean age 66 ± 10 years) undergoing diagnostic coronary angiography with FFR measured in at least one intermediate coronary artery stenosis.11 In all, 296 stenoses (1.5 ± 0.7 stenoses per patient) were assessed after hyperemia was achieved by IC (n = 180) or IV (n = 20) adenosine. The additional amounts of mean radiation dose, procedural time, and contrast medium needed to obtain FFR as a percentage of the entire procedure were 30 ± 16% (median 4 mSv, range 2.4–6.7 mSv), 26 ± 13% (median 9 minutes, range 7–13 min), and 31 ± 16% (median 50 mL, range 30–90 mL), respectively. The additional procedural time was slightly longer with IV adenosine compared with IC adenosine (median 11 minutes vs. 9 minutes, P = 0.04), but there was no difference between IV and IC adenosine for radiation or contrast dosages (Fig. 57-6). There was no difference between IV and IC adenosine when FFR in radiation dose, procedural time, or contrast medium was measured in three or more lesions. The minimal increases in the amounts of radiation dose, procedural time, and contrast medium were low compared with IVUS or angioscopy. The clinical value of FFR measurements is worth the small additional amounts of radiation and procedure time involved.
Pharmacologic Hyperemic Stimuli
Maximal coronary hyperemia is required for in-lab coronary physiologic lesion assessment (Table 57-1). The most widely used maximal vasodilator agents are adenosine, adenosine triphosphate (ATP), and papaverine. Hyperosmolar ionic and low-osmolar nonionic contrast media do not produce maximal vasodilation. Nitrates increase volumetric flow, but because these agents also dilate the epicardial conductance vessels, the increase in coronary flow velocity is less than with adenosine or papaverine. IC nitroprusside has similar hyperemic effects compared with IC adenosine. Papaverine is no longer used for IC hyperemic stimulation because of the occasional Q–T interval prolongation and associated ventricular tachycardia (VT) or VF.
Adenosine
Both IC adenosine and IV adenosine are the most commonly used hyperemic agents. Adenosine has a short half-life with a return to basal flow within 30 to 60 seconds after cessation of infusion. Adenosine is benign in appropriate dosages (20–30 mcg in the RCA or 40–60 mcg in the LCA, or infused IV at 140 mcg/kg/minute), although many have reported the use of much higher dosages with no adverse effects. Rarely, transient atrioventricular (AV) block and bradycardia may occur. IV administration tends to have a higher incidence of flushing, chest tightness, and AV block compared with IC dosing. Jeremias and colleagues examined differences in FFR between IC adenosine (15–20 mcg in the RCA or 18–24 mcg in the LCA) and IV adenosine (140 mcg/kg/minute) in 52 patients with 60 lesions.12 There was a strong and linear relationship between IC and IV adenosine (r = 0.978 and P < 0.001). The mean measurement difference for FFR was 0.004 ± 0.03. A small random scatter in both directions of FFR was noted in 8.3% of stenoses, where the IC adenosine FFR value was 0.05 greater than the IV adenosine FFR value, suggesting a suboptimal IC hyperemic response. Changes in heart rate and blood pressure were significantly greater with IV adenosine. Two patients with IV adenosine but none with IC adenosine had side effects such as bronchospasm and nausea. These data indicated that IC adenosine is equivalent to IV infusion for determination of FFR in most patients. However, in a small percentage of cases, coronary hyperemia was suspected to be suboptimal with IC adenosine, suggesting that a repeated, higher IC adenosine dose may be helpful. IV adenosine also has the advantages of simplicity and weight-adjusted dosing and is required for the evaluation of ostial lesions or for the assessment of diffuse disease during pullback recordings.
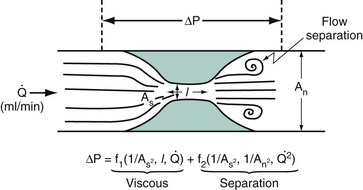
 , by the law of Poiseuille, and exit losses increase with the square of the flow (law of Bernoulli). The total change in pressure gradient (ΔP) is the sum of the two:
  . The loss coefficients, f1 and f2, are functions of stenosis geometry and rheologic properties of blood (viscosity and density). The graphic representation of this equation results in a quadratic relationship, in which the curvilinear shape demonstrates the presence of nonlinear exit losses. If no stenosis is present, the second term is zero, and the curve becomes a straight line (with a positive slope that depends on the diameter of the vessel, based on the law of Poiseuille). An, area of the normal segment; As, area of the stenosis; L, length.
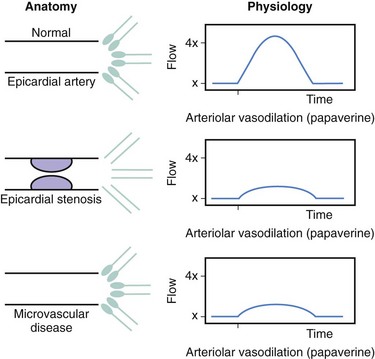


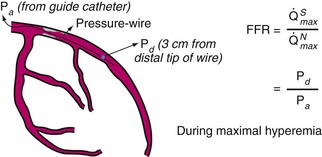
 , maximal flow of normal vessel;
  , maximal flow of stenotic vessel.


