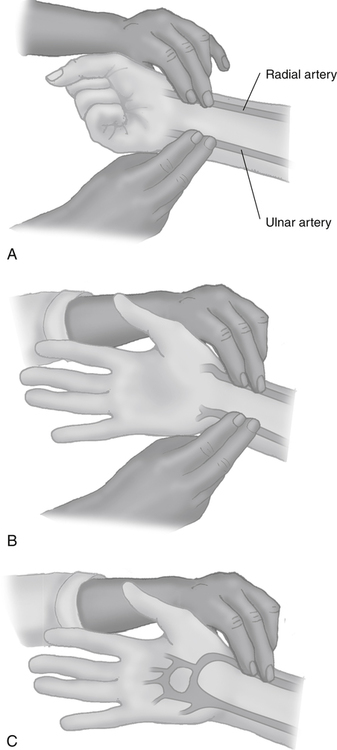
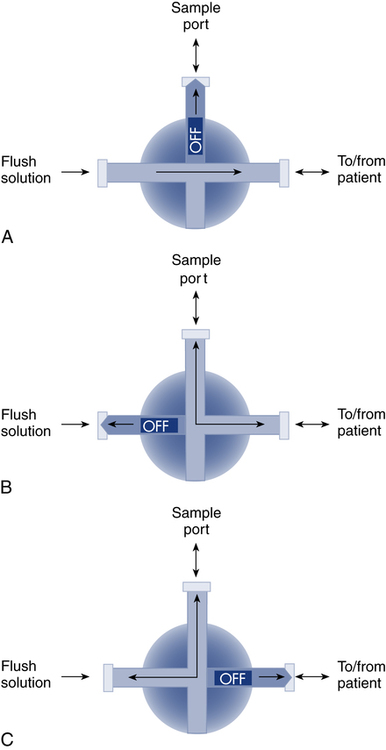
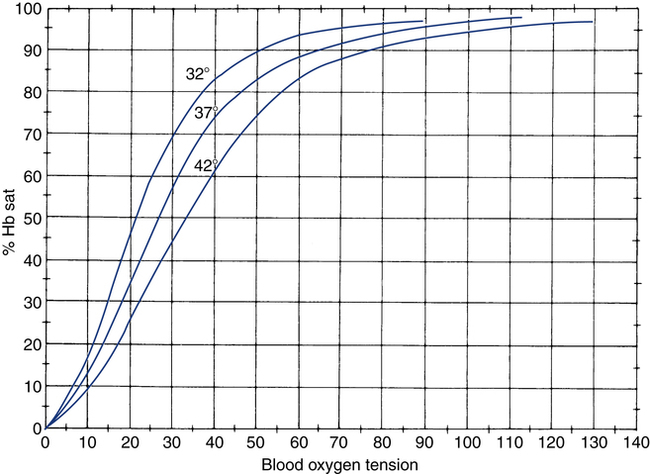
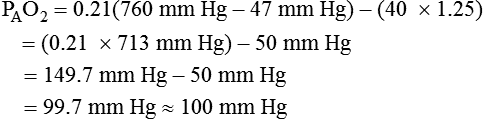
After reading this chapter, you will be able to: 1. Identify the reference ranges for both arterial blood gas and oximetry parameters. 2. Identify the indications for blood gas and oximetry analysis. 3. Differentiate between invasive and noninvasive methods for measuring blood gas and oximetry parameters. 4. Outline and explain the key procedural elements in obtaining arterial blood samples by means of puncture and indwelling arterial line. 5. Apply knowledge of the factors affecting hemoglobin saturation to interpretation of oximetry data. 6. Apply common indices of oxygenation to assess the cause and severity of hypoxemia. 7. Employ the Henderson-Hasselbalch equation to relate changes in Pco2 and 8. Describe the common causes, compensatory mechanisms, and expected blood gas findings seen in simple respiratory and metabolic acid-base disorders. 9. Describe the common causes and expected blood gas findings seen in combined and mixed acid-base disorders. 10. Identify the common pre-analytic, analytic and post-analytic errors in blood gas analysis. 11. Specify methods used to assuring valid measurement and use of blood gas data. 12. Accurately interpret arterial blood gas and/or oximetry data. This chapter focuses on the interpretation of arterial blood gas parameters because these measures best reflect the lung’s ability to exchange O2 and CO2 with the blood, the blood’s O2 carrying capacity, and its acid-base status. Table 8-1 outlines the common reference ranges for arterial blood gas measurements. TABLE 8-1 Sample Reference Ranges for Arterial Blood Gas Parameters BE, base excess; Peripheral venous blood has passed through the tissue vascular beds, so it reflects local metabolism and is of no value in assessing lung function. On the other hand, mixed venous blood samples from the pulmonary artery can be used to evaluate overall tissue oxygenation. Use of mixed venous blood for this purpose is discussed in Chapter 14. Blood oxygenation can be assessed by arterial blood gas (ABG) analysis, hemoximetry, pulse oximetry, and transcutaneous Po2 monitoring (mainly in infants and children). Ventilation can be measured by ABGs, transcutaneous Pco2 monitoring, or capnography. An ABG is required for accurate assessment of acid-base status. Table 8-2 outlines the key indications for these various measurements, as recommended by the American Association for Respiratory Care. TABLE 8-2 Indications for Blood Gas and Oximetry Analysis An arterial blood sample may be obtained from the radial, brachial, dorsalis pedis, or femoral arteries. The radial artery is preferred because it is readily accessible, easy to stabilize, and least likely to cause loss of distal perfusion if it become obstructed (normally the ulnar artery provides collateral circulation to the hand). Box 8-1 outlines the key steps involved in obtaining an arterial blood sample via percutaneous puncture. Coagulation-related laboratory tests should be checked to assess for risk for bleeding. Specifically, low platelet counts or increased bleeding times (high prothrombin time, partial thromboplastin time, or international normalized ratio values) may indicate a propensity for bleeding and the need to pressurize the puncture site longer than usual to prevent hemorrhage. See Chapter 7 for more detail on these tests. In terms of infection control, standard precautions are a must. Given that blood splashes can occur during arterial puncture, in addition to wearing gloves, clinicians should wear a face shield and consider using a gown to protect the skin and clothing (see Chapter 1). When expelling any air bubbles from the sample, one also must avoid discharge of blood droplets into the environment. This important step is accomplished by either (1) using a filter cap on the syringe, or (2) expelling the bubble-containing portion of the sample slowly into sterile gauze pad contained in a sealable plastic bag. When the radial artery is selected, a modified Allen test must be performed to evaluate the adequacy of collateral circulation to the hand (Fig. 8-1). To perform this test, the patient is instructed to make a tight fist. Then the RT compresses both the radial and ulnar arteries, after which the patient is told to open and relax the hand, which should reveal a blanched palm and fingers. Next, the RT releases pressure over the ulnar artery while observing the patient’s hand for color changes. If collateral flow is adequate, the patient’s hand will “pink up” within 10 to 15 seconds—a positive Allen test. A positive result confirms adequate collateral flow and that the radial artery is an acceptable sampling site. If the test is negative (the hand does not pink up rapidly), the radial artery is not an acceptable site for puncture. In such cases, the other wrist is evaluated, or the brachial artery is used to obtain the sample. An A-line system consists of a pressurized infusion set connected to a pressure transducer, intraflow flush device, and sampling port. Two different approaches are used for blood sampling: a three-way stopcock and a closed reservoir. Figure 8-2 depicts the design and operation of a typical three-way stopcock sampling port. The preparatory and follow-up steps for obtaining and processing a blood sample from an A-line are similar to those for radial arterial puncture, and an Allen test is obviously not needed. Instead, to confirm perfusion at the site of cannulation and proper continuous blood pressure measurement, one should observe the monitor and verify a satisfactory arterial waveform (see Chapter 15 for details on assessing arterial pressure waveforms). After gathering the needed equipment, the RT can proceed to obtain the sample using the applicable procedure, as outlined in Table 8-3. TABLE 8-3 Procedures for Obtaining Blood Samples from an Arterial Line (Adult Patient) Thus, because CO-oximeters measure the total complement of Hb and standard pulse oximeters do not, in the presence of dyshemoglobins, pulse oximetry will overestimate the true Sao2. Other factors that can result in erroneous estimation of Sao2 using pulse oximetry are summarized in Table 8-4. Pulse oximeter accuracy also is affected by the Sao2 level, with the range of error increasing substantially when saturations drop below 65% to 70%. TABLE 8-4 Common Factors Causing Erroneous Spo2 Readings (Compared with CO-Oximetry) Transcutaneous blood gas analysis generally has been limited to use with infants and small children in need of continuous monitoring of oxygenation and ventilation (see Chapter 12 for details). However, with the notable exception of monitoring for hyperoxemia, Ptco2 monitoring been replaced by pulse oximetry. This is because the accuracy of Ptco2 measures is highly dependent on the adequacy of perfusion. Low cardiac output, peripheral vasoconstriction, and dehydration all decrease capillary flow, which lowers Ptco2. And as with Pao2, Ptco2 does not fully reflect total oxygen content of the blood. As discussed subsequently, complete assessment of blood oxygen content also requires knowledge of Hb content and saturation. The primary application of capnography is to monitor patients during general anesthesia, mechanical ventilation, or resuscitation. As a noninvasive substitute for Paco2 to assess ventilation, we use the end-tidal level of CO2, either its partial pressure (Petco2) or %CO2. Normally, the Petco2 averages about 2 to 5 mm Hg less than the Paco2, or between 30 and 43 mm Hg (about 4.0% to 5.6%). Ventilation-perfusion imbalances can alter the difference between the Paco2 and Petco2, and these imbalances are common in patients with respiratory disorders; therefore, we normally focus on trending of the end-tidal CO2 levels when using capnography for continuous monitoring. On the other hand, discrete breath analysis can be used to identify abnormal events such as extubation or rebreathing. Chapter 14 provides more detail on the use of capnography to monitor patients in intensive care. where PAo2 = partial pressure of oxygen in the alveoli; FIo2 = fraction of inhaled oxygen; PB = barometric pressure; Ph2o = water vapor pressure in alveoli, 47 mm Hg at BTPS; Paco2 = arterial partial pressure of CO2 (assumed to approximate the alveolar Pco2); and 1.25 = factor based on the ratio of CO2 production to O2 consumption (respiratory quotient). For example, the PAo2 of a patient breathing room air (FIo2 = 0.21) at sea level (PB = 760 mm Hg) with a Paco2 of 40 mm Hg would be computed as follows: When the Pao2 is below 80 mm Hg, a condition of hypoxemia exists. As indicated in Table 8-5, the Pao2 level determines whether hypoxemia is classified as mild, moderate, or severe. TABLE 8-5 Causes of hypoxemia include hypoventilation, ventilation-perfusion ( TABLE 8-6 ARDS, acute respiratory distress syndrome; COPD, chronic obstructive pulmonary disease. ∗Normal P(A-a)o2 but Pao2 decreased in proportion to rise in Paco2. Breathing room air, the two gas partial pressures normally sum to about 140 mm Hg. Thus, with pure hypoventilation, if the Paco2 rises from 40 to 70 mm Hg (+30 mm Hg), the Pao2 should fall by a roughly comparable amount, that is, from 100 to 70 mm Hg. Sao2 is a measure of how well Hb molecules are “filled” with O2. The primary factor determining Sao2 is the blood Pao2. The oxyhemoglobin dissociation curve quantifies the relationship between Pao2 and Sao2 (Fig. 8-3). This curve is composed of an upper flat portion and a lower steep portion, with a Pao2 of 60 mm Hg and Sao2 of 90% marking the dividing point between the two. Looking at the upper flat portion, as the Pao2 drops 40 mm Hg from 100 mm Hg down to 60 mm Hg, the Sao2 decreases very little, by only about 5% to 7%. On the other hand, when the Pao2 falls below 60 mm Hg onto the steep portion of the curve, the Sao2 decrease is much more precipitous. For example, on this portion of the curve, a decrease in Pao2 of only 20 mm Hg (from 60 to 40 mm Hg) causes a 15% to 20% drop in Sao2. In addition to Pao2, Sao2 is affected by a number of other factors, the most important of which are body temperature, blood pH, and Paco2 (Box 8-2). Alkalosis, hypocapnia, hypothermia, and the presence of fetal Hb and carboxyhemoglobin shift the oxyhemoglobin dissociation curve to the left, resulting in a higher Sao2 for a given Pao2. Shifts to the left cause oxygen to bind more tightly to Hb, which facilitates O2 uptake in the lungs but can impair unloading at the tissues. Conversely, acidosis, hypercapnia, and fever shift the curve to the right and result in lower Sao2 values for the same Pao2. Shifts to the right have the opposite effect, resulting in decreased oxygen affinity for Hb. Although this facilitates unloading of O2 at the tissues, it can impair uptake in the pulmonary capillaries.
Interpretation of Blood Gases
 to pH.
Parameter
Symbol
Reference Ranges
Partial pressure of oxygen
Pao2
80-100 mm Hg (room air)
Hemoglobin content
Hb
Males: 14-8 g/dL
Females: 12-15 g/dL
Hemoglobin saturation
Sao2
>95%
Carboxyhemoglobin saturation
COHb
<3% (nonsmokers)
Methemoglobin saturation
metHb
<1.5%
Oxygen content
Cao2
16-20 mL/dL
Hydrogen ion concentration (negative log)
pH
7.35-7.45
Partial pressure of carbon dioxide
Pco2
35-45 mm Hg
Plasma bicarbonate

22-26 mmol/L
Base excess
BE
±2 mmol /L
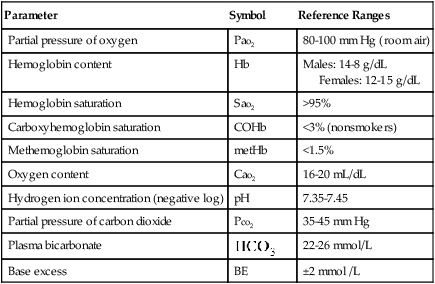
 , plasma bicarbonate concentration; Pco2, partial pressure of carbon dioxide; pH, hydrogen ion concentration in blood; Po2, partial pressure of oxygen; SO2 oxyhemoglobin saturation.
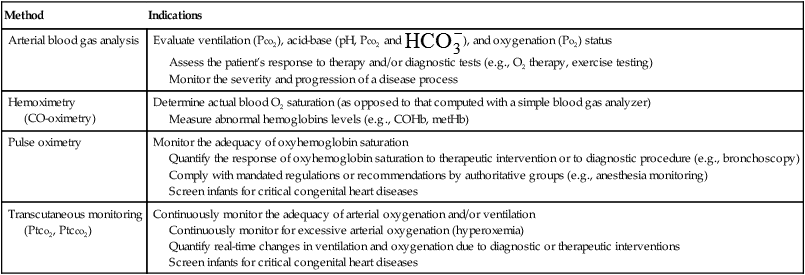
Indications for Blood Gas and Oximetry Analysis
Method
Indications
Arterial blood gas analysis
Evaluate ventilation (Pco2), acid-base (pH, Pco2 and  ), and oxygenation (Po2) status
Assess the patient’s response to therapy and/or diagnostic tests (e.g., O2 therapy, exercise testing)
Monitor the severity and progression of a disease process
Hemoximetry
(CO-oximetry)
Determine actual blood O2 saturation (as opposed to that computed with a simple blood gas analyzer)
Measure abnormal hemoglobins levels (e.g., COHb, metHb)
Pulse oximetry
Monitor the adequacy of oxyhemoglobin saturation
Quantify the response of oxyhemoglobin saturation to therapeutic intervention or to diagnostic procedure (e.g., bronchoscopy)
Comply with mandated regulations or recommendations by authoritative groups (e.g., anesthesia monitoring)
Screen infants for critical congenital heart diseases
Transcutaneous monitoring
(Ptco2, Ptcco2)
Continuously monitor the adequacy of arterial oxygenation and/or ventilation
Continuously monitor for excessive arterial oxygenation (hyperoxemia)
Quantify real-time changes in ventilation and oxygenation due to diagnostic or therapeutic interventions
Screen infants for critical congenital heart diseases
Sampling and Measurement
Invasive Blood Sampling
Arterial Puncture
Indwelling Catheter (A-Line)
Three-Way Stopcock Sampling
In-line Closed Reservoir Sampling
Swab sample port with alcohol
Attach waste syringe and turn stopcock off to flush solution/bag
Aspirate 5-6 mL blood (at least 6 times the system “dead” volume)
Turn stopcock off to port
Remove waste syringe, properly discard
Secure heparinized syringe to port, reopen stopcock, collect sample
Turn stopcock off to port, remove syringe
Flush line until clear
Turn stopcock off to patient, briefly flush sampling port, reswab with alcohol
Turn stopcock off to port and confirm restoration of arterial pulse pressure waveform
Slowly draw blood into the reservoir to the needed fill volume
Close the reservoir shut-off valve
Swab sample port with alcohol
Attach the blunt/needleless sampling syringe to the valved sampling port
Aspirate the needed volume of blood
Open the reservoir shut-off valve
Slowly depress reservoir plunger to reinfuse blood into patient
Reswab port and flush line until clear
Confirm restoration of arterial pulse pressure waveform
Noninvasive Measurements
Pulse Oximetry


Factor
Potential Error
Presence of COHb
Falsely high Spo2
Presence of metHb
Falsely low Spo2 if Sao2 > 85%
Falsely high Spo2 if Spo2 < 85%
Vascular dyes (e.g., methylene blue)
Falsely low Spo2
Dark skin pigmentation
Falsely high Spo2 (3%-5%)
Nail polish
Falsely high Spo2 (especially black)
Poor local perfusion (vasoconstriction and/or hypothermia)
Possible loss of signal, falsely low Spo2 (may be falsely high is sepsis)
Motion artifact
Unpredictable spurious readings or false alarms
Ambient light
Varies (e.g., falsely high Spo2 in sunlight); may also cause falsely high pulse reading
Transcutaneous Analysis
Capnography
Assessment of Oxygenation
Partial Pressure of Oxygen (Pao2)

Alveolar Air Equation

Hypoxemia: Severity and Causes
Pao2 (mm Hg)
Relative Severity
60-79
Mild
40-59
Moderate
<40
Severe
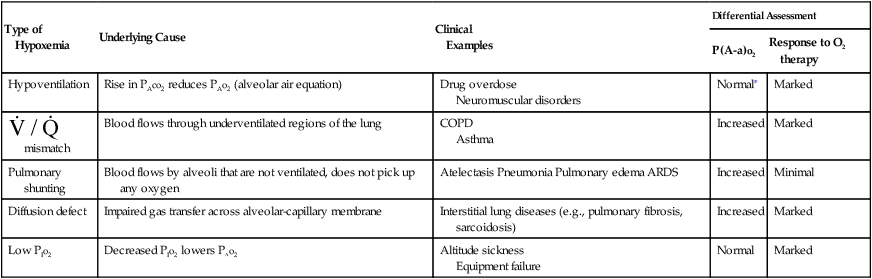
 ) mismatch, pulmonary shunting, diffusion defect, and breathing gas with a low partial pressure of oxygen (PIo2). Table 8-6 summarizes these causes, identifies some example conditions, and specifies how to differentiate among them. The
  mismatch is the most common cause of hypoxemia seen by RTs, with pure diffusion defects being relatively rare in general clinical practice.
Type of Hypoxemia
Underlying Cause
Clinical
Examples
Differential Assessment
P(A-a)o2
Response to O2 therapy
Hypoventilation
Rise in PAco2 reduces PAo2 (alveolar air equation)
Drug overdose
Neuromuscular disorders
Normal∗
Marked
 mismatch
Blood flows through underventilated regions of the lung
COPD
Asthma
Increased
Marked
Pulmonary shunting
Blood flows by alveoli that are not ventilated, does not pick up any oxygen
Atelectasis Pneumonia Pulmonary edema ARDS
Increased
Minimal
Diffusion defect
Impaired gas transfer across alveolar-capillary membrane
Interstitial lung diseases (e.g., pulmonary fibrosis, sarcoidosis)
Increased
Marked
Low PIo2
Decreased PIo2 lowers PAo2
Altitude sickness
Equipment failure
Normal
Marked
Hemoglobin (Hb) and Hb Saturation (Sao2, Spo2)

Interpretation of Blood Gases