Variable
Regression model
Boys
Girls
a
b
SD
a
B
SD
FEV1
Vn = exp(a + b•x)
−2.06
0.02
0.11
−2.01
0.02
0.13
FVC
Vn = exp(a + b•x)
−2.20
0.02
0.13
−2.10
0.02
0.13
FEV1/FVC
Vn = a + b•x
108.49
−0.15
7.03
102.86
−0.10
7.19
Airway obstruction was defined as FEV1/FVC < LLN (lower limit of normal), while a restrictive ventilatory pattern was diagnosed when FVC was below the LLN and FEV1/FVC > LLN. The LLN was the 5th percentile (−1.64 standard deviation from the predicted value) for all reference equations. The results were provided as z-score, defined as the number of standard deviations from the mean. The number and percentage of abnormal results found with the use of two different predicted values (Polish-1998 and GLI-2012) were compared.
2.2 Data Elaboration
Data were analyzed as follows: (1) entire group analysis, (2) male and female subgroup analysis, and (3) age-defined subgroup analysis. First, the values expressed as z-scores of predicted value calculated with the use of Polish-1998 vs. GLI-2012 reference equations were compared. Then, the number and percentage of abnormal results defined by either source of reference values were compared in the entire study group. Subsequently, similar analyses were performed separately in the subgroups of girls and boys. Finally, the results were compared in three age-groups defined as 4–10 years (Group 1), 10–14 years (Group 2), and 14–18 years (Group 3).
To assess the agreement between spirometry expressed as z-score obtained with GLI-2012 vs. Polish-1998 reference equations, the results were denoted as 0 and 1 (normal and abnormal results, respectively) and then the analysis for the inter-rater agreement was performed.
Data were presented as means ± SD. Differences between groups were tested using an unpaired t-test. Chi2 test was used to assess the proportion of abnormal results using two different reference values. The agreement between two observations was assessed using Scott’s pi for bivariate analysis. All p values were two-tailed and p < 0.05 was considered statistically significant. Analysis was performed using the Statistica software, ver. 10.0 (StatSoft, Tulsa, OK).
3 Results
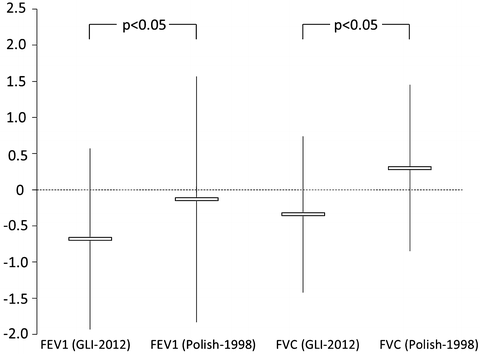
There were significant differences between the predicted values of FEV1 and FVC calculated with the GLI-2012 and Polish-1998 formulas. The mean predicted FEV1 was 2.75 ± 0.90 L vs. 2.51 ± 0.84 L, while the mean predicted FVC was 3.17 ± 1.11 L vs. 2.91 ± 1.06 L, according to the GLI-2012 and Polish-1998 equations, respectively (p < 0.05). The comparison of FEV1 and FVC which were expressed as z-score of GLI-2012 vs. Polish-1998 predicted values is presented in Fig. 1. Significant differences were demonstrated between either FEV1 z-score values or FVC z-score values (p < 0.05). The mean FEV1 z-score was (−0.68) ± 1.25 vs. (−0.13) ± 1.70, while the mean FVC z-score was (−0.34) ± 1.08 vs. 0.30 ± 1.15 when GLI-2012 and Polish-1998 reference values were used, respectively. There was no significant difference for FEV1/FVC z-scores.


Fig. 1
Differences between FEV1 and FVC expressed as GLI-2012 and Polish-1998 z-scores. Horizontal rectangles show mean values, while vertical lines represent SD
There was a significant difference in the proportion of abnormal spirometry results when GLI-2012 vs. Polish-1998 reference equations were used to calculate the FVC predicted values. A restrictive ventilatory pattern was diagnosed in 7.6 % of patients assessed according to the GLI-2012 predicted values compared with 3.8 % when the Polish-1998 equation was used (p = 0.04). A similar trend was noted in the proportion of patients with airway obstruction; albeit the difference here was inappreciable; the respective percentages amounted to 20.3 % vs. 17.5 %.
Comparison of spirometry variables for males and females gave virtually the same results as presented above. Significant differences in terms of predicted FEV1 and FVC calculated with the GLI-2012 and Polish-1998 equations were demonstrated in both gender groups (Tables 2 and 3). In consequence, FEV1 and FVC expressed as z-scores of GLI-2012 and Polish-1998 predicted values were significantly different. As reported for the entire group, FEV1/FVC ratio expressed as z-score in the GLI-2012 and Polish-1998 was similar in males and females (Tables 2 and 3). An analysis performed in three different age subgroups showed inconsistent results. In older children (≥10 years), FEV1 and FVC z-scores expressed as z-score of GLI-2012 and Polish-1998 predicted values were significantly different (Table 4). In younger children, the predicted FEV1 and FVC values did not differ. Hence, there were also no differences in FEV1 and FVC expressed as the GLI-2012 and Polish-1998 z-scores. In none of the three age subgroups, differences between FEV1/FVC ratio presented as z-scores of GLI-2012 and Polish-1998 were demonstrated (Table 4).
Table 2
Predicted spirometry values and measured spirometry variables expressed as GLI-2012 vs. Polish-1998 z–scores in boys
Variable | GLI-2012 | Polish-1998 | p |
|---|---|---|---|
FEV1 z-score | −0.79 (1.22) | −0.24 (1.79) | 0.007 |
FEV1 predicted (L) | 2.81 (1.05) | 2.53 (0.95) | 0.021 |
FVC z-score | −0.40 (1.09) | 0.28 (1.18) | 0.001 |
FVC predicted (L) | 3.28 (1.25) | 3.02 (1.22) | 0.003 |
FEV1/FVC z-score | −0.60 (1.30) | −0.63 (1.32) | 0.860 |
FEV1/FVC predicted (%) | 86.52 (1.32) | 86.20 (2.85) | 0.170 |
Table 3
Predicted spirometry values and measured spirometry variables expressed as GLI-2012 vs. Polish-1998 z–scores in girls
Variable | GLI-2012 | Polish-1998 | p |
|---|---|---|---|
FEV1 z-score | −0.53 (1.28) | −0.04 (1.54) | 0.001 |
FEV1 predicted (L) | 2.66 (0.75) | 2.42 (0.63) | 0.006 |
FVC z-score | −0.24 (1.06) | 0.35 (1.18) | 0.002 |
FVC predicted (L) | 3.00 (0.85) | 2.76 (0.77) | 0.018
Stay updated, free articles. Join our Telegram channel
Full access? Get Clinical Tree
 Get Clinical Tree app for offline access

|