Several epidemiologic studies have reported an association between elevated heart rate (HR) at rest and reduced survival. The usefulness of HR at rest in predicting end points in high-risk patients is yet to be definitively established. The purpose of this study was to clarify the relation between HR at rest with total and cardiovascular mortality in patients who underwent coronary angiography. A total of 3,316 Caucasian patients with available coronary angiograms were prospectively followed from 2001 to 2011 (median 9.9 years). The effect of HR at rest on total and cardiovascular mortality was explored, while correcting for a number of confounders. Patients in the highest quartile (HR at rest ≥84 beats/min) had survival times reduced by 1.2 and 1.4 years for overall and cardiovascular mortality, respectively. Likewise, these patients had significantly elevated adjusted risk for total (hazard ratio 1.39, 95% confidence interval 1.17 to 1.67, p for trend <0.001) and cardiovascular mortality (hazard ratio 1.38, 95% confidence interval 1.08 to 1.78, p for trend = 0.004). In conclusion, HR at rest is an inexpensive, easily measured, and modifiable predictor of mortality.
Numerous epidemiologic studies have linked tachycardia at rest to increased risk for morbidity and mortality. One of the first to describe this association was the Chicago People’s Gas Company Study. Here, mortality from cardiovascular disease (CVD) and non-CVD causes generally increased with accelerating heart rate (HR) at rest. Despite these studies having identified an association between HR at rest and CVD outcomes in a general population, few have explored this question in populations at intermediate to high risk. Examining the prognostic value of HR at rest in patients with stable coronary artery disease (CAD), Diaz et al found that high HR at rest independently predicted overall and CVD mortality. Likewise, admission HR at rest was considered the best predictor for in-hospital and 1-year postdischarge mortality in patients hospitalized for acute myocardial infarction. In light of these observations, however, tachycardia at rest as a modifiable CVD risk factor is often overlooked, especially in high-risk patients. Therefore, in the present investigation, we sought to determine the role of HR at rest as an important predictor of mortality in patients who have undergone coronary angiography.
Methods
The Ludwigshafen Risk and Cardiovascular Health (LURIC) study is an ongoing prospective cohort study of patients referred for coronary angiography and is designed to evaluate determinants of cardiovascular health. In total, 3,316 subjects (2,309 men and 1,007 women) aged 18 to 95 years were recruited from July 1997 to January 2000 at the Herzzentrum (Cardiac Center) Ludwigshafen in southwestern Germany. To reliably classify the CVD phenotype at study entry and to minimize misclassification of silent CAD as non-CAD, inclusion criteria for LURIC demanded the availability of coronary angiograms for all participants. Other inclusion and exclusion criteria, such as restriction to Caucasians of German ancestry and to stable clinical disease (except for acute coronary syndromes) were established to limit the genetic and clinical heterogeneity of the sample. Written informed consent was obtained from each participant, and the study was approved by the institutional review board at Ärztekammer Rheinland-Pfalz (Medical Association of Rheinland-Pfalz).
Detailed descriptions of the LURIC baseline examination are provided elsewhere. Briefly, all variables included in the present investigation were selected on the background of previous published research, data availability, and the possibility of confounding. In the morning, HR at rest was measured 5 times after 30 seconds apart, following a 10-minute rest in the supine position, with the average derived from the last 2 measurements. Death certificates obtained from local civil registries were reviewed to classify those who died from cardiovascular and noncardiovascular events. Death from cardiovascular causes included sudden cardiac death, fatal myocardial infarction, death from heart failure, death after intervention to treat CAD, stroke, and other deaths due to heart disease. Two experienced physicians masked to any data of the study probands except for the information from the death certificates independently classified the causes of death.
Continuous parameters following non-normal distributions underwent natural logarithmic transformation. Baseline characteristics according to quartiles of HR at rest are given as percentages for categorical data, and depending on their distribution, continuous data are presented as mean ± SD (normal distribution) or as geometric means with 95% confidence intervals (95% CI) (skewed distribution). Comparisons between groups were performed by analysis of variance for continuous parameters and by Pearson’s chi-square test for categorical variables. Kaplan-Meier survival function with the log-rank test for equality was used to evaluate the predictive ability of quartiles of HR at rest with overall and CVD mortality. We also fitted a fractional polynomial model to evaluate the nonlinear pattern of baseline HR at rest as a continuous parameter with all-cause and CVD mortality.
Time-to-event analyses were performed using multivariate Cox proportional-hazards regression. Three models were fitted for analyses; model 1 was unadjusted, model 2 was adjusted for age and gender, and model 3 also corrected for a range of conventional risk factors, including smoking, alcohol, exercise, obesity, high-sensitivity C-reactive protein, hypertension, diabetes mellitus, dyslipidemia, angina pectoris, symptoms of heart failure, CAD severity, family history and medical therapy. Because antihypertensive therapy (i.e., angiotensin-converting enzyme inhibitors, β blockers, and statins) may influence HR at rest, patients who reported the use of these agents were removed from secondary analyses to examine whether the initial findings would be affected. Furthermore, to minimize potential bias due to subclinical and undetected preexisting disease at baseline, we also carried out the analyses excluding those who died within 2 years of the time of enrollment. These analyses were considered significant at a 2-tailed p value of <0.05. All calculations were performed using Stata version 11.2 (StataCorp LP, College Station, Texas).
Results
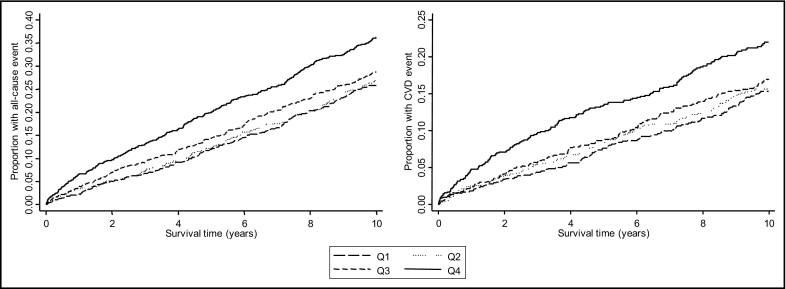
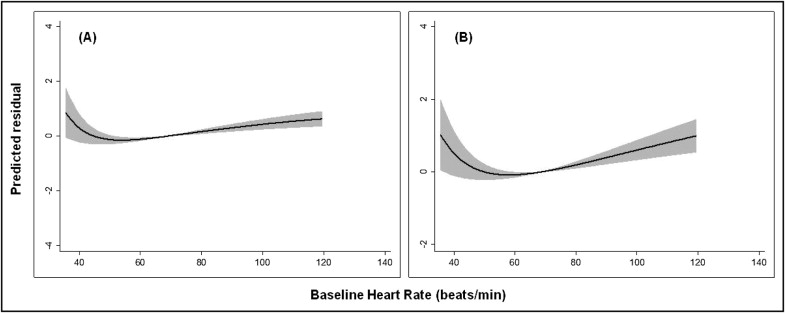
The median duration of follow-up was 9.9 years. There were 995 deaths (30%), of which 558 (56%) occurred because of CVD. A higher incidence of all-cause and CVD mortality was observed with increasing quartiles of HR at rest ( Table 1 ). Patients in the upper quartile (HR at rest ≥84 beats/min) had higher waist circumferences; body mass indexes; systolic and diastolic blood pressures; total cholesterol, low-density lipoprotein cholesterol, and ratios of low-density lipoprotein to high-density lipoprotein cholesterol; glucose; glycosylated hemoglobin; interleukin-6; high-sensitivity C-reactive protein; and symptoms of heart failure ( Table 1 ). Greater proportions of metabolic syndrome, hypertensive, diabetic, and less physically active patients were found in higher quartiles ( Table 1 ). In contrast, there was a greater prevalence of angina pectoris in the lowest (HR at rest <64 beats/min) compared to the highest quartile of HR at rest. Likewise, β blockers and statins were more prevalent in the lowest quartile compared to the others ( Table 1 ). Figure 1 presents Kaplan-Meier survival plots for total and CVD mortality according to quartiles of HR at rest. Patients in the highest quartile for HR at rest showed greater risk for all-cause and CVD mortality. Log-rank test for equality revealed a significant difference among quartiles (p <0.001). Interestingly, after correction for covariates, fractional polynomial models revealed a J-shaped curve for HR at rest with overall and CVD mortality ( Figure 2 ). That is, in addition to those with high HRs at rest, patients with very low HRs at rest also seem to be at risk for experiencing either end point.
| Variable | Quartiles of HR at Rest | ||||
|---|---|---|---|---|---|
| 1 | 2 | 3 | 4 | p Value | |
| (n = 829) | (n = 815) | (n = 843) | (n = 829) | ||
| All-cause mortality | 221 (26.6%) | 225 (27.6%) | 248 (29.4%) | 301 (36.3%) | <0.001 |
| CVD mortality | 123 (14.8%) | 126 (15.4%) | 138 (16.3%) | 171 (20.6%) | 0.007 |
| Age (years) | 62.7 ± 10.5 | 62.9 ± 10.7 | 62.8 ± 10.3 | 62.2 ± 10.7 | 0.49 |
| Men | 616 (74.3%) | 566 (69.4%) | 558 (66.1%) | 570 (68.7%) | 0.003 |
| Waist (cm) | 98.4 ± 10.4 | 8.2 ± 11.7 | 99.5 ± 12.4 | 99.5 ± 12.6 | 0.04 |
| Body mass index (kg/m 2 ) | 27.2 ± 3.6 | 27.3 ± 3.8 | 27.6 ± 4.2 | 27.8 ± 4.5 | 0.03 |
| Metabolic syndrome | 429 (51.7%) | 415 (50.9%) | 495 (58.7%) | 512 (61.7%) | <0.001 |
| HR (beats/min) | 55 ± 4 | 64 ± 2 | 71 ± 2 | 84 ± 8 | <0.001 |
| Systolic blood pressure (mm Hg) | 140 ± 24 | 139 ± 23 | 140 ± 23 | 144 ± 23 | <0.001 |
| Diastolic blood pressure (mm Hg) | 78 ± 11 | 79 ± 11 | 81 ± 10 | 84 ± 11 | <0.001 |
| Prevalence of hypertension | 421 (50.7%) | 393 (48.2%) | 450 (53.3%) | 500 (60.3%) | <0.001 |
| Triglycerides (mg/dl) | 147.92 (142.60–152.34) | 148.80 (143.49–154.11) | 152.34 (147.92–157.66) | 155.00 (149.69–160.32) | 0.16 |
| Total cholesterol (mg/dl) | 185.23 (182.91–187.55) | 186.77 (184.06–189.01) | 189.48 (187.16–192.19) | 191.80 (189.01–194.51) | 0.002 |
| LDL cholesterol (mg/dl) | 108.66 (106.34–110.10) | 110.21 (107.90–112.53) | 111.76 (109.44–114.11) | 112.92 (111.37–116.41) | 0.02 |
| HDL cholesterol (mg/dl) | 37.51 (36.74–38.28) | 37.12 (36.35–37.90) | 36.74 (36.10–37.51) | 37.12 (36.35–37.90) | 0.59 |
| LDL cholesterol/HDL cholesterol | 2.89 (2.82–2.96) | 2.96 (2.88–3.03) | 3.02 (2.95–3.10) | 3.06 (2.97–3.14) | 0.008 |
| Prevalence of dyslipidemia | 557 (67.1%) | 557 (68.3%) | 596 (70.7%) | 577 (69.6%) | 0.43 |
| Glucose (mg/dl) | 93.67 (91.33–94.21) | 94.39 (92.77–96.01) | 96.73 (94.93–98.36) | 103.40 (101.24–105.74) | <0.001 |
| Glycosylated hemoglobin (%) | 6.1 | 6.2 | 6.3 | 6.5 | <0.001 |
| Diabetes mellitus | 91 (10.9%) | 134 (16.4%) | 155 (18.3%) | 210 (25.3%) | <0.001 |
| Interleukin-6 (ng/L) | 2.95 (2.79–3.13) | 3.22 (3.03–3.42) | 3.50 (3.29–3.71) | 4.03 (3.78–4.30) | <0.001 |
| High-sensitivity C-reactive protein (mg/L) | 2.59 (2.37–2.82) | 3.20 (2.93–3.49) | 3.85 (3.52–4.21) | 4.85 (4.41–5.32) | <0.001 |
| Smoking status | |||||
| Never | 274 (33.0%) | 303 (37.1%) | 319 (37.8%) | 298 (35.9%) | 0.23 |
| Former | 396 (47.7%) | 354 (43.3%) | 348 (41.2%) | 370 (44.6%) | |
| Current | 159 (19.1%) | 158 (19.3%) | 176 (20.8%) | 161 (19.4%) | |
| Current alcohol drinkers | 443 (53.4%) | 386 (47.3%) | 410 (48.6%) | 414 (49.9%) | 0.08 |
| Exercise ⁎ | |||||
| Low | 189 (22.8%) | 199 (24.4%) | 202 (23.9%) | 261 (31.4%) | 0.003 |
| Average | 448 (54.0%) | 423 (51.9%) | 460 (54.5%) | 420 (50.6%) | |
| High | 173 (20.8%) | 175 (21.4%) | 165 (19.5%) | 133 (16.0%) | |
| Family history of CVD | 442 (53.3%) | 427 (52.3%) | 440 (52.1%) | 420 (50.6%) | 0.75 |
| Angina status | |||||
| Stable | 257 (31.4%) | 272 (34.2%) | 269 (32.9%) | 219 (27.0%) | 0.04 |
| Unstable | 321 (39.2%) | 292 (36.7%) | 303 (37.0%) | 316 (39.0%) | |
| New York Heart Association functional class | |||||
| I | 471 (56.8%) | 410 (50.3%) | 460 (54.5%) | 381 (45.9%) | <0.001 |
| II | 223 (26.9%) | 248 (30.4%) | 256 (30.3%) | 240 (28.9%) | |
| III | 113 (13.6%) | 130 (15.9%) | 110 (13.0%) | 175 (21.1%) | |
| IV | 22 (2.6%) | 27 (3.3%) | 17 (2.0%) | 33 (3.9%) | |
| CAD severity | |||||
| 0 | 241 (29.3%) | 239 (29.6%) | 269 (32.5%) | 286 (35.1%) | 0.01 |
| 1 | 154 (18.7%) | 151 (18.7%) | 146 (17.6%) | 169 (20.7%) | |
| 2 | 182 (22.1%) | 158 (19.6%) | 144 (17.4%) | 139 (17.0%) | |
| 3 | 244 (29.7%) | 257 (31.9%) | 268 (32.4%) | 220 (27.0%) | |
| Cardiovascular medication use | |||||
| Angiotensin-converting enzyme inhibitors | 444 (53.5%) | 428 (52.5%) | 438 (51.9%) | 459 (55.3%) | 0.52 |
| β blockers | 600 (72.3%) | 553 (67.8%) | 519 (61.5%) | 427 (51.5%) | <0.001 |
| Statins | 423 (51.0%) | 397 (48.7%) | 399 (47.3%) | 336 (40.5%) | <0.001 |
⁎ Exercise was recorded using an 11-point scale ranging from bedridden to extremely active and categorized as “low” (not very active), “average” (usual office work), or “high” (heavy work or sports).
Stay updated, free articles. Join our Telegram channel

Full access? Get Clinical Tree


