The legitimacy of expensive revascularization procedures in patients with stable coronary artery disease (CAD) remains to be seen. In this study, resource utilization was compared across age-group categories of patients with stable CAD who underwent revascularization. Fiscal year 2006 discharge data maintained by the Maryland Health Services Cost Review Commission were examined. Current Procedural Terminology codes 36.1x and 36.0x were used to identify patients who underwent coronary artery bypass grafting (CABG) and percutaneous coronary intervention (PCI), respectively. Patients with acute myocardial infarctions (International Classification of Diseases, Ninth Revision, Clinical Modification code 410.xx) were excluded to limit the study group to patients with stable CAD. Totals of 1,066, 2,909, 4,272, 4,514, and 1570 hospitalizations per 100,000 hospitalizations were observed in the age groups 40 to 50, 50 to 60, 60 to 70, 70 to 80, and ≥80 years, respectively. The costs of hospitalization were driven by length of stay and choice of revascularization procedure (CABG vs PCI). There was trend toward increasing total costs and longer hospital stays with increasing age (p for trend <0.001) in patients who underwent CABG. Although the adjusted costs and adjusted length of stay were significantly higher in the patients who underwent PCI who were aged ≥80 years than in those aged 40 to 50 years, the differences among other age-group categories were not statistically significant. In conclusion, older patients with stable CAD who undergo interventions represent a substantial expenditure. Hospitalization costs are driven by longer hospital stays and the choice of CABG compared to PCI. With data supporting aggressive medical management of such patients, it is advisable to rethink management strategies in these patients.
The recent Clinical Outcomes Utilizing Revascularization and Aggressive Drug Evaluations (COURAGE) trial comparing the clinical efficacy and cost-effectiveness of adding percutaneous coronary intervention (PCI) to optimal medical therapy in the management of patients with stable coronary artery disease (CAD) failed to show any direct survival benefit or cost-effective potential of adding PCI to aggressive medical management. In contrast, Claude et al demonstrated that an invasive strategy for stable CAD in elderly patients was indeed cost effective compared to medical therapy in the medium and long terms, suggesting that direct costs of revascularization should not withhold an invasive strategy for the treatment of stable angina in elderly patients. The legitimacy of expensive revascularization procedures in patients with stable CAD remains to be established. With an increasing aging population in our community, health care expenditures continue to increase. In this study, we attempted to determine the economic burden of chronic stable CAD in elderly patients compared to younger patients who undergo revascularization procedures.
Methods
We conducted a cross-sectional study of Maryland hospital discharges maintained by the Maryland Health Services Cost Review Commission during fiscal year 2006 (July 2005 to June 2006). In addition to baseline demographic data, extensive data were available on the primary admission diagnosis, coded using the International Classification of Diseases, Ninth Revision, Clinical Modification, as well as up to 14 secondary diagnoses and the codes for procedures performed during each hospitalization. The Health Services Cost Review Commission uses diagnosis-related groups to set case mix–adjusted limits on the revenue per discharge for inpatient services, similar to Medicare’s inpatient prospective payment nationally.
The study sample consisted of adults aged ≥18 years with stable CAD who underwent revascularization procedures. Current Procedural Terminology codes 36.1x and 36.0x were used to identify patients who underwent coronary artery bypass grafting (CABG) and PCI, respectively. Patients with acute myocardial infarctions (International Classification of Diseases, Ninth Revision, Clinical Modification code 410.xx) were excluded to limit the study group to patients with chronic CAD. Total costs and length of stay (LOS) were used as primary outcome variables. We used the Deyo-adapted Charlson index to predict patient co-morbidities. For predicting Deyo-adapted Charlson index values, there are 17 diagnotic indicators identifiable by unique International Classification of Diseases, Ninth Revision, Clinical Modification codes, assigned weights from 1 through 6, giving the index a possible range of 0 to 33.
The analysis was carried out using Stata version 10.0 (StataCorp LP, College Station, Texas). The bivariate associations between categorical variables and the age-group categories were tested using the Kruskal-Wallis test. One-way analysis of variance was used to compare means of continuous variable across the age-group categories. Bonferroni’s correction was applied while performing pairwise comparisons. We hypothesized that the distribution of total expenditure and LOS across the age-group categories may be confounded by gender, race, co-morbidities, patient disposition, and primary payment source. We used bootstrapped estimates (1,000 replicates) from multivariate linear regression modeling to determine adjusted comparisons of cost and LOS across the age-group categories. Regression analyses were performed separately for the PCI and CABG patients with logarithm-transformed costs and LOS, to satisfy the constant variance assumption for multiple linear regression (homoskedascity). The significance level was set at 0.05 for all statistical tests.
Secondary analysis was performed to develop a predictor model of total hospitalization costs in these patients, including confounders and mediators of the proposed statistical association. Because LOS and type of revascularization procedure were hypothesized to significantly affect hospitalization costs, this predictor model was developed after incorporation of these variables into the regression modeling, in addition to the aforementioned confounders.
Results
A total of 638,447 unique hospitalizations were identified in the data set. We found 13,830 revascularization-related hospitalizations that matched the inclusion criteria. Baseline characteristics of the study groups are listed in Table 1 . Significant differences in racial distribution were evident among the study groups. Elderly patients aged 60 to 70 years and those aged ≥80 years were observed to have significantly higher co-morbidities compared to those aged 40 to 50 years. In addition, it was noted that a significantly greater proportion of older patients aged ≥80 years required continued care other services (1.2%) compared to any other age group.
| Characteristic | Age Group (years) | p Value (ANOVA) | ||||
|---|---|---|---|---|---|---|
| 40–50 | 50–60 | 60–70 | 70–80 | ≥80 | ||
| Number of patients | 995 | 2,856 | 3,907 | 4,418 | 1532 | |
| Age (years) | 45.7 ± 2.6 | 55.2 ± 2.8 | 64.4 ± 2.8 | 73.1 ± 3.1 | 82.8 ± 2.9 | <0.001 |
| Men | 734 (73.7%) | 2,062 (72.2%) | 2,636 (67.5%) | 2,908 (65.8%) | 774 (50.5%) | <0.001 |
| Whites | 714 (71.8%) | 2,109 (73.8%) | 2,964 (75.9%) | 3,406 (77.1%) | 1,343 (87.7%) | <0.001 |
| Blacks | 191 (19.2%) | 521 (18.2%) | 637 (16.3%) | 721 (16.3%) | 131 (8.6%) | |
| Asians | 15 (1.5%) | 55 (1.9%) | 100 (2.6%) | 49 (1.1%) | 12 (0.8%) | |
| Others | 75 (7.5%) | 171 (6.0%) | 206 (5.3%) | 242 (5.5%) | 46 (3.0%) | |
| Deyo-adapted Charlson index | <0.001 | |||||
| 0 | 552 (55.5%) | 1,346 (47.1%) | 1,586 (40.6%) | 1,943 (44.0%) | 688 (44.9%) | |
| 1 | 302 (30.4%) | 1,018 (35.6%) | 1,402 (35.9%) | 1,688 (38.2%) | 516 (33.7%) | |
| 2 | 85 (8.5%) | 312 (10.9%) | 552 (14.1%) | 484 (11.0%) | 197 (12.9%) | |
| ≥3 | 56 (5.6%) | 180 (6.3%) | 367 (9.4%) | 303 (6.9%) | 131 (8.6%) | |
| Mean ± SD | 0.69 ± 1.1 | 0.81 ± 1.0 | 0.97 ± 1.1 | 0.85 ± 1.0 | 0.90 ± 1.1 | <0.001 |
| Primary payer | <0.001 | |||||
| Medicare | 80 (8.0%) | 247 (8.7%) | 1,793 (45.9%) | 4,035 (91.3%) | 1,502 (98.0%) | |
| Medicaid | 87 (8.7%) | 198 (6.9%) | 147 (3.8%) | 29 (0.7%) | 5 (0.3%) | |
| Private | 435 (43.7%) | 1,411 (49.4%) | 1,181 (30.2%) | 146 (3.3%) | 12 (0.8%) | |
| Self | 50 (5.0%) | 92 (3.2%) | 52 (1.3%) | 9 (0.2%) | 0 | |
| HMO | 331 (33.3%) | 867 (30.3%) | 696 (17.8%) | 193 (4.4%) | 12 (0.8%) | |
| Other | 12 (1.2%) | 41 (1.4%) | 36 (0.9%) | 6 (0.1%) | 1 (0.1%) | |
| Previous myocardial infarction | 224 (22.5%) | 576 (20.7%) | 692 (17.7%) | 930 (21.1%) | 312 (20.4%) | 0.001 |
| Patient disposition | <0.001 | |||||
| Home | 972 (97.7%) | 2,779 (97.4%) | 3,673 (94.1%) | 4,107 (93.2%) | 1,315 (86.0%) | |
| Continued care (another service/hospital) | 1 (0.1%) | 8 (0.3%) | 19 (0.5%) | 16 (0.4%) | 18 (1.2%) | |
| Died | 7 (0.7%) | 5 (0.2%) | 4 (0.1%) | 4 (0.1%) | 0 | |
| Left against medical advice | 15 (1.5%) | 62 (2.2%) | 208 (5.3%) | 282 (6.4%) | 196 (12.8%) | |
Tables 2 and 3 list unadjusted resource utilization across the age-group categories. The highest proportion of PCI was encountered in patients aged 40 to 50 years (85%), and the highest proportion of CABG was seen in patients aged 60 to 70 years (25.9%). There was a trend toward a longer hospital stay in the CABG and PCI groups with increasing age. In the CABG arm, the mean LOS ranged from 6.3 ± 3.3 days in patients aged 40 to 50 years to 10.4 ± 7.9 days in patients aged ≥80 years. In the PCI arm, the mean LOS ranged from 1.5 ± 1.6 days in patients aged 40 to 50 years to 2.1 ± 2.7 days in those aged ≥80 years. Mean total costs were significantly higher in the CABG patients compared to the PCI patients in each age-group category (p <0.001 for each comparison). There was a statistically significant trend toward increasing total costs in the CABG arm with increasing age (p <0.001). However, this trend was not apparent in patients who underwent PCI (p = 0.05).
| Characteristic | Age Group (years) | p Value for Trend ⁎ | p Value (ANOVA) | ||||
|---|---|---|---|---|---|---|---|
| 40–50 | 50–60 | 60–70 | 70–80 | ≥80 | |||
| Number of patients | 995 | 2,856 | 3,907 | 4,418 | 1532 | ||
| Procedure performed | <0.001 | ||||||
| CABG | 149 (15.0%) | 605 (21.2%) | 1,006 (25.9%) | 754 (17.1%) | 268 (17.6%) | ||
| PCI | 841 (85.0%) | 2,246 (78.8%) | 2,881 (74.1%) | 3,658 (82.9%) | 1,259 (82.5%) | ||
| LOS (days) | 2.3 ± 2.7 | 2.7 ± 3.6 | 3.3 ± 5.2 | 3.0 ± 4.8 | 3.6 ± 5.3 | <0.001 | <0.001 |
| ICU/CCU stay (days) | 0.3 ± 1.1 | 0.4 ± 1.7 | 0.6 ± 3.1 | 0.5 ± 2.7 | 0.7 ± 2.9 | <0.001 | <0.001 |
| Total costs | $15,622 ± $10,694 | $17,298 ± $13,637 | $19,145 ± $21,595 | $17,550 ± $17,493 | $19,482 ± $19,116 | <0.001 | <0.001 |
| Characteristic | Age Group (years) | p Value for Trend | p Value (ANOVA) | ||||
|---|---|---|---|---|---|---|---|
| 40–50 | 50–60 | 60–70 | 70–80 | ≥80 | |||
| PCI | |||||||
| Number of patients | 841 | 2,246 | 2,881 | 3,658 | 1259 | ||
| LOS (days) | 1.5 ± 1.6 | 1.5 ± 1.9 | 1.6 ± 1.6 | 1.7 ± 2.1 | 2.1 ± 2.7 | <0.001 | <0.001 |
| ICU/CCU stay (days) | 0.1 ± 0.5 | 0.1 ± 1.0 | 0.1 ± 0.5 | 0.1 ± 0.6 | 0.1 ± 0.9 | 0.3 | 0.09 |
| Total costs | $13,230 ± $7,778 | $13,584 ± $9,314 | $13,459 ± $7,749 | $13,375 ± $7,857 | $14,412 ± $9,169 | 0.05 | 0.002 |
| CABG | |||||||
| Number of patients | 149 | 605 | 1,006 | 754 | 268 | ||
| LOS (days) | 6.3 ± 3.3 | 7.2 ± 4.5 | 8.2 ± 6.6 | 9.4 ± 7.9 | 10.4 ± 7.9 | <0.001 | <0.001 |
| ICU/CCU stay (days) | 1.3 ± 1.5 | 1.7 ± 2.7 | 2.1 ± 4.9 | 2.6 ± 5.9 | 2.9 ± 5.7 | <0.001 | <0.001 |
| Total costs | $27,580 ± $12,465 | $30,904 ± $17,765 | $33,758 ± $25,896 | $37,426 ± $31,455 | $42,115 ± $29,729 | <0.001 | <0.001 |
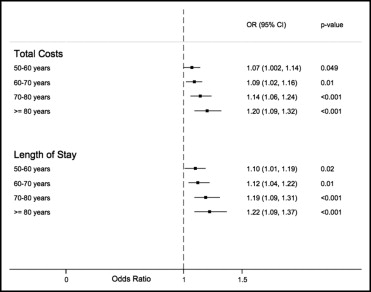
A statistically significant trend toward increasing adjusted costs and LOS was apparent in the CABG arm (p <0.001; Figure 1 ). Patients aged ≥80 years incurred a 20% (95% confidence interval [CI] 9% to 32%) higher total cost and a 22% (95% CI 9% to 37%) longer duration of hospital stay compared to patients aged 40 to 50 years. In the PCI arm, no significant differences in adjusted hospitalization costs or LOS were observed in the age groups 50 to 60, 60 to 70, and 70 to 80 years compared to patients aged 40 to 50 years. Only patients aged ≥80 years incurred a significantly higher total cost and a longer duration of hospital stay compared to those aged 40 to 50 years ( Figure 2 ).