Group I
Group II
Group III
Patients
9
5
4
Clinic
Age
63.4
62.2
70.7
Males (%)
88.8
60
100
Smoking (%)
77.7
80
75
Diabetes (%)
22.2
40
25
Hypertension (%)
33.3
20
25
Leukocytosis
–
–
–
Increased ESR
–
–
–
Pain at aneurysm site
–
–
–
Morphology
Aneurysm location
Common femoral
–
2
–
Profunda femoris
–
–
1
Popliteal
9
3
3
Wall thickness
0.21 ± 0.03
0.36 ± 0.02
0.55 ± 0.05*
Number of inflammatory cells/2,116 um2
2.2 ± 0.3
9.2 ± 0.5
13.2 ± 0.3
A segment of the aneurysm wall was harvested and then fixed in 10 % formalin and stained with hematoxylin & eosin, van Geison + elastic fibers, PTAH, and Alcian Pas. Ten specimens were also obtained from the atherosclerotic non-aneurysmatic femoral arteries of ten autopsies of patients with similar demographic characteristics (Table 25.2) and submitted to the same procedure for histological examination. Clinical history and laboratory examinations of all patients were reviewed with particular attention to infections, autoimmune diseases, arteritis, and the presence of non-specific leukocitosis.
Table 25.2
Patient characteristics in the PAAA and control groups
Parameters | PAAA | Control |
|---|---|---|
Age | 64.5 | 68.3 |
Males (%) | 83.3 | 86.6 |
Smoking (%) | 77.7 | 73.3 |
Diabetes (%) | 27.7 | 13.3 |
Hypertension (%) | 27.7 | 20.0 |
Wall thickness | 0.33 ± 0.047 | 0.23 ± 0.02* |
Atherosclerosis | + | + |
Macroscopic signs of inflammation | − | − |
Numbers of inflammatory cell | 6.6 ± 1.14 | 1.48 ± 0.24** |
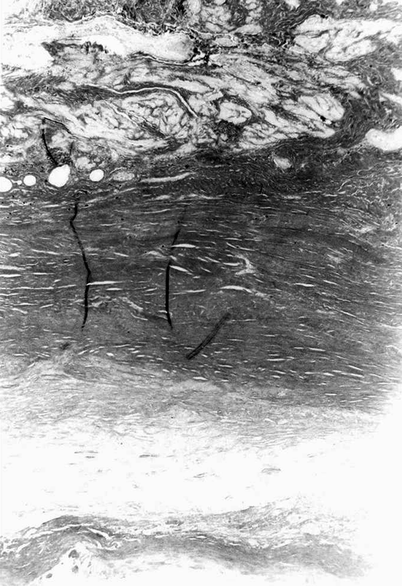
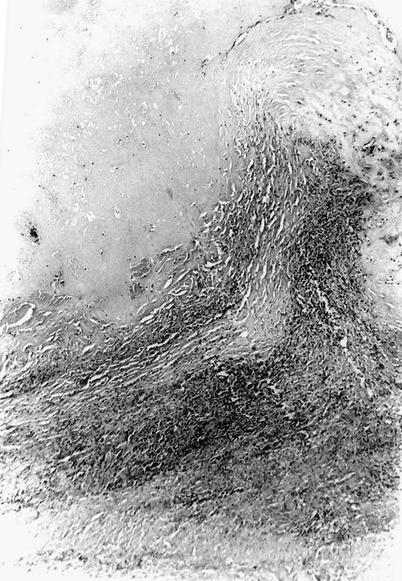
Histological features of inflammation were classified according to the criteria proposed by Rose and Dent for abdominal aortic aneurysm (AAA) [6]: group I, scarce inflammatory infiltrate; group II, moderate inflammation; group III, severe degree of inflammatory infiltrate. Quantitatively, the number of inflammatory cells present within a 2,116 μm2 square in 100 random fields was calculated. Group I was composed of specimens with <4 cells/2,116 μm2, group II of specimens with 4–11 cells/2,116 μm2, and group III of specimens with more than 11 cells. The mean wall thickness was calculated as a mean of three different random measurements in the same specimen and expressed in centimeters. The distribution of the specimens into the three groups was treated with the Kolmogorov-Smirnov test. Correlation between peripheral atherosclerotic artery aneurysms and control specimens and among the three different groups were evaluated by Mann-Whitney U test. Histological findings of cholesterol clusters, fibrohyaline degeneration, and internal elastic lamina disruption were always evident. In the media and adventitia, histological evidence of a slight lymphomonoplasmocytic infiltrate (<4 cells/2,116 μm2) was found in nine aneurysmatic walls (group I) (Fig. 25.1). In five cases (27.7 %), a moderate quantity (from 4 to 11 cells/2,116 μm2) of lymphomonoplasmocytic infiltrate was found in the tunica media and adventitia (group II) (Fig. 25.2). In the four remaining cases (22.2 %), the inflammatory infiltrate showed a high number (>11 cells/2,116 μm2) of lymphomonoplasmocytic elements (group III) (Fig. 25.3). In this group of cases, it was possible to observe a different arrangement of the infiltrate: in pseudo-follicles in three cases and widespread in one case. In one case the lumen of the aneurysm was almost completely occupied by recent thrombus. In the ten control specimens, histology did not reveal moderate or severe inflammation in any of the cases. Mild changes were found in all of the cases. The mean number of inflammatory cells was 1.47 ± 0.24, and they were distributed mainly in the adventitia (Table 25.2).


Fig. 25.1
Histological appearance of group I aneurysmatic wall showing absence of lymphomonoplasmocytic infiltrate (<4 cells/2,116 μm2)

Fig. 25.2
Histological appearance of group II aneurysmatic wall. In this case, a moderate lymphomonoplasmocytic infiltrate can be seen in the tunica media and adventitia (from 4 to 11 cells/2,116 μm24 cells/2,116 μm2)
< div class='tao-gold-member'>
Only gold members can continue reading. Log In or Register to continue
Stay updated, free articles. Join our Telegram channel

Full access? Get Clinical Tree


