There are currently no data evaluating the hematologic and biocompatibility profile of transcatheter aortic valves in vivo. We evaluated the incidence, predictive factors, and clinical consequences associated with hemolysis post-transcatheter aortic valve implantation (TAVI). A total of 122 patients who underwent TAVI with a balloon-expandable valve were included. Baseline blood sampling and echocardiography, followed by early post-TAVI echocardiography and repeat blood sampling, at 6 to 12 months post-TAVI were performed. Hemolysis post-TAVI was defined according to the established criteria. The incidence of hemolysis post-TAVI was 14.8% yet no patient experienced severe hemolytic anemia requiring transfusion. Compared with the nonhemolysis group, those with hemolysis demonstrated significant reductions in hemoglobin (p = 0.012), were more frequently women (67% vs 34%, p = 0.016), and had a higher incidence of post-TAVI severe prosthesis-patient mismatch (PPM) (44% vs 17%, p = 0.026). The rate of mild or more prosthetic valve regurgitation did not significantly differ between those patients with and without hemolysis (56% vs 37%, p = 0.44). Wall shear rate (WSR) and energy loss index (ELI), both indirect measures of shear stress, were higher (p = 0.039) and lower (p = 0.004), respectively, in those patients with hemolysis. Increasing PPM severity was also associated with significant stepwise WSR increments and ELI decrements (p <0.01 for both). In conclusion, subclinical hemolysis occurred in 15% of patients following TAVI. Although prosthetic valve regurgitation had no impact on hemolysis, a novel association between PPM and hemolysis was found, likely driven by higher shear stress as determined by WSR and ELI. These hematologic and biomechanical findings may have long-term clinical implications and could affect future transcatheter aortic valve design.
In the absence of significant prosthetic valve regurgitation (PVR), significant intravascular hemolysis causing anemia is exceedingly rare post-surgical aortic valve replacement (SAVR). However, chronic subclinical intravascular hemolysis is not uncommon in patients after modern prosthetic and bioprosthetic valve replacement. The past decade has witnessed the evolution of transcatheter aortic valve implantation (TAVI) as the standard of care for patients with severe symptomatic aortic stenosis who are either deemed inoperable or whose surgical risk is considered excessive. Despite the impressive clinical benefits of TAVI in the high-risk aortic stenosis population, long-term valve performance and durability in vivo are unknown. Variable degrees of post-TAVI PVR are common, representing an important limitation of current-generation transcatheter valves, which remain inferior to SAVR from a PVR perspective. Moreover, moderate-severe PVR has evolved as an important predictor of post-TAVI mortality. To date, the occurrence of hemolysis post-TAVI and its relation to the presence of post-TAVI PVR are unknown. The present study was thus designed to evaluate the incidence, predictors, and clinical consequences of hemolysis post-TAVI.
Methods
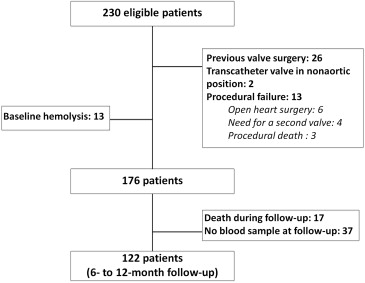
Consecutive patients with severe symptomatic aortic stenosis and a high or prohibitive surgical risk, with a recommendation by the Heart Team to undergo TAVI from March 2012 to April 2013, were screened for study inclusion. Baseline co-morbidities were defined according to the Society of Thoracic Surgeons criteria. Figure 1 details the flowchart of patients initially screened for study inclusion and reasons for exclusion. Details of specific TAVI-related procedural variables have been previously described. All data were prospectively collected in a dedicated database, and the protocol was performed in accordance with the local Ethics Committee.
Blood samples were obtained as part of the routine TAVI workup at baseline (within 4 weeks pre-TAVI) and at 6 to 12 months post-TAVI. The clinical hematology laboratory of the Quebec Heart and Lung Institute analyzed hemoglobin, haptoglobin, lactate dehydrogenase (LDH), and reticulocyte levels. The presence of hemolysis was defined according to the criteria previously used by Horskotte and Josa et al. Elevated serum LDH was the primary variable used for determining the presence or absence of hemolysis (>220 IU/L), in addition to at least 2 minor criteria that included low hemoglobin values (<138 g/L for men or <124 g/L for women), low haptoglobin values (<0.5 g/L), or high percentage of reticulocytes (≥2%).
Doppler echocardiography examination was performed at baseline and at hospital discharge post-TAVI. All images were analyzed in a central echocardiography core laboratory at the Quebec Heart and Lung Institute. The presence and degree of aortic regurgitation and PVR were recorded in all patients. The degree of aortic regurgitation/PVR was classified as either none/trace, mild, moderate, or severe according to the Valve Academic Research Consortium-2 criteria. The presence and severity of prosthesis-patient mismatch (PPM) were evaluated using the indexed aortic valve area (AVA). The absence of PPM was defined as >0.85 cm 2 /m 2 , moderate PPM was defined as ≥0.65 cm 2 /m 2 but <0.85 cm 2 /m 2 , and severe PPM defined as <0.65 cm 2 /m 2 .
Wall shear stress post-SAVR is known to vary according to valve design, significantly influencing aortic rheology. The energy loss index (ELI) is also regarded as a more accurate parameter for evaluating flow turbulence and energy loss by incorporating the extent of pressure recovery downstream of aortic valves, especially in patients with small aortas and in the presence of significant aortic stenosis or PPM. These factors were explored in relation to the presence of PPM and subsequent influence on hemolysis. Wall shear rate (WSR), an indirect measurement of wall shear stress, was calculated according to the formula: peak aortic jet velocity/vena contracta diameter. The vena contracta diameter was calculated from the effective orifice area (i.e., cross-sectional area of the vena contracta). The ELI was calculated according to the equation: ELI = [(AVA × A A )/(A A − AVA)]/Body-surface area, whereby A A represents the aortic cross-sectional area at the sinotubular junction.
Continuous variables are presented as mean ± SD or median (interquartile range) depending on data distribution. Group comparisons were tested for differences with the Student’s t test or Wilcoxon test for continuous variables, and the chi-square test or Fisher’s exact test was used for categorical variables. Differences between baseline and follow-up hematologic values were obtained with paired Student’s t test. Hematologic values at baseline and follow-up were compared between groups using an analysis of covariance with baseline measurement as the covariate; the results are presented as the least-squares mean (LSM) difference between patients with and without hemolysis with 95% confidence intervals (CIs). The results were considered significant with p values <0.05. All analyses were conducted using the statistical package SAS, version 9.3 (SAS Institute, Cary, North Carolina).
Results
Overall, 18 of 122 (15%) of the TAVI population satisfied criteria for intravascular hemolysis. Table 1 describes clinical and procedural variables of the overall studied population according to those patients with (n = 18) or without (n = 104) hemolysis. Baseline and postprocedural echocardiographic data are included. Patients with hemolysis were more frequently women (67% vs 34%, p = 0.016), had more likely received a smaller (23 mm) valve prosthesis (61% vs 26%, p = 0.005), and exhibited smaller AVA values post-TAVI (1.28 ± 0.35 vs 1.60 ± 0.44 cm 2 , p = 0.002). Hemolysis was associated with a higher incidence of moderate-severe PPM (83% vs 50%, p = 0.008) and severe PPM (44% vs 18%, p = 0.026).
| Variable | Hemolysis | P-value | |
|---|---|---|---|
| No (n=104) | Yes (n=18) | ||
| Age (years) | 79.0±7.6 | 78.7±8.8 | 0.87 |
| Men | 69 (66%) | 6 (33%) | 0.016 |
| NYHA class | |||
| I-II | 40 (38%) | 7 (39%) | 1.0 |
| III-IV | 64 (62%) | 11 (61%) | |
| Diabetes mellitus | 33 (32%) | 5 (28%) | 1.0 |
| Atrial fibrillation (by history) | 16 (15%) | 3 (17%) | 1.0 |
| GFR (ml/min/m 2 ) | 62±26 | 67±25 | 0.39 |
| STS-PROM (%) | 6.7±4.8 | 7.3±3.6 | 0.16 |
| Procedural Approach | |||
| Transfemoral | 72 (70%) | 11 (61%) | 0.58 |
| Transapical | 19 (18%) | 5 (28%) | |
| Transaortic | 13 (13%) | 2 (11%) | |
| Prosthesis type | |||
| Balloon-expandable | 99 (95%) | 16 (89%) | 0.28 |
| Self-expandable | 5 (5%) | 2 (11%) | |
| Prosthesis size (mm) | |||
| 23 | 27 (26%) | 11 (61%) | 0.005 |
| 26-29-31 | 77 (74%) | 7 (39%) | |
| Echocardiographic post-TAVI | |||
| LVEF (%) | 53±12 | 48±14 | 0.25 |
| Mean aortic gradient (mmHg) | 9.3±3.6 | 10.3±3.6 | 0.19 |
| AVA (cm 2 ) | 1.60±0.44 | 1.28±0.35 | 0.002 |
| SPAP (mmHg) | 39.7±10.9 | 48.6±14.4 | 0.056 |
| ≥Mild paravalvular regurgitation | 38 (37%) | 10 (56%) | 0.44 |
| Moderate/severe paravalvular regurgitation | 8 (8%) | 4 (22%) | 0.21 |
| Moderate/severe prosthesis-patient mismatch | 50 (48%) | 15 (83%) | 0.008 |
| Severe prosthesis-patient mismatch | 18 (17%) | 8 (44%) | 0.026 |
Figure 2 describes baseline and follow-up hematologic values pre- and post-TAVI in patients with and without hemolysis. All patients with hemolysis had LDH levels >240 IU (mean 287 ± 53 IU) and, compared with patients not meeting criteria for hemolysis, presented with significantly greater reductions in hemoglobin (LSM difference, 95% CI −0.84 [−3.76, 2.07] vs −5.50 [−12.4, 1.43] g/L, p = 0.013 for between-group difference) and haptoglobin (LSM difference, 95% CI −0.22 [−0.10, −0.33] vs −0.70 [−1.0, −0.39], p <0.001 for between-group differences) over time. No patient experienced clinically decompensated hemolysis leading to severe anemia requiring blood transfusion. No bleeding events were associated with hemoglobin decrease at follow-up.
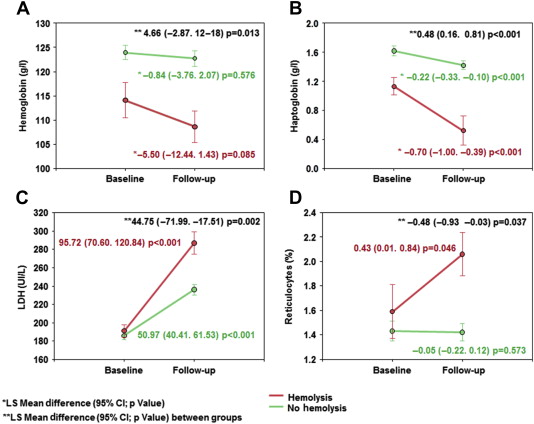
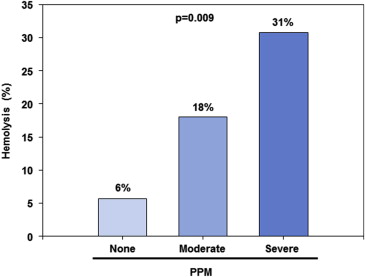
Figure 3 describes the increasing incidence of hemolysis with various degrees of PPM. However, the rate of mild or more PVR post-TAVI was similar in patients with and without hemolysis (56% vs 44%, p = 0.44). Moderate-severe PVR rates observed in patients with hemolysis were more than double those without hemolysis (22% vs 9%, p = 0.21).
Stay updated, free articles. Join our Telegram channel

Full access? Get Clinical Tree


