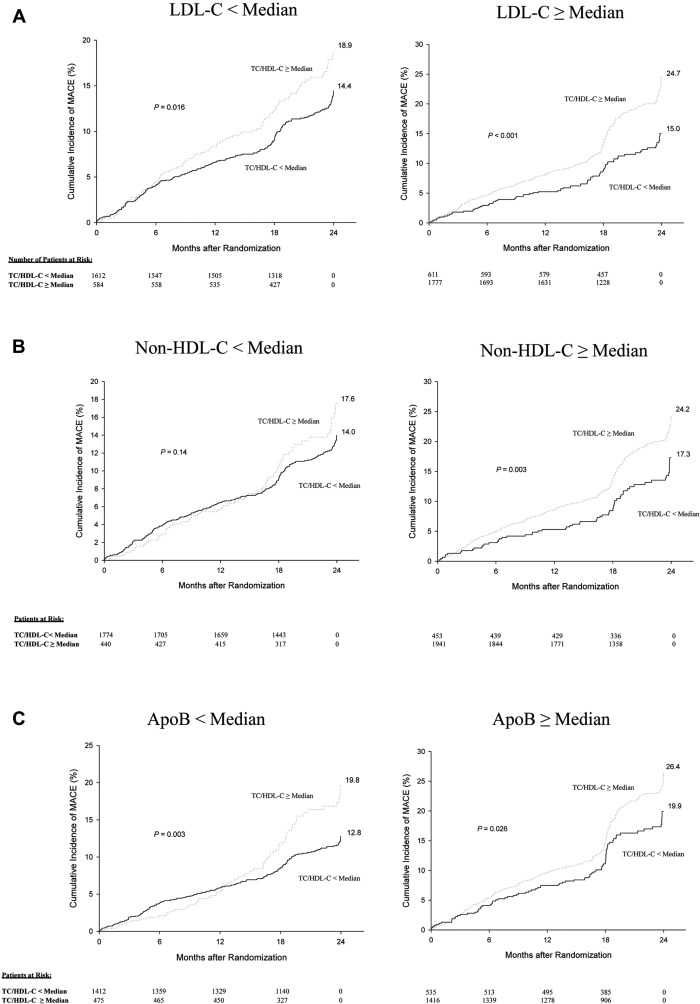
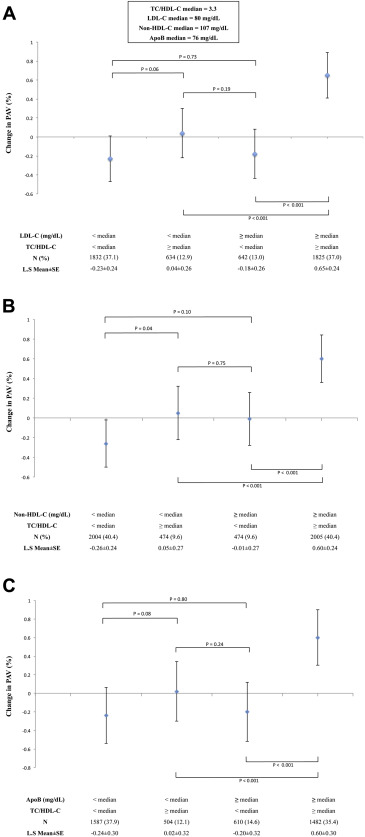
The total cholesterol to high-density lipoprotein cholesterol (TC/HDL-C) ratio may quantify atherogenic lipoproteins beyond low-density lipoprotein cholesterol (LDL-C), non-HDL-C and apolipoprotein B (apoB). We analyzed pooled data from 9 trials involving 4,957 patients with coronary artery disease undergoing serial intravascular ultrasonography to assess changes in percent atheroma volume (ΔPAV) and 2-year major adverse cardiovascular event (MACE) rates when TC/HDL-C levels were discordant with LDL-C, non-HDL-C, and apoB. Discordance was investigated when lipid levels were stratified by </≥median levels (TC/HDL-C 3.3 vs LDL-C 80, non-HDL-C 107, and apoB 76 mg/dl) or </≥very low percentile equivalent cutoffs (TC/HDL-C 2.5 vs LDL-C 70, non-HDL-C 89, and apoB 59 mg/dl). When stratified by median levels, TC/HDL-C was commonly observed to be discordant with LDL-C (26%), non-HDL-C (20%), and apoB (27%). In patients with LDL-C, non-HDL-C, or apoB <median, those with a discordant TC/HDL-C ≥median demonstrated less PAV regression and greater MACE (18.9%, 17.7%, 19.8%, respectively) compared with TC/HDL-C <median (14.4%, 14.0%, 12.8%; p = 0.02, 0.14, 0.003, respectively). In patients with LDL-C, non-HDL-C, or apoB ≥median, those with a discordant TC/HDL-C <median demonstrated less PAV progression and lower MACE (15.0%, 17.3%, 19.9%, respectively) compared with TC/HDL-C ≥median (24.7%, 24.2%, 26.4%; p <0.001, 0.003, 0.03, respectively). In conclusion, the TC/HDL-C ratio reclassifies atheroma progression and MACE rates when discordant with LDL-C, non-HDL-C, and apoB within subjects. Thus, using the ratio, in addition to individual lipid parameters, may identify patients who may benefit from more intensive lipid modification.
Targeting low-density lipoprotein cholesterol (LDL-C) has been fundamental in cardiovascular disease prevention and treatment, contributing to major reductions in cardiovascular mortality. However, exclusively targeting LDL-C is limited by measurement variability, and lack of consideration for the role of triglyceride-rich remnant lipoproteins and LDL particle–based measurements in cardiovascular risk assessment. Increasing interest has thus focused on the use of alternative lipid parameters including non–high-density lipoprotein cholesterol (non-HDL-C), apolipoprotein B (apoB), and the total cholesterol to HDL-C ratio (TC/HDL-C) for residual risk assessment and treatment. The TC/HDL-C ratio predicts cardiovascular risk in different patient populations, providing incremental predictive value to LDL-C and non-HDL-C measurements. However, its additive value in daily clinical practice remains uncertain given that TC and HDL-C are used in established cardiovascular risk scores. Nevertheless, recent studies have postulated that TC/HDL-C may carry information reflecting atherogenic lipoprotein particle size and concentration not available in cholesterol-based measurements. This additional information, available from the standard lipid profile, may play an important role in defining residual cardiovascular risk when lipid parameters are discordant. In this study, we examine the impact of discordance between TC/HDL-C and other lipid parameters on changes in coronary atheroma volume and cardiovascular event rates.
Methods
Patients were selected from 9 clinical trials (n = 4,957) that used serial coronary intravascular ultrasonography (IVUS) to longitudinally assess the impact of medical therapies on changes in coronary atheroma volume. The selected trials and serial acquisition of IVUS images are described in detail in the online appendix ( Online Appendix Methods ). The Cleveland Clinic Institutional Review Board declared our study exempt. A sensitivity analysis excluding 455 torcetrapib-treated patients was performed because they demonstrated increased HDL-C levels, thus lower TC/HDL-C, coupled with a known higher rate of cardiovascular events, attributable to torcetrapib.
TC/HDL-C, LDL-C, non-HDL-C, and apoB levels used in the analysis represented on-treatment averages during the trial periods. We chose the median cutoffs discordance method given its simplicity and ease of application. We categorized patients into categories of < or ≥median levels of TC/HDL-C versus each of LDL-C, non-HDL-C, and apoB. Discordance was defined as TC/HDL-C ≥median and the alternative measure <median, or vice versa. In addition, we examined TC/HDL-C discordance with other lipid parameters using very low percentile equivalent cutoffs because some national guidelines still recommend an LDL-C target <70 mg/dl for high-risk patients. Given that our study population is composed of patients with established coronary disease, we selected these lower lipoprotein cutoffs from the National Health and Nutrition Examination Survey (NHANES), a nationally representative sample of the US population, where an LDL-C of 70 mg/dl was at the ninth percentile, equivalent to a TC/HDL-C level of 2.5, non-HDL-C of 89 mg/dl and apoB of 59 mg/dl. The impact of TC/HDL-C levels was also analyzed in (1) nondiabetic versus diabetic patients and (2) patients receiving high-intensity statin therapy (HIST; defined as atorvastatin 80 mg or rosuvastatin 20 or 40 mg ) versus those not receiving HIST.
Continuous variables are reported as mean ± SD when normally distributed and median (interquartile range) when nonnormally distributed. A paired t test or Wilcoxon signed-rank test was used to test whether laboratory changes from baseline were significantly different from zero. Locally Weighted Scatterplot Smoothing and partial Spearman correlation coefficients adjusting for trial and baseline percent atheroma volume (PAV) were used to assess the overall relation between achieved TC/HDL-C, LDL-C, non-HDL-C, and apoB against ΔPAV. Due to a high degree of correlation among TC/HDL-C, LDL-C, non-HDL-C, and apoB, 4 separate multivariate models were constructed to assess the relation of each lipid with overall ΔPAV and annualized ΔPAV (given differences in the duration of trials included in our study). For comparison of β-coefficient, each multivariate model included the same set of covariates aside from each lipid parameter. Other factors considered for the model included race (white/nonwhite), baseline body mass index, a history of myocardial infarction (MI), a history of percutaneous coronary intervention, hypertension, current smoking, baseline and concomitant angiotensin-converting enzyme inhibitor use, baseline statin use, concomitant aspirin and beta-blocker use, baseline HDL-C, and on-treatment triglycerides (only in LDL-C model due to collinearity with other lipid parameters).
Analysis of covariance models, adjusting for trial and baseline PAV, were used to assess ΔPAV overall as well as by concordant-discordant groups. Least squares (LS) means ± standard error are reported. Kaplan–Meier curves were used to assess the impact of TC/HDL-C discordance on first major adverse cardiovascular event (MACE, defined as cardiovascular death, nonfatal MI, stroke, coronary revascularization, hospitalization for unstable angina) across strata of alternative lipid parameters (</≥median, </≥percentile equivalent cutoff). A 24-month cut-off period was used for the survival analysis and patients without a MACE at this time point were censored. Kaplan–Meier estimates of cumulative incidence of MACE are reported on each plot with log-rank tests performed to assess differences in these estimates.
All tests were 2-tailed with a 0.05 significance level except in the case of pairwise concordant-discordant group comparisons where a Bonferroni correction was applied giving a 0.01 significance level (0.05/5 comparisons). Analyses were performed with SAS version 9.2 (Cary, North Carolina), R version 3.0.1 (Vienna, Austria), and SigmaPlot version 11.0 (San Jose, California).
Results
Baseline demographics, clinical characteristics, and medication use of the pooled IVUS study populations are listed in Table 1 . Baseline, follow-up and changes in plaque and laboratory measurements are listed in Table 2 .
| Characteristic | Cohort (N = 4957) |
|---|---|
| Age (years), mean ± SD | 57.9 ± 9.2 |
| Female | 1392 (28%) |
| White | 4608 (93%) |
| Current Smoker | 1154 (25%) |
| Hypertension | 3847 (78%) |
| Diabetes mellitus | 1435 (29%) |
| BMI (kg/m 2 ), mean ± SD | 30.8 ± 5.8 |
| Prior MI | 1444 (29%) |
| Prior PVD | 244 (5%) |
| Prior PCI | 1824/4607 (40%) |
| Acute coronary syndrome | 964/3822 (25%) |
| Medications | |
| Statin – prior | 3682 (74%) |
| Statin – concomitant | 4734 (96%) |
| ACE Inhibitors – Prior | 2475 (50%) |
| Any ACE-I or ARB – concomitant | 3351 (68%) |
| Aspirin – concomitant | 4667 (94%) |
| Beta Blockers – concomitant | 3771 (76%) |
| Parameter | Baseline | Follow-up | Change (95% CI) | P-value ∗ |
|---|---|---|---|---|
| Laboratory † | ||||
| LDL-C (mg/dL) | 105.5 ± 35.4 | 83.0 ± 27.8 | -14.4 (-15.4, -13.5) | <0.001 |
| Non-HDL-C (mg/dL) | 135.9 ± 40.9 | 110.9 ± 33.0 | -13.6 (-14.4, -12.8) | <0.001 |
| HDL-C (mg/dL) | 43.3 ± 11.7 | 48.2 ± 14.7 | 13.0 (12.2, 13.8) | <0.001 |
| TC/HDL-C | 4.4 ± 1.5 | 3.6 ± 1.2 | -15.6 (-16.3, -14.9) | <0.001 |
| Apolipoprotein B (mg/dL) | 99.7 ± 34.4 | 80.1 ± 24.93 | -14.7 (-15.6, -13.9) | <0.001 |
| Triglycerides (mg/dL), median (IQR) | 137 (97.5, 194) | 127 (94.5, 172) | -7.2 (-25.8, 16.7) | <0.001 |
| CRP (mg/L), median (IQR) | 2.3 (1.1, 5.2) | 1.6 (0.7, 3.8) | -25.0 (-60.0, 30.8) | <0.001 |
| IVUS ‡ | ||||
| PAV (%) | 38.00 ± 8.93 | 38.01 ± 9.05 | 0.01 (-0.08, 0.11) | 0.77 |
| LS Mean: 0.18 (-0.37, 0.74) | 0.52 | |||
∗ Tests whether change is significantly different from zero.
† Reflects % changes from baseline with mean change (95% CI) reported, unless noted.
‡ Reflects absolute changes from baseline with mean change and LS mean (95% CI) reported.
TC/HDL-C, LDL-C, non-HDL-C, and apoB levels were linearly related with ΔPAV as illustrated by Locally Weighted Scatterplot Smoothing plots ( Online Appendix Figure 1 ). Spearman partial correlation coefficients, after adjusting for trial and baseline PAV, were 0.17, 0.16, 0.18, and 0.10, respectively (p <0.001 in all comparisons). Multivariate-adjusted models confirmed that on-treatment levels of TC/HDL-C, LDL-C, non-HDL-C, and apoB were independently associated with PAV progression ( Online Appendix Table 1 ). A sensitivity analysis excluding the 455 torcetrapib-treated patients showed a similar relation between TC/HDL-C and ΔPAV after adjustment for the same factors ( Online Appendix Table 2 ).
When stratified according to </≥median levels, TC/HDL-C (median 3.3) was discordant with LDL-C (median 80 mg/dl) in 26%, non-HDL-C (median 107 mg/dl) in 20% and apoB (median 76 mg/dl) in 27% of patients, respectively ( Figure 1 ). The distribution of lipid parameters in the discordant versus concordant groups of TC/HDL-C versus LDL-C are listed in Online Appendix Table 3 .

Over 8,800 patient-years of follow-up, there were 710 MACE (9.2 per 100 patient-years). MACE rates were greater in those with higher (≥median) compared with lower (<median) TC/HDL-C levels when stratified according to LDL-C levels (LDL-C <median group: 18.9% versus 14.4%, p = 0.02; LDL-C ≥median group: 24.7% versus 15.0%, p <0.001; Figure 1 ). Similar trends were observed in the population stratified according to non-HDL-C levels (non-HDL-C <median group: 17.6% versus 14.0%, p = 0.14; non-HDL-C ≥median group: 24.2% versus 17.3%, p = 0.003; Figure 1 ) and apoB levels (apoB <median group: 19.8% versus 12.8%, p = 0.003; apoB ≥median group: 26.4% versus 19.9%, p = 0.03 Figure 1 ).
Similar results were found when examining the effect of TC/HDL-C discordance on ΔPAV. There was a tendency toward PAV progression in patients with higher TC/HDL-C levels ≥median compared with a tendency toward regression in those with lower (<median) levels when stratified according to LDL-C levels (LDL-C <median group: ΔPAV LS mean ± standard error 0.04 ± 0.26 versus −0.23 ± 0.24, p = 0.06; LDL-C ≥median group: 0.65 ± 0.24% versus −0.18 ± 0.26%, p <0.001; Figure 2 ). Similar trends were observed in the population stratified according to non-HDL-C levels (non-HDL-C <median group: 0.05 ± 0.27% versus −0.26 ± 0.24%, p = 0.04; non-HDL-C ≥median group: 0.60 ± 0.24 versus −0.01 ± 0.27%, p <0.001; Figure 2 ) and apoB levels (apoB <median group: 0.02 ± 0.32 versus −0.24 ± 0.30, p = 0.08; apoB ≥median group: 0.60 ± 0.30 versus −0.20 ± 0.32, p <0.001; Figure 2 ).

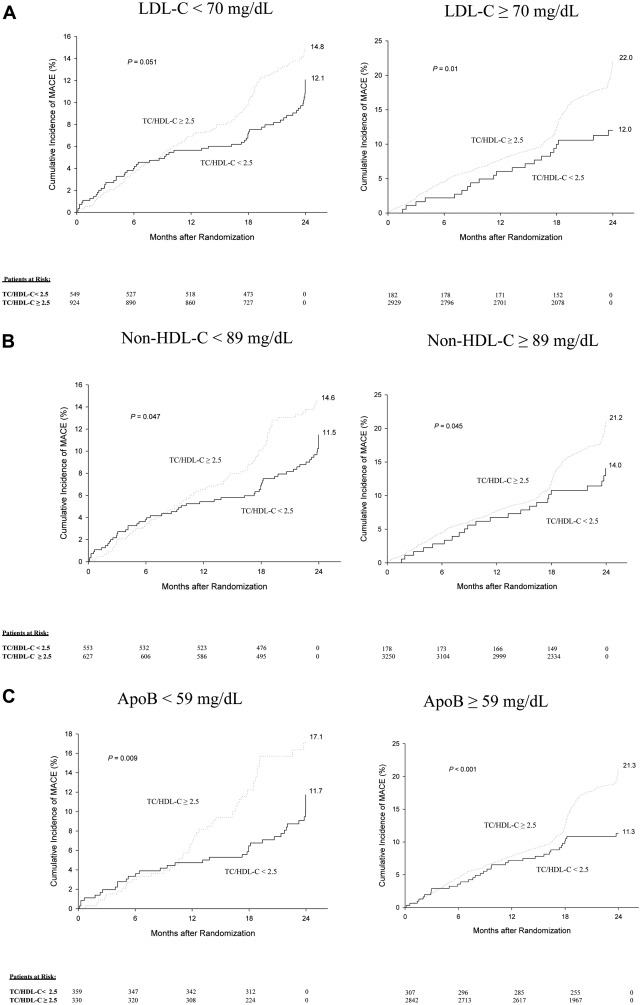
We studied the impact of TC/HDL-C levels (</≥2.5) at NHANES defined very low percentile equivalent cutoffs of LDL-C (</≥70 mg/dl), non-HDL-C (</≥89 mg/dl), and apoB (</≥59 mg/dl) to assess its incremental prognostic value at such low levels. In patients with LDL-C <70 mg/dl, almost 2/3 (62%) demonstrated discordantly high TC/HDL-C ≥2.5 with a trend toward greater MACE (14.8% vs 12.1%, p = 0.051; Figures 3 ). In patients with non-HDL-C <89 mg/dl, over half (53%) demonstrated high TC/HDL-C ≥2.5 also with a trend toward greater MACE (14.6% vs 11.5%, p = 0.047; Figure 3 ). In patients with apoB <59 mg/dl, those with discordant TC/HDL-C ≥2.5 (47%) demonstrated significantly greater MACE (17.1% vs 11.7%, p <0.01; Figure 3 ). In contrast, only a small percentage of patients with LDL-C (5%), non-HDL-C (6%), and apoB (10%) levels ≥the percentile equivalent cutoff demonstrated discordantly low TC/HDL-C levels <2.5. This discordance associated with lower MACE (LDL-C group: 12.0% vs 22.0%, p = 0.01; non-HDL-C group: 14.0% vs 21.2%, p = 0.045; apoB group: 11.3% vs 21.3%, p <0.001; Figure 3 ). When examining ΔPAV, only patients with concordantly high TC/HDL-C and alternative lipid parameters (≥percentile equivalent cutoffs) demonstrated trends toward PAV progression. However, patients with discordance as well as those with concordantly lower TC/HDL-C and alternative lipid parameters (<percentile equivalent cutoffs) demonstrated trends toward PAV regression ( Figure 4 ).


Stay updated, free articles. Join our Telegram channel

Full access? Get Clinical Tree


