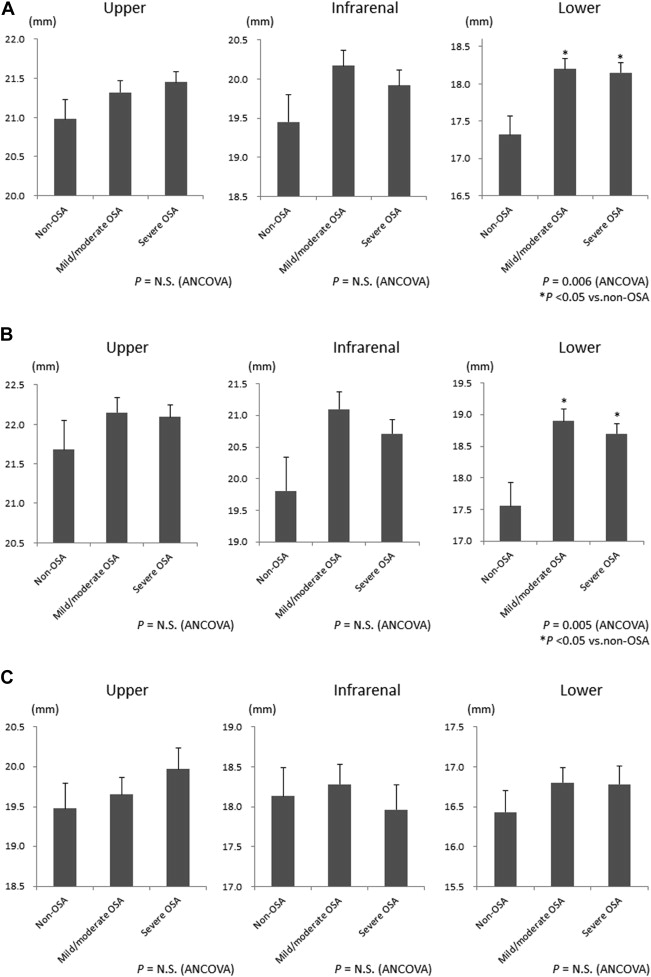
Although obesity has been reported to be a potential risk factor for abdominal aortic dilatation, the impact of obstructive sleep apnea (OSA) on the abdominal aortic diameter remains unknown. We retrospectively reviewed 427 patients aged >45 years who underwent polysomnography and abdominal computed tomography from November 2008 to February 2012. Aortic diameters were measured at 3 locations: upper, infrarenal, and lower abdominal aorta. OSA was defined as non-OSA (apnea-hypopnea index [AHI] <10, n = 58), mild to moderate (AHI 10 to 30, n = 167), and severe (AHI ≥30, n = 202). Adjusted diameter was not significantly different among OSA severity categories at the upper (21.0, 21.3, and 21.4 mm, respectively) and infrarenal aorta (19.5, 20.2, and 19.9 mm, respectively) but was significantly different at the lower abdominal aorta (17.3, 18.2, and 18.2 mm, respectively, p = 0.006) with larger diameters in patients with OSA. Multivariate linear regression analyses revealed that risk profiles for aortic dilatation varied according to the location and gender and that OSA (AHI ≥10) was an independent risk factor for infrarenal and lower abdominal aortic dilatation only in men (β = 0.10 and 0.18, p = 0.049 and 0.001, respectively). In conclusion, OSA may enhance dilatation of the distal abdominal aorta in men.
An abdominal aortic aneurysm (AAA) is a focal dilatation of the abdominal aorta, 90% of which develops in the infrarenal aorta. Importantly, the diameter of the infrarenal aorta has significance beyond its use for diagnosing an AAA: an increased infrarenal aortic diameter is a risk factor for future AAA formation and cardiovascular events. Major risk factors for infrarenal aortic dilatation are similar to those for AAAs, including older age, male gender, body habitus (height, weight, body mass index, and body surface area [BSA]), and smoking. Although obesity may be a risk factor for both infrarenal aortic dilatation and AAAs, there have been no reports on the impact of obstructive sleep apnea (OSA), a highly prevalent co-morbidity of obesity, on the abdominal aortic diameter except for 1 recent study showing that severe OSA may enhance AAA expansion. We sought to explore the relation between OSA and abdominal aortic diameters to examine the hypothesis that OSA is an independent risk factor for aortic dilatation even in a preaneurysmatic state.
Methods
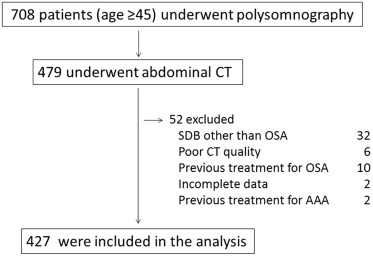
This was a retrospective cross-sectional study. From November 2008 to February 2012, a total of 708 consecutive patients aged 45 years who underwent polysomnography at our institute were routinely asked to have abdominal computed tomography (CT) for the evaluation of visceral fat accumulation. Of these, 229 patients declined to have CT and 52 were excluded because of having sleep-disordered breathing other than OSA (n = 32), poor CT quality (n = 6), previous treatment for OSA (n = 10), insufficient data (n = 2), or previous treatment for AAA (n = 2). We retrospectively analyzed data on the remaining 427 patients ( Figure 1 ). This study was approved by the Kyoto University Graduate School and Faculty of Medicine Ethics Committee (E1991).
All participants underwent abdominal non–contrast-enhanced CT covering the level of the aortoiliac bifurcation using a 64-slice multidetector CT scanner (Aquilion 64; Toshiba, Tokyo, Japan). All images were reviewed by 1 examiner using picture archiving and communication system viewing station (Centricity Enterprise Web, version 3.0; GE Healthcare, Buckinghamshire, United Kingdom). Abdominal aortic diameters were measured on axial CT slices with a 7-mm slice thickness at 3 locations: just inferior to the supramesenteric artery (upper abdominal aorta), maximum diameter below the renal arteries (infrarenal aorta), and just superior to the common iliac bifurcation (lower abdominal aorta). At each of the 3 locations, external aortic diameters were manually measured in the anteroposterior and transverse planes, and the average of the 2 values was calculated. The intraclass correlation coefficient for the average diameters of the 3 locations from 50 random subset samples was >0.97 (range 0.97 to 0.99), and the percentage differences were 2.7%, 2.9%, and 2.5%, respectively.
The diagnosis of OSA was confirmed by overnight polysomnography (SomnoStar pro; Cardinal Health, Dublin, Ohio or Alice 4; Philips Respironics, Inc, Murrysville, Pennsylvania) as previously described. Apnea was defined as the continuous cessation of airflow for >10 seconds, and hypopnea was defined as a reduction in airflow of ≥50% lasting for ≥10 seconds accompanied by a decrease in SpO 2 of at least 3% or arousal. Apnea-hypopnea index (AHI) values were calculated as the number of episodes of apnea and hypopnea per hour over the total sleep time. OSA severity was defined by AHI as follows: non-OSA (AHI <10), mild-to-moderate OSA (AHI 10 to 30), and severe OSA (30 ≤ AHI).
Hypertension was defined as (1) the current use of antihypertensive drugs with a previous diagnosis of hypertension or (2) systolic blood pressure ≥140 mm Hg or diastolic blood pressure ≥90 mm Hg. Blood pressure was decided based on the average of the last 2 of 5 measurements after the patients rested a few minutes in a sitting position. Dyslipidemia was defined as (1) current use of lipid-lowering drugs with a previous diagnosis of dyslipidemia or (2) low-density lipoprotein cholesterol ≥140 mg/dl, high-density lipoprotein cholesterol <40 mg/dl, or triglyceride ≥150 mg/dl. Diabetes was defined as (1) a previous diagnosis of diabetes or (2) fasting plasma glucose ≥126 mg/dl and HbA1c ≥6.5%. Body mass index was calculated as weight (kilogram) divided by the square of height (meter). BSA was calculated by the formula, BSA = (weight [kg] 0.425 × height [cm] 0.725) × 0.007184.
All statistical analyses were performed using JMP 7.0.2 software (SAS Institute Inc, Cary, North Carolina). All values are expressed as mean ± SD unless otherwise stated. The overall significance of an intergroup difference was determined by an analysis of variance, the Welch test, or Kruskal-Wallis test as appropriate for the continuous variables. Post hoc pairwise comparisons between groups were performed by the Tukey-Kramer method or the Wilcoxon rank-sum test. For categorical variables, the significance of an intergroup difference was determined using the chi-square test. Adjusted mean (SE) values of abdominal aortic diameters across OSA severity groups were estimated by analysis of covariance. Pearson correlation analyses or the Spearman rank test was used to evaluate the bivariate relation. To test our hypothesis that OSA was an independent risk factor for abdominal aortic dilatation, we performed multivariate linear regression analyses, including traditional risk factors for abdominal aortic dilatation and atherosclerosis (age, gender, BSA, smoking, hypertension, dyslipidemia, diabetes mellitus, and use of statins) and the presence of OSA (AHI ≥10) in the model. A 2-sided p value <0.05 was considered to be statistically significant for all tests.
Results
Baseline characteristics of study participants are summarized in Table 1 . Participants with an elevated AHI were more likely to be men, to have a greater body mass index and BSA, to have hypertension, and to use antihypertensive drugs. Male participants were more likely to have a history of smoking and coronary artery disease and to have greater values for BSA, smoking amount, diastolic pressure, AHI, time of SpO 2 <90%, and arousal index compared with female participants ( Supplementary Table 1 ).
| Variable | Obstructive Sleep Apnea | |||
|---|---|---|---|---|
| None (n = 58) | Mild/Moderate (n = 167) | Severe (n = 202) | p Value | |
| Age (years) | 63.1 ± 9.4 | 63.5 ± 9.4 | 63.1 ± 9.6 | N.S. |
| Men | 28 (48%) | 105 (63%) | 160 (79%) | <0.0001 |
| Body mass index (kg/m 2 ) | 23.5 ± 4.3 | 25.6 ± 4.4 ∗ | 27.4 ± 4.7 † | <0.0001 |
| Body surface area (m 2 ) | 1.62 ± 0.18 | 1.73 ± 0.20 ∗ | 1.80 ± 0.20 † | <0.0001 |
| Smoker | ||||
| Current | 6 (10%) | 18 (11%) | 28 (14%) | |
| Past | 21 (36%) | 72 (43%) | 99 (49%) | N.S. |
| Never | 31 (54%) | 77 (46%) | 75 (37%) | |
| Smoking (pack-years) | 15.9 ± 26.7 | 21.0 ± 30.4 | 22.8 ± 29.4 | N.S. |
| Hypertension | 21 (36%) | 106 (64%) | 128 (63%) | 0.0005 |
| Systolic blood pressure (mm Hg) | 123 ± 15 | 123 ± 16 | 127 ± 17 | 0.05 |
| Diastolic blood pressure (mm Hg) | 75 ± 10 | 74 ± 11 | 78 ± 12 ‡ | 0.01 |
| Antihypertensive drugs | 17 (29%) | 96 (58%) | 114 (56%) | 0.0004 |
| Dyslipidemia | 34 (59%) | 122 (73%) | 141 (70%) | N.S. |
| Statins | 20 (35%) | 68 (41%) | 66 (33%) | N.S. |
| Diabetes mellitus | 13 (22%) | 43 (26%) | 56 (28%) | N.S. |
| Coronary artery disease | 8 (14%) | 27 (16%) | 35 (17%) | N.S. |
| Epworth sleepiness scale | 8.1 ± 5.0 | 7.9 ± 4.8 | 8.6 ± 5.8 | N.S. |
| Apnea-hypopnea index (events/h) § | 6.0 ± 2.6 | 20.9 ± 5.7 | 48.7 ± 15.4 | <0.0001 ¶ |
| Lowest SpO 2 (%) § | 88.6 ± 4.8 | 80.7 ± 10.4 | 76.0 ± 9.5 | <0.0001 ¶ |
| Mean SpO 2 (%) § | 96.0 ± 1.8 | 94.6 ± 2.0 | 92.1 ± 3.6 | <0.0001 ¶ |
| Time of SpO 2 <90% (%) § | 0.9 ± 2.4 | 7.7 ± 13.3 | 29.4 ± 28.3 | <0.0001 ¶ |
| Arousal index (events/h) § | 16.7 ± 6.4 | 21.3 ± 9.3 ‖ | 36.1 ± 17.7 ∗∗ | <0.0001 |
† p <0.0001 versus non-OSA; p <0.001 versus mild-to-moderate OSA.
‡ p <0.05 versus mild-to-moderate OSA.
§ The Kruskal-Wallis test was used to determine overall differences among groups.
¶ p <0.0001 among all comparisons.
The adjusted abdominal aortic diameter was greater in participants with OSA (AHI ≥10) compared with those without OSA only at the lower abdominal aorta and was not significantly different among OSA severity groups at the upper and infrarenal aortas ( Figure 2 and Supplementary Table 2 ). When stratified by gender, adjusted diameters differed significantly only at the lower abdominal aorta in men between participants with OSA and those without OSA ( Figure 2 and Supplementary Table 2 ).
The relations between abdominal aortic diameters and other variables examined are listed in Table 2 . The upper, infrarenal, and lower abdominal diameters were positively correlated with age, male gender, BSA, smoking, and hypertension. Positive correlations were also noted for aortic diameters with the AHI, oxygen desaturation index, and arousal index, and inverse correlations were noted with the lowest SpO 2 .
| Variable | Abdominal Aortic Diameter | ||
|---|---|---|---|
| Upper | Infrarenal | Lower | |
| Age † (years) | 0.21* | 0.21* | 0.10** |
| Men | 0.40* | 0.48* | 0.45* |
| Body mass index † (kg/m 2 ) | 0.21* | 0.12** | 0.19* |
| Body surface area † (m 2 ) | 0.43* | 0.35* | 0.44* |
| Smoker | 0.35* | 0.40* | 0.34* |
| Hypertension | 0.32* | 0.27* | 0.24* |
| Dyslipidemia | 0.03 | 0.07 | 0.004 |
| Statin | 0.04 | 0.09 | −0.01 |
| Diabetes mellitus | 0.09 | 0.08 | 0.02 |
| Apnea-hypopnea index (events/h) | 0.24* | 0.19* | 0.26* |
| 3% Oxygen desaturation index (events/h) | 0.25* | 0.20* | 0.27* |
| Arousal index (events/h) | 0.29* | 0.26* | 0.24* |
| Lowest SpO 2 (%) | −012** | −0.10** | −0.15*** |
† Correlations between these variables and aortic diameters are presented by Pearson correlation coefficients (r), and the others are presented by Spearman rank correlation coefficient (ρ).
Table 3 lists results of multivariate linear regression analyses for predicting aortic diameters for all participants. Traditional risk factors for abdominal aortic dilatation including age, male gender, BSA, and smoking were independently associated with larger diameters across the 3 locations. Notably, the presence of hypertension was an independent predictor related to the upper and infrarenal aortas, whereas OSA (AHI ≥10) was an independent predictor only related to the lower abdominal aorta (β = 0.13, p = 0.001). When stratified by gender, hypertension was an independent predictor of a larger diameter only for the upper abdominal aorta in both genders, whereas OSA was a significant predictor in relation to the infrarenal and lower abdominal aortas only in men (β = 0.10 and 0.18, p = 0.049 and 0.001, respectively; Supplementary Tables 3 and 4 ).


