Imaging Techniques

Chapter 7 Imaging Techniques


Today, clinicians have two main imaging techniques at their disposal for the investigation of patients with chest disease—plain radiography, which produces a projectional image, and computed tomography (CT), which provides a cross-sectional view. Other techniques, such as magnetic resonance imaging (MRI), radionuclide scanning, and ultrasonography, can provide valuable additional information but are rarely performed without previous chest radiography or CT. Because imaging is an integral part of the practice of respiratory medicine, an understanding of the strengths and weaknesses of these various techniques is vital. The advent of high-resolution and spiral (helical) CT techniques has lent further precision to the clinical investigation of suspected chest disease, but the use of such sophisticated tests should not be indiscriminate; accurate interpretation of the chest radiograph remains the mainstay of thoracic imaging.


Plain Chest Radiography


Technical Considerations


The views of the chest most frequently performed are the erect posteroanterior and lateral projections, taken with the patient’s breath held at total lung capacity. On a frontal (posteroanterior) chest radiograph, just under half of the lung is free from overlying structures, such as the ribs or diaphragm. Many technical factors determine how well the lungs are demonstrated. The characteristics of current digital imaging systems make it possible to adjust the final image and optimize exposure of the least and most dense parts of the chest in a single are image.


Because the coefficients of x-ray absorption for bone and for soft tissue approach one another at high kilovoltage, the skeletal structures do not obscure the lungs on a higher-kilovoltage radiograph to the same degree as on low-kilovoltage radiographs. The high-kilovoltage radiograph thus demonstrates much more of the lung. Improved penetration of the mediastinum also allows some of the central airways to be seen. Although high-kilovoltage radiographs are preferable for routine examinations of the lungs and mediastinum, low-kilovoltage radiographs provide good detail of unobscured lung because of the improved contrast between lung vessels and surrounding lung. Furthermore, dense lesions—for example, calcified pleural plaques—are particularly well demonstrated on low-kilovoltage films.


The past decade has seen a major change in plain film radiography with the development of digital imaging systems, which are now ubiquitous in modern radiology departments. Digital chest radiography, yielding images either stored on a phosphor plate and then digitally scanned or captured directly onto a detector plate, has been combined with computer-based picture archiving and communications systems (PACSs) for distribution of images around the hospital or over wider networks. The much wider latitude of digital systems also allows the image to be “postprocessed” to provide optimum visualization of the relevant structures


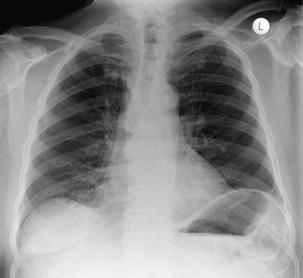
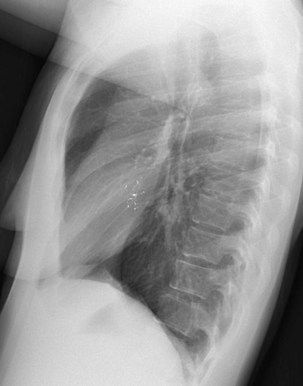
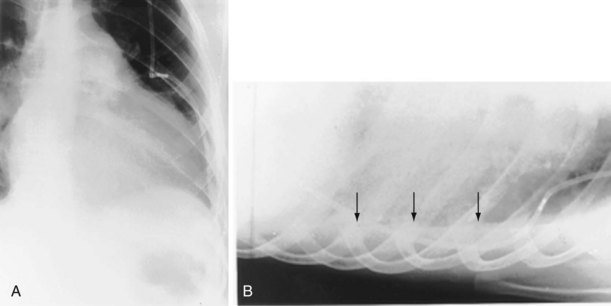
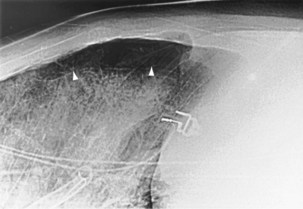
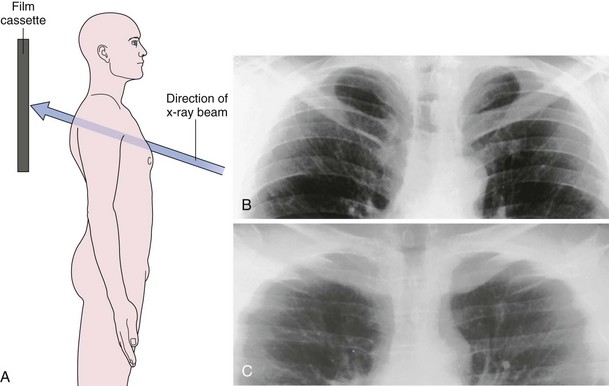
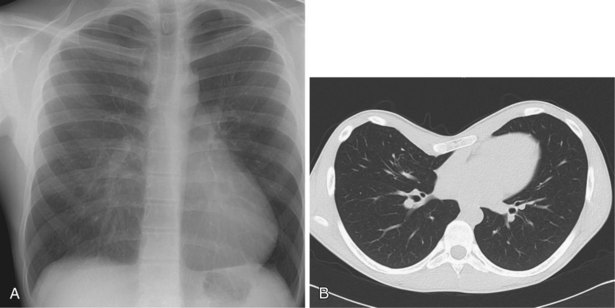
The frontal (posteroanterior) (Figure 7-1) and lateral (Figure 7-2) projections are sufficient for most purposes in chest radiography. Other radiographic views are less frequently required, but they should not be overlooked because they may solve a particular problem quickly and cheaply. The lateral decubitus view is not, as its name implies, a lateral view. It is a frontal view taken with use of a horizontal beam and the patient in a side-lying position. Its main purpose is to demonstrate the movement of fluid in the pleural space (Figure 7-3). An adaptation of this view is the “lateral shoot-through” sometimes used in bed-bound patients: A lateral radiograph of the supine patient is taken to show an anterior pneumothorax behind the sternum (not always visible on a frontal chest radiograph) (Figure 7-4). If a pleural effusion is not loculated, it gravitates, to some extent, to the dependent part of the pleural cavity. Thus, in a decubitus patient, the fluid will layer between the chest wall and the lung edge. This view also may be useful for demonstrating a small pneumothorax, because the visceral pleural edge of the lung falls away from the chest walls in the nondependent hemithorax.


For the lordotic view, now rarely performed, the x-ray beam is angled 15 degrees cranially, either by positioning the patient upright and directing the beam up or by leaving the beam horizontal and leaning the patient backward. On this view, the lung apices are demonstrated free from the superimposed clavicle and first rib. It may be useful to differentiate pulmonary shadows from incidental calcification of the costochondral junctions (Figure 7-5).


Digital Chest Radiography


The most widely employed systems use conventional radiographic equipment but use a reusable photostimulatable plate instead of conventional film. The reusable phosphor plate is housed in a cassette and stores some of the energy of the incident x ray as a latent image. On scanning the plate with a laser beam, the stored energy is emitted as light that is detected by a photomultiplier and converted into a digital signal. The digital information is then manipulated, displayed, and stored in whatever format is desired. The phosphor plate can be reused once the latent image has been erased by exposure to light. Most currently available computed radiography systems produce a digital radiograph with a resolution of more than 10 line pairs per millimeter. The fundamental requirement to segment the image into a finite number of pixels has resulted in much work to determine the relationship between pixel size, which affects spatial resolution, and the detectability of focal abnormalities. Although it might seem desirable to aim for an image composed of pixels of the smallest possible size, an inverse relationship occurs between pixel size and the cost and speed of data handling. Thus, pixel size is ultimately a compromise between image quality and ease of data processing and storage.


An unequivocal advantage of digital computed radiography over conventional film radiography is the linear photoluminescence-dose response, which is much greater than that of conventional film. This extremely wide latitude coupled with the facility for image processing produces diagnostic images over a wide range of exposures.


Observer performance studies have shown that computed radiography is just as useful as conventional film radiography for virtually any relevant application. However, postprocessing of the digital image has to be used to match the digital radiograph to the specific task. Enhancement of the image for one purpose often degrades it for another but is easily achieved in most PACS reporting systems.


Computed Tomography


The same basic principles that allow film radiography apply with CT—namely, the absorption of x rays by tissues that contain constituents of different atomic number. By use of multiple projections and computed calculations of radiographic density, slight differences in x-ray absorption are displayed as a cross-sectional image. The components of a CT scanner include an x-ray tube that rotates around the patient and an array of x-ray detectors opposite the tube, together contained within the gantry. The patient lies on the examination couch, which moves the patient through the aperture of the CT gantry. The data acquired are then processed by the CT computer, resulting in the final images as displayed on the CT monitor.


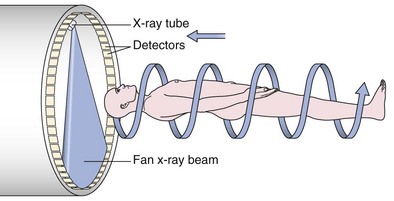
An impressive and rapid improvement in CT hardware capability has occurred over the past decade. Most particularly, the advent of multiple-channel CT scanners has resulted in the ability to acquire simultaneous helical datasets. An accompanying increase in gantry rotation speed coupled with the reduction in the size of the individual detectors has resulted in the ability to acquire extremely detailed images in very short scan times. On the current “top specification” scanners from the major manufacturers, up to 320 channels are available, each with a detector size of as small as 0.5 mm. The entire thorax can now be scanned at submillimeter resolution in 1 to 2 seconds. Thus, spiral (also known as volume or helical) scanning entails continuous scanning and table movement into the CT gantry (Figure 7-6). The information is reconstructed into axial sections, perpendicular to the long axis of the patient, identical to conventional CT sections.


Temporal resolution has been further improved, because data reconstruction algorithms now allow CT images to be generated after a partial rotation of the gantry. Thus, temporal resolution of as little as 65 msec is now possible, enabling modern multichannel CT scanners to acquire cardiac gated images that effectively freeze cardiac motion. This capability in turn can be applied to allow detailed analysis of coronary artery and cardiac anatomy.


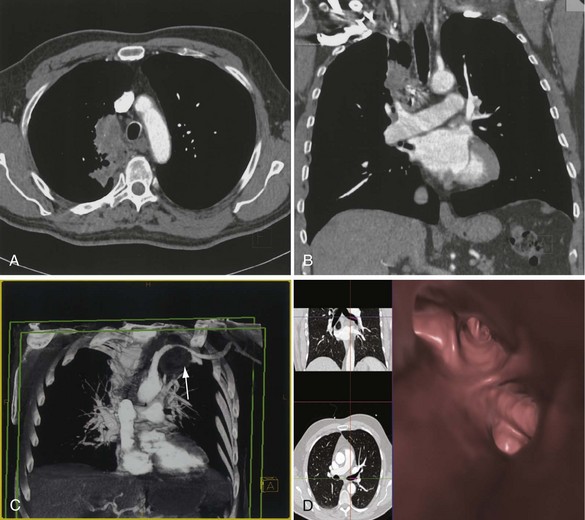
The analysis of what is frequently hundreds of individual images that are produced as the result of a single CT examination is undertaken on dedicated CT or PACS workstations. Postprocessing of these thin sections also allows the production of multiplanar reformats (MPRs), maximum and minimum intensity projections (MIPs and MinIPs), and angiographic images. Skeletal structures can be automatically removed, or surface-rendered images that mimic appearances familiar to the bronchoscopist can be produced with a few mouse clicks. These images are visually pleasing and allow an exquisite appreciation of anatomy. They also have a role in the planning of interventional procedures, including transbronchial needle biopsy and endoluminal stent insertion (Figure 7-7).


Section Thickness


Although a CT section is viewed as a two-dimensional image, it has a third dimension of depth. The depth, or section thickness, is determined by a combination of factors, depending on the exact parameters utilized, including focal spot size, thickness of the individual detector elements, and width of the x-ray beam collimation. Because a section has a predetermined thickness, each pixel has a volume and this three-dimensional element is referred to as a voxel. The computer calculates the average radiographic density of tissue within each voxel, and the final CT image consists of a representation of the numerous voxels (not individually visible without magnification) in the section. The single attenuation value of a voxel represents the average of the attenuation values of all of the various structures within the voxel. The thicker the section, the greater the chance that different structures will be included within the voxel and the greater the signal averaging that occurs. This is known as the partial volume effect; the easiest way to reduce this effect is to use thinner sections (Figure 7-8).


When the entire chest is examined, contiguous thin sections are reconstructed for analysis. If the study is undertaken on a multichannel system, the dataset may be reconstructed at thinner intervals predetermined by the thickness of the detector rows, and these thinner sections may be used for reporting or multiplanar reconstructions. Thinner sections also are used to study fine detail and complex areas of anatomy, such as the aortopulmonary window and subcarinal regions. Another specific example for which narrow sections may be useful is to display differential densities (which would otherwise be lost because of the partial volume effect) of the small foci of fat or calcium that are sometimes seen within a hamartoma.


If exposure factors are otherwise kept the same, the total patient radiation dose varies very little between different multichannel systems. Of note, however, a striking difference in the radiation dose to the patient is associated with use of contiguous sections versus interspaced fine sections. Thus, the effective dose to the patient with interspaced fine sections (e.g., 1 or 2 mm) every 10 mm, such as used for high-resolution CT of the lung parenchyma, is 5 to 10 times less than that imposed by single-channel or multichannel spiral CT of the entire chest volume. The disadvantage of interspaced sections is the inability to view the data in any plane, but for the purposes of assessment of the lung interstitium, this added refinement usually is not of sufficient added diagnostic value to warrant the increased radiation burden. This consideration is especially important in the relatively younger patient.


Window Settings


The average density of each voxel is measured in Hounsfield units (H); these units have been arbitrarily chosen so that zero is water density and −1000 is air density. The span of Hounsfield units reflecting density in the thorax is wider than in any other part of the body, ranging from that for aerated lung (approximately −800 H) to that for ribs (+700 H). Two variables are used that allow the operator to select the range of densities to be viewed—window width and window center (or level).


The window width determines the number of Hounsfield units to be displayed. Any densities greater than the upper limit of the window width are displayed as white, and any below the limit of the window are displayed as black. Between these two limits, the densities are displayed in shades of gray. The median density of the window chosen is the window center or level; this center can be moved higher or lower as desired, thus moving the window up or down through the range. The narrower the window width, the greater the contrast discrimination within the window. No single window setting can depict the wide range of densities encountered in the chest on a single image. For this reason, at least two sets of images are required to demonstrate the lung parenchyma and soft tissues of the mediastinum, respectively (Figure 7-9). Standard window widths and centers for thoracic CT vary between departments, but generally for the soft tissues of the mediastinum, a window width of 400 to 600 H and a center of +30 H is appropriate. For the lungs, a wide window of 1500 H and a center of approximately −500 H are usually satisfactory. For bones, the widest possible window setting at a center of +30 H is best.


Window settings have a profound influence on the size and conspicuity of normal and abnormal structures. Nonetheless, it is impossible to prescribe precise window settings because of the element of observer preference and also differences between machines. The most accurate representation of an object seems to be achieved if the value of the window level is halfway between the density of the structure to be measured and the density of the surrounding tissue. For example, the diameter of a pulmonary nodule, measured on soft tissue settings appropriate for the mediastinum, will be grossly underestimated. When inappropriate window settings are used, imaging of smaller structures (e.g., peripheral pulmonary vessels) will be affected proportionately much more than that of larger structures.


Intravenous Contrast Enhancement


Intravenous contrast enhancement is needed only in specific instances, because of the high contrast on CT between vessels and surrounding air in the lung and between vessels and surrounding fat within the mediastinum. One such instance is to aid the distinction between hilar vessels and a soft tissue mass. The exact timing of the injection of contrast material depends most on the time the CT scanner takes to scan the thorax. With multichannel CT scanners, the circulation time specific for the patient becomes an important factor.


Contrast medium rapidly diffuses out of the vascular space into the extravascular space, so that opacification of the vasculature after a bolus injection with a “power injector” quickly declines, and structures such as lymph nodes steadily increase in density over time. Such dynamics result in a point at which a solid structure may have exactly the same density as an adjacent vessel. The timing and duration of the contrast medium infusion must therefore be taken into account in interpreting images obtained in a contrast-enhanced CT study. Rapid scanning protocols with automated injectors tend to improve contrast enhancement of vascular structures at the expense of enhancement of solid lesions because of the rapidity of scanning. With spiral CT, it is possible to achieve good opacification of all of the thoracic vascular structures by using small volumes of contrast material. Optimal contrast enhancement is a prerequisite for the diagnosis of pulmonary embolism or aortic and great vessel abnormalities. To achieve optimal contrast enhancement, many CT systems now use an automated triggering system. Thus, in examining the pulmonary arteries, a low-dose repeating scan will monitor the density in the pulmonary outflow tract once every second. When a predetermined density threshold is reached as a result of the arrival of intravenous contrast, the preplanned examination is triggered. The couch rapidly moves the patient from the monitoring position to the start position, a prerecorded breath-hold instruction is given to the patient over a loudspeaker, and the data acquisition commences. The acquisition is timed to correspond with appropriate enhancement of anatomic structures if contrast has been administered.


For examining inflammatory lesions, such as the reaction around an empyema, it may be necessary to delay scanning by 30 seconds, to allow contrast to diffuse into the extravascular space. For examining the liver and adrenals in evaluation of a patient with suspected lung cancer, the optimal phase of contrast enhancement to maximize the conspicuity of hepatic metastases is during the portal venous phase of contrast enhancement, and this occurs 60 to 80 seconds after contrast injection.


High-Resolution Computed Tomography


Technical Considerations


Over the past two decades, the development of high-resolution computed tomography (HRCT) has had great impact on the approach to the imaging of diffuse interstitial lung disease and bronchiectasis. Images of the lung produced by HRCT correlate closely with the macroscopic appearance of pathologic specimens, so in the context of diffuse lung disease, HRCT represents a substantial improvement over chest radiography. Three factors associated with significantly improved spatial resolution of CT—hence the designation “high-resolution”—are narrow beam collimation, use of a high-spatial-frequency reconstruction algorithm, and a small field of view.


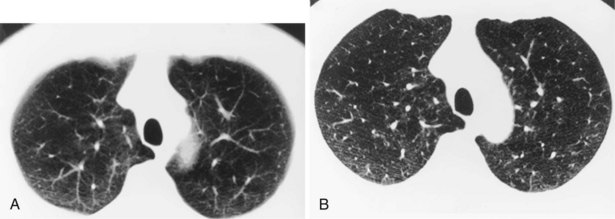
Narrow collimation of the x-ray beam reduces volume averaging within the section and so increases spatial resolution compared with standard 10-mm collimation. For routine HRCT scanning, 1.50-mm beam collimation generally is regarded as optimal. Narrow collimation has a marked effect on the appearance of the lungs, notably the vessels and bronchi—the branching vascular pattern seen particularly in the midzones on standard 10-mm sections has a more nodular appearance with narrow sections, because shorter segments of the obliquely running vessels are included in the section. In addition, parenchymal details become more clearly visualized (Figure 7-10).


In HRCT lung imaging, a high-spatial-frequency algorithm is used to take advantage of the inherently high-contrast environment of the lung. The high-spatial-frequency algorithm (also known as the edge-enhancing, sharp, or formerly “bone” algorithm) reduces image smoothing and makes structures visibly sharper but at the same time makes image noise more obvious (see Figure 7-10).


Several artifacts are consistently identified on HRCT images, but they do not usually degrade the diagnostic content of the images. Nevertheless, it is useful to be able to recognize the more common ones. Probably the most frequently encountered is a streaking appearance, which arises from patient motion. Cardiac motion sometimes causes movement of the adjacent lung with consequent degradation of image quality. Some CT scanners are able to eliminate this artifact by triggering the acquisition of the slice from the electrocardiogram (ECG) tracing so that the data are collected during diastole, when cardiac motion is minimized. To optimize this technique, the scanner must have a short rotation time and also be capable of formatting a CT image from data from a partial rotation. This reduces the data acquisition time window to as little as 360 msec.


The size of the patient has a direct effect on the quality of the lung image—the larger the patient, the more conspicuous the noise, which is seen as granular streaks because of increased x-ray absorption by the patient. This artifact is particularly evident in the posterior lung adjacent to the vertebral column. The phenomenon of aliasing results in a fine, streaklike pattern radiating from sharp, high-contrast interfaces. The severity of the aliasing artifact is related to the geometry of the CT scanner, and, unlike quantum mottle, aliasing is independent of the radiation dose. These artifacts are exaggerated by the nonsmoothing, high spatial-resolution reconstruction algorithm but do not mimic normal anatomic structures and are rarely severe enough to obscure important detail in the lung parenchyma (Figure 7-11).


The degree to which HRCT samples the lung depends primarily on the spacing between the thin sections. An HRCT examination also may vary in terms of the number of sections, the position of the patient, the phase in which respiration is suspended, the window settings at which the images are displayed, and the manipulation of the image by postprocessing. No single protocol can be recommended to cover every eventuality. However, the simplest protocol entails 1.5-mm collimation sections at 20-mm intervals from apex to lung bases. Any given scanning protocol may need to be modified—a patient referred with unexplained hemoptysis ideally is scanned with contiguous standard sections through the major airways (to show a small endobronchial abnormality) and interspaced narrow sections through the remainder of the lungs (to identify bronchiectasis).


When early interstitial disease is suspected, for example, in asbestos-exposed persons in whom the chest radiograph is normal in appearance, HRCT scans often are performed with the patient in the prone position, to prevent any confusion with the increased opacification seen in the dependent posterior basal segments in many normal subjects scanned in the usual supine position. The increased density seen in the posterior dependent lung with supine positioning disappears in normal persons when the scan is repeated at the same level with prone positioning. No advantage is gained by scanning a patient in the prone position if no obvious diffuse lung disease is found on a contemporary chest radiograph.


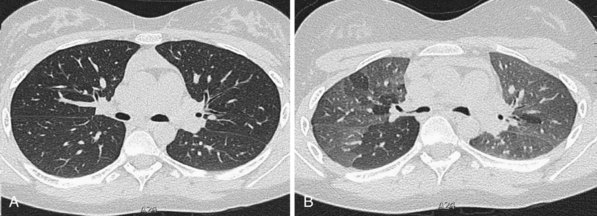
A limited number of scans taken at end expiration can reveal evidence of air trapping caused by small airway disease, which may not be detectable on routine inspiratory scans. Areas of air trapping range from a single secondary pulmonary lobule to a cluster of lobules that give a patchwork appearance of low attenuation areas adjacent to higher attenuation, normal lung parenchyma (Figure 7-12).


Alterations of the window settings of HRCT images sometimes make detection of parenchymal abnormalities impossible when there is a subtle increase or decrease in attenuation of the lung parenchyma. Uniformity of window settings from patient to patient aids consistent interpretation of the lung images. In general, a window level of −500 to −800 HU and a width of between 900 and 1500 HU are usually satisfactory. Modification of the window settings for particular tasks is often desirable; for example, in looking for pleuroparenchymal abnormalities in asbestos-exposed patients, a wider window of up to 2000 HU may be useful. Conversely, a narrower window of approximately 600 HU may emphasize the subtle density differences that characterize emphysema and small airway disease.


The relatively high radiation dose to the patient inherent in all CT scanning needs to be appreciated. The radiation burden to the patient is considerably less with HRCT than with conventional CT scanning. It has been estimated that the mean radiation dose delivered to the skin with HRCT by use of 1.5-mm sections at 20-mm intervals is 6% that of conventional 10-mm contiguous scanning protocols. A further method of reducing the radiation burden to the patient is to decrease the milliamperage; it is possible to reduce the milliamperage by up to 10-fold and still obtain comparably diagnostic images. Although continuous refinement in CT technology is reducing the radiation burden to patients, CT still delivers a relatively high radiation dose to patients, so this imaging modality must not be used indiscriminately.


Clinical Applications of High-Resolution Computed Tomography


Increasingly, HRCT is used to confirm or refute the impression of an abnormality seen on a chest radiograph. It may also be used to achieve a histospecific diagnosis in some patients who have obvious, but nonspecific, radiographic abnormalities.


It probably is impossible to determine the frequency with which HRCT will show significant parenchymal abnormalities when the chest radiograph appears normal. Studies of individual diseases show that HRCT demonstrates abnormalities despite normal chest radiographs in 29% of patients with systemic sclerosis and in up to 30% of those with asbestosis. For hypersensitivity pneumonitis, the proportion may be even higher. As indicated by the average sensitivity results of several studies, HRCT seems to have a sensitivity of approximately 94%, compared with 80% for chest radiography; this increased sensitivity does not seem to be achieved at the expense of decreased specificity.


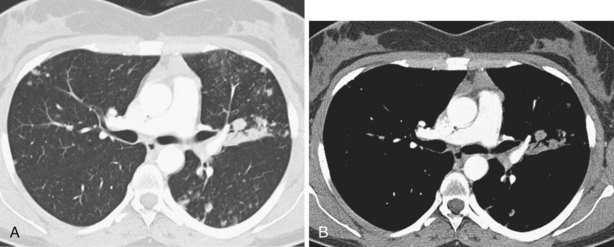
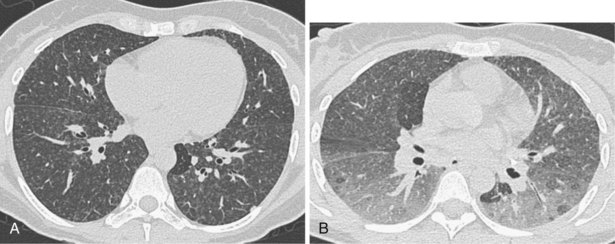
In patients with clinical and lung function evidence of diffuse lung disease, HRCT is now central in the diagnostic workup, with clinical performance greatly exceeding that of plain chest radiography and may obviate the need for lung biopsy. In the original study that compared the diagnostic accuracy of chest radiography and CT in the prediction of specific histologic diagnosis in patients with diffuse lung disease, Mathieson and associates showed that three observers could make a confident diagnosis in 23% of cases on the basis of chest radiographs and in 49% of cases with use of CT; the correct diagnosis was made in 77% and 93% of these readings, respectively (Figure 7-13).


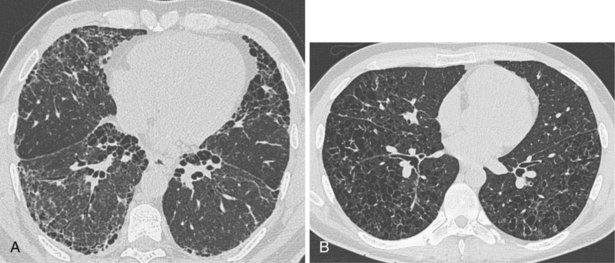
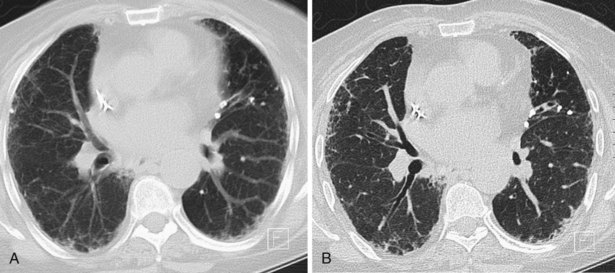
A number of subsequent early HRCT studies acted as the forerunners of a large body of work that has established HRCT as a cornerstone in the assessment of patients suspected of having diffuse lung disease but for whom the clinical features and appearance on the chest radiograph do not allow a confident diagnosis to be made. A number of diffuse lung diseases can have a “diagnostic” appearance on HRCT when findings are interpreted by experienced chest radiologists; such diseases include fibrosing alveolitis, sarcoidosis, Langerhans cell histiocytosis, lymphangioleiomyomatosis, pneumoconiosis, and hypersensitivity pneumonitis (Figure 7-14). An intriguing observation is that the ability of HRCT to allow observers to provide correct histospecific diagnoses seems to be maintained in advanced end-stage disease.


However, HRCT is sometimes used indiscriminately for patients in whom the high certainty of diagnosis from clinical and radiographic findings does not justify the extra cost and radiation burden. No evidence shows that an HRCT examination adds anything of diagnostic value for a patient who has progressive shortness of breath, finger clubbing, crackles at the lung bases, and the typical radiographic pattern and lung function profile of fibrosing alveolitis. Nevertheless, the ability of HRCT to characterize disease, and often to deliver a definite and correct diagnosis in patients with nonspecific radiographic shadowing, frequently is helpful.


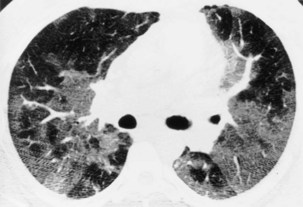
Much interest has been shown in defining the role of HRCT in staging disease activity, particularly for fibrosing alveolitis, in which cellular histology indicates disease activity and is used to predict both responses to treatment and prognosis. As shown by more recent evidence, a predominance of ground glass opacification in fibrosing alveolitis predicts a good response to treatment and increased actuarial survival compared with patients with a more reticular pattern, which denotes established fibrosis. Similar observations about the potential reversibility of disease can be made with use of HRCT in patients who have sarcoidosis, in whom a ground glass or a nodular pattern predominates. In other conditions, the identification of ground glass opacification on HRCT, although nonspecific, almost invariably indicates a potentially reversible disease—for example, extrinsic allergic alveolitis, diffuse pulmonary hemorrhage, and Pneumocystis jiroveci pneumonia (Box 7-1). An important exception is bronchoalveolar cell carcinoma, in which areas of ground glass opacification that merge into areas of frank consolidation or a more nodular pattern may be seen. Another caveat applies with the situation in which fine, intralobular fibrosis is seen on HRCT as widespread ground glass opacification; in this rare occurrence, evidence of traction bronchiectasis usually is present within the areas of ground-glass opacification.


The ability of CT to discriminate among various patterns of disease has clarified the basis for the sometimes complex mixed obstructive and restrictive functional deficits found in some diffuse lung diseases. A good example is hypersensitivity pneumonitis, in which both interstitial and small airway disease coexist; patterns caused by these different pathologic processes can be readily appreciated on HRCT. The extent of the various HRCT patterns correlates with the expected functional indices of restriction and obstruction, respectively. Other conditions in which CT is able to tease out the morphologic abnormalities responsible for complex functional deficits include fibrosing alveolitis with coexisting emphysema and sarcoidosis associated with a combination of interstitial fibrosis and small airway obstruction by peribronchiolar granulomata.


In patients for whom lung biopsy is deemed necessary, HRCT may be invaluable to indicate which type of biopsy procedure is likely to be successful in obtaining diagnostic material. The broad distinction between peripheral disease versus central and bronchocentric disease is easily made on HRCT. Thus, disease with a subpleural distribution, such as fibrosing alveolitis, is most unlikely to be sampled by transbronchial biopsy, whereas diseases with a bronchocentric distribution on HRCT, such as sarcoidosis and lymphangitis carcinomatosa, are consistently accessible to transbronchial biopsy. In patients for whom an open or thoracoscopic lung biopsy is contemplated, HRCT assists in determining the optimal biopsy site. Pathologic examination of a lung biopsy specimen can still justifiably be regarded as the final arbiter of the presence or absence of subtle interstitial lung disease. Because HRCT images provide a kind of “in vivo big picture,” many lung pathologists now combine the imaging and pathologic information before assigning a final diagnosis, and in many centers, the benefits of a team approach to the diagnosis of diffuse lung disease are recognized. The indications for HRCT that have been developed over the past 20 years are summarized in Box 7-2.


Magnetic Resonance Imaging


Plain radiography, CT, ultrasound imaging, contrast angiography, and isotope scanning constitute the mainstays of thoracic disease imaging. Although magnetic resonance imaging (MRI) has developed a role complementary to these techniques, it generally is considered a problem-solving tool rather than a technique of first choice.


MRI entails placing the subject in a very strong magnetic field (typically 0.2 to 1.5 tesla) and then irradiating the area under examination with pulses of radiowaves. Anatomic MRI depends on the presence of water within tissue to produce the signal required for interpretation. Protons within this water exist within different local atomic environments and, consequently, have different properties. These differences, measured as magnetic resonance, can be exploited by sequence manipulation to generate differences in contrast between tissues in the final image. Thus, the frequency of the radiofrequency pulse transmitted into the patient is carefully selected so that it causes hydrogen protons within water to be disturbed from the orientation that they have assumed as a result of being placed inside the powerful magnetic field within the bore of the magnet. After the transient disturbance caused by the radiofrequency pulse, these protons, which are acting akin to small bar magnets, relax back into their original resting position. As they do this, they release energy as a further pulse of radio waves, which are detected by the receiver coils located in the wall of the bore of the magnetic coil or, more commonly, in a variety of receiver coils placed more directly around the area under investigation. These coils frequently are known by the body part they have been designed to examine—thus, a knee, head, neck, or body coil is placed appropriately at the start of the examination. In the case of thoracic imaging, the body coil usually consists of a pair of coil mats placed in front of and behind the patient.


Historically, the main strengths of MRI are the high intrinsic soft tissue contrast generated, the lack of artifact from bone, the absence of exposure to ionizing radiation, and the ability to produce images in any chosen plane. The major weaknesses of MRI in the thorax have, until recently, been its susceptibility to image degradation secondary to respiratory and cardiac motion, as well as the relatively long times required to perform an examination. In general, the quality of MR images is related to the field strength of the scanner and the peak power and speed of the amplifiers that generate the interrogating radiofrequency pulses.


For thoracic imaging, ECG-triggering facilities, whereby the acquisition of imaging data can be coordinated with the cardiac cycle to reduce flow artifact, are essential. Various methods of compensation for respiratory motion have been developed. Some approaches use external devices such as respiratory bellows, which detect movement of the chest wall, with data collection occurring when motion is at its least. Other methods are essentially software developments that compensate for respiratory disruption of magnetic spins. Most of these techniques have been superseded on modern scanners by the ability to acquire images of the thorax with use of breath-hold techniques.


Mediastinal and Chest Wall Imaging


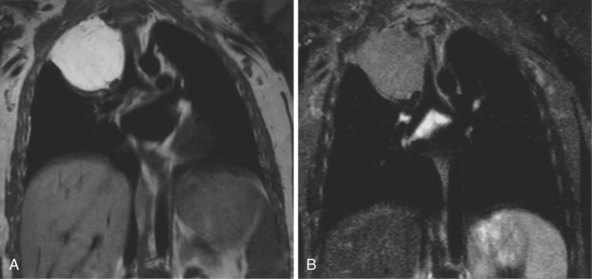
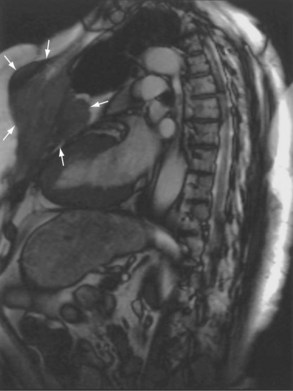
The most common indications for the use of MRI in respiratory disease are for investigation of neoplastic disease, most commonly bronchogenic carcinoma. In addition to the primary disease, secondary complications such as cerebral secondaries, spinal metastases, and retroperitoneal fibrosis all lend themselves to evaluation by MRI. MRI also permits assessment for invasion of mediastinal structures such as the major airways, heart and great vessels, chest wall, and diaphragm and allows differentiation among different forms of soft tissue, fluid, hemorrhage, local hematoma formation, and aneurysms (Figures 7-15 and 7-16). With modern multichannel CT techniques, MRI now holds relatively little advantage over CT in assessing chest wall invasion, except with superior sulcus tumors. However, MRI does provide superb anatomic detail without subjecting the patient to radiation exposure—an important consideration in the pediatric age group, in which a number of follow-up studies may be required (Figure 7-17). The disadvantage of MRI in the very young child is the necessity for general anesthesia in many cases.


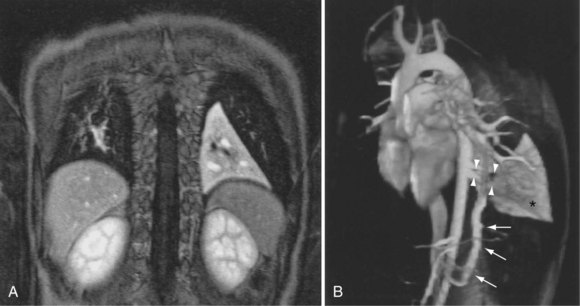
Magnetic Resonance Angiography


Magnetic resonance also can be used to demonstrate vascular anatomy by differential visualization of flowing blood and stationary tissue; this may be achieved with or without intravenous MRI contrast agents. Generally, the use of contrast increases the signal returned from blood, increases the signal-to-noise ratio, and allows acquisition times to be shorter. This modality, known as magnetic resonance angiography (MRA), can be used to look at venous or arterial flow, together or separately (see Figure 7-17).


The contrast agents used in MRI generally and MRA in particular are based almost exclusively on gadolinium chelates. Most such agents are sequestered in the extracellular spaces; they cause shortening of the T1 relaxation time and thus increase the signal from the enhanced tissue on T1-weighted sequences. The distribution of these agents is very similar to that of the iodinated contrast agents used routinely in CT.


Pulmonary Angiography


Pulmonary angiography is used to investigate pulmonary circulation when other, less invasive, methods have failed to provide the requisite information. The most frequent indication is for suspected pulmonary embolism, often after ventilation-perfusion scanning. In the acute assessment of pulmonary embolism, the angiogram is undertaken within 24 hours of clinical presentation. However, a delay of 48 to 72 hours should not preclude the use of pulmonary angiography, although the diagnostic yield progressively declines because of fragmentation of thrombi over time, especially if anticoagulation has been instituted.


Pulmonary angiography is now rarely used. Apart from the relative expense and invasive nature of angiography, it is perceived to have a high complication rate (although this is not supported by the published evidence), so it has been largely replaced by CT.


The technique of pulmonary angiography involves fluoroscopically directed insertion of a guidewire followed by a modified pigtail catheter into the right and then the left main pulmonary arteries in turn, with injection of a nonionic contrast administered at an appropriate flow rate. At least two views per side are required, with additional oblique or magnification views as necessary. Catheter access usually is through the femoral vein, with use of the internal jugular and subclavian veins as possible alternatives. Most departments undertake angiography with digital subtraction vascular equipment (Figure 7-18). Problems with misregistration artifact, inherent in digital subtraction systems and caused by respiratory or cardiac cycle phase differences between the mask image and the contrast image, usually can be overcome. Crossing the tricuspid valve may induce an arrhythmia that usually is transient. Therefore, electrocardiogram (ECG) monitoring is mandatory, and the use of prophylactic antiarrhythmic agents or temporary pacing-wire insertion is common practice in some centers. Right-sided heart catheter pressure measurements and gas analysis also may be undertaken.


When a pulmonary embolus is present, it most frequently is situated in the posterior segments of the lower lobe. Thrombi beyond the segmental vessel level are detected less reliably than more central thrombi. However, the significance of thrombi confined to subsegmental vessels is unclear. The typical angiographic findings with pulmonary embolism are those of vascular cutoff or, when vascular occlusion is not complete, an intraluminal filling defect with contrast passing around and beyond the clot. Indirect signs of embolism include areas of relatively delayed or reduced perfusion, late filling of the venous circulation, and vessel tortuosity. When the angiogram is performed to investigate suspected chronic thromboembolic disease, vascular changes to look for include local stenosis or thin webs, luminal ectasia, and irregularities of the normal tapering pattern.


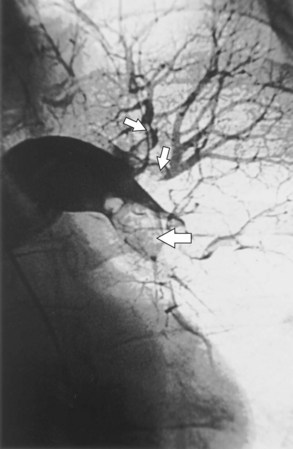
Bronchial Artery Embolization


Bronchial artery embolization usually is performed to treat massive hemoptysis in patients who are unsuitable candidates for surgical management. The most common causes of bronchial artery hypertrophy and consequent hemorrhage are suppurative lung diseases (particularly bronchiectasis) and fibrocavitary disease that involves mycetomas. Less common causes of hemorrhage from the bronchial circulation include bronchial carcinoma, chronic pulmonary abscess, and congenital cyanotic heart disease. No absolute contraindications to bronchial artery embolization are known, although the patient should be hemodynamically stable and able to cooperate.


The most common anatomic arrangement on bronchial arteriography is that of one main right bronchial artery arising from a common intercostobronchial trunk, which comes off the thoracic aorta at approximately the level of T5, and two left bronchial arteries arising more inferiorly. However, bronchial arteries may arise from the thyrocervical trunk, the internal mammary artery, the costocervical trunk, the subclavian artery, a lower intercostal artery, or the inferior phrenic artery or even the abdominal aorta. The right intercostal bronchial trunk takes off from the aorta at an acute upward angle, whereas the left bronchial arteries leave the aorta at more-or-less right angles, and special catheters have been designed to facilitate selective catheterization. Superselective catheterization of the bronchial circulation allows precise delivery of embolic material, thereby preventing spillover into the aorta or inadvertent embolization of the spinal artery.


Fiberoptic bronchoscopy often is advocated before bronchial artery embolization to establish the site of hemorrhage. However, a large-volume hemoptysis almost invariably results in vigorous coughing, thereby spreading blood throughout the bronchial tree, which makes localization impossible. CT angiography also is a useful preliminary investigation, delineating bronchial artery anatomy, guiding intervention, and sometimes localizing the lobe or segment from which the bleeding originates. Few criteria exist to determine which angiographically demonstrated bronchial arteries should be embolized. Guidelines are particularly relevant when several bronchial arteries have been identified and the site of hemorrhage is not obvious from previous thoracic imaging. Embolization is directed at the vessels considered most likely to be the source of hemorrhage (Figure 7-19). Bronchial arteries of diameter greater than 3 mm may be considered to be pathologically enlarged. In patients with diffuse, suppurative lung disease, most commonly cystic fibrosis, attempts are made to embolize all significantly enlarged bronchial arteries bilaterally. If no abnormal bronchial arteries are identified, a systematic search is made for aberrant bronchial arteries. When a patient continues to experience hemoptysis after embolization, all suspicious systemic arteries should be examined for a source of bleeding, and it may be necessary to angiographically investigate the pulmonary circulation for a source of bleeding.


A variety of embolic materials have been used for the embolization of bronchial arteries, ranging from spheres of polyvinyl alcohol in a variety of sizes to small pieces of surgical gel (Gelfoam). Although coils lodged proximally in the bronchial artery have been used, they can prevent subsequent catheterization.


After bronchial artery embolization, many patients experience transient fever and chest pain. Some patients cough up a small amount of blood, which possibly arises from limited infarction of the bronchial mucosa. Serious complications after bronchial artery embolization are rare, the most serious being transverse myelitis, probably caused by contrast toxicity rather than inadvertent embolization. Inadvertent spillover of embolization material into the thoracic aorta may cause distant ischemia in the legs or abdominal organs.


The aim of bronchial artery embolization is the immediate control of life-threatening hemoptysis, which is achieved in more than 75% of patients. Failures usually result from nonidentification of significant bronchial arteries and an inability to maintain the catheter position to allow subsequent embolization. Up to 20% of patients rebleed within 6 months of an initially successful bronchial artery embolization. The reasons cited for recurrent hemorrhage are recanalization of previously embolized vessels, incomplete initial embolization, and hypertrophy of small bronchial arteries not initially embolized. However, bronchial artery embolization usually can be satisfactorily repeated in patients who rebleed.


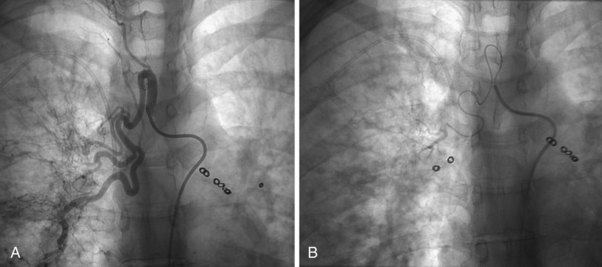
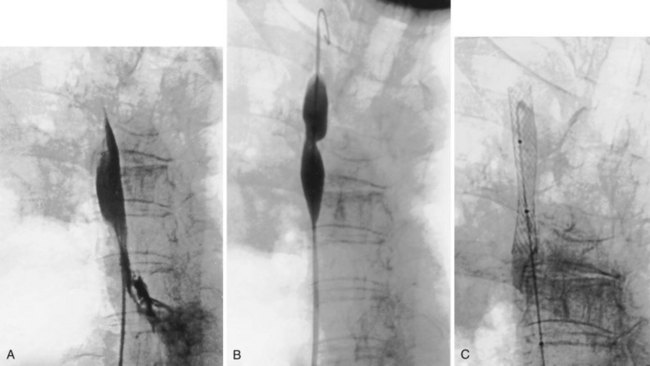
Superior Vena Cava Stenting


Superior vena cava obstruction (SVCO) is characterized by facial and upper limb swelling, headache, and shortness of breath and usually is caused by advanced mediastinal malignancy. Conventional palliative treatment relies on radiotherapy, chemotherapy, and sometimes surgery. Radiotherapy usually produces an initial improvement, although subsequent recurrence of symptoms is frequent. Balloon angioplasty for treatment of both benign and malignant causes of SVCO has been reported, but not surprisingly, symptoms are liable to recur soon after angioplasty alone.


The percutaneous placement of metallic stents for the treatment of SVCO has several attractions. With increasing experience, reliable and successful palliation of SVCO has been reported with use of various stent designs. A superior venacavagram is necessary to identify the length of the stenosis and its site in relation to the confluence of the brachiocephalic veins and the right atrium. Identification of intraluminal thrombus or tumor may require thrombolysis before stent insertion, or the use of a covered stent. After balloon dilatation of the superior vena cava stricture, the stent is positioned across the stricture, and a postplacement venacavagram is performed to confirm free flow of blood into the right atrium (Figure 7-20). Subsequent to angioplasty and stent placement, relief of SVCO symptoms usually is rapid and dramatic. Recurrence of symptoms may be caused by venous thrombosis or tumor progression. Although rupture of the superior vena cava at the time of angioplasty is a risk, this complication seems to be extremely rare, possibly because of the tamponade provided by surrounding tumor or postirradiation fibrosis.


The role of intravascular stents in the management of nonmalignant SVCO has not yet been defined. Patients who have SVCO caused by benign fibrosing mediastinitis have been treated successfully, although occlusion of the stent secondary to the progression of the mediastinal fibrosis or with endothelial proliferation may occur.


Normal Radiographic Anatomy


Mediastinum and Hilar Structures


The mediastinum is delineated by the lungs on either side, the thoracic inlet above, the diaphragm below, and the vertebral column posteriorly. In the context of radiographic anatomy, the various structures that make up the mediastinum are superimposed on each other, so they cannot be separately identified on a two-dimensional chest radiograph; for this reason, the normal anatomy of the individual components of the mediastinum is considered in more detail in the later section on CT of the mediastinum. Nevertheless, because a chest radiograph usually is the first imaging investigation, it is necessary to appreciate the normal appearances of the mediastinum and the considerable possible variations resulting from the patient’s body habitus and age.


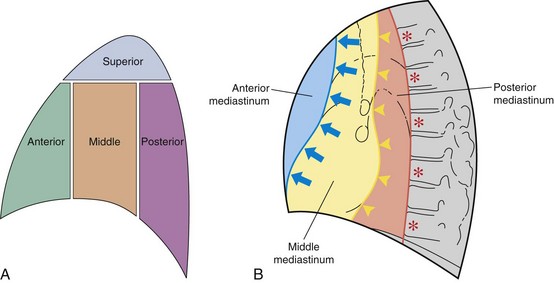
The mediastinum is conventionally divided into superior, anterior, middle, and posterior compartments (Figure 7-21). The practical benefit of use of these arbitrary divisions is that specific mediastinal pathologies show a definite predilection for individual compartments (e.g., a superior mediastinal mass most frequently is caused by intrathoracic extension of the thyroid gland; a middle mediastinal mass usually results from enlarged lymph nodes). However, localization of a mass within one of these compartments does not normally allow a specific diagnosis to be made, and neither do the arbitrary boundaries preclude disease from involving more than one compartment.


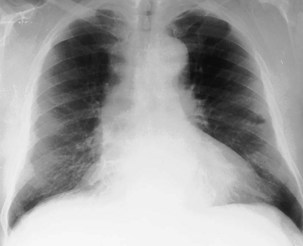
Only the outline of the mediastinum and the air-containing trachea and bronchi (and sometimes esophagus) is clearly seen on a normal posteroanterior chest radiograph. On a chest radiograph, the right brachiocephalic vein and superior vena cava form the right superior mediastinal border. This border usually is vertical and straight (in contrast with the situation in which right paratracheal lymphadenopathy is present, when the right superior mediastinal border tends to be undulate), and it becomes less distinct as it reaches the thoracic inlet. The right side of the superior mediastinum can appear to be considerably widened in patients who have an abundance of mediastinal fat (Figure 7-22); such persons often have prominent cardiophrenic fat pads. The mediastinal border to the left of the trachea above the aortic arch is the result of summation of the left carotid and left subclavian arteries, together with the left brachiocephalic and jugular veins. The left cardiac border consists of the left atrial appendage, which merges inferiorly with the left ventricle. The silhouette of the heart should always be sharply outlined. Any blurring of the border results from loss of immediately adjacent aerated lung, usually by collapse or consolidation.


The density of the heart shadow to the left and right of the vertebral column should be identical—any difference indicates pathology (e.g., an area of consolidation or a mass in a lower lobe). On a well-penetrated film, a density with a convex lateral border frequently is seen through the right heart border—this apparent mass is caused by the confluence of the right pulmonary veins as they enter the left atrium and is of no clinical significance.


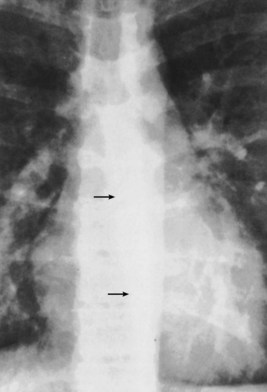
The trachea and main bronchi should be visible through the upper and middle mediastinum. The trachea is rarely straight and often is to the right of the midline at its midpoint. In older persons, the trachea may be markedly displaced by a dilated aortic arch below. In approximately 60% of normal subjects, the right wall of the trachea (the right paratracheal stripe) can be identified as a line of uniform thickness (less than 4 mm in width); when visible, it excludes the presence of any adjacent space-occupying lesion, most usually lymphadenopathy. The angle between the left and right main bronchi, which forms the carina, usually is somewhat less than 80 degrees. Splaying of the carina is a relatively crude sign of subcarinal disease, in the form of either a massive subcarinal lymphadenopathy or a markedly enlarged left atrium. A more sensitive sign of subcarinal disease is obscuration of the upper part of the azygoesophageal line, which usually is visible in its entirety on a chest radiograph with good penetration (Figure 7-23). The origins of the lobar bronchi, when they are projected over the mediastinal shadow, usually can be identified, but segmental bronchi within the lungs generally are not seen on plain radiography.


The normal hilar shadows on a chest radiograph represent the summation of the pulmonary arteries and veins, with little contribution from the overlying bronchial walls or lymph nodes of normal size. The hila are of approximately the same size, and the left hilum normally lies between 0.5 and 1.5 cm above the level of the right hilum. The size and shape of the hila show remarkable variation in normal persons, making subtle abnormalities difficult to identify.


Pulmonary Fissures, Vessels, and Bronchi


The two lungs are separated by the four layers of pleura behind and in front of the mediastinum. The resultant posterior and anterior junction lines often are visible on frontal chest radiographs as nearly vertical stripes, the posterior junction line lying higher than the anterior (Figure 7-24). Because these junction lines are not invariably seen (their visibility is largely dependent on whether the pleural reflections are tangential to the x-ray beam), their presence or absence is not usually of significance.
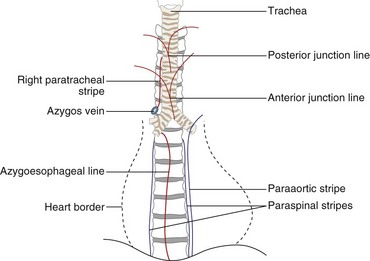


The lobes of lung are surrounded by visceral pleura—the major (or oblique) fissure separates the upper and lower lobes of the left lung. The major (or oblique) fissure and the minor (horizontal or transverse) fissure separate the upper, middle, and lower lobes of the right lung. In the absence of abnormality, the minor fissure is visible in more than half of posteroanterior chest radiographs. In normal persons, the minor fissure is slightly bowed upward and runs horizontally; any deviation from this configuration usually is caused by loss of volume of a lobe. The major fissures are not visible on a frontal radiograph and are inconsistently identifiable on lateral radiographs. Inability to detect a fissure usually reflects that the fissure is not exactly in the line of the x-ray beam. Occasionally, however, fissures may be incompletely developed—a point familiar to thoracic surgeons, who sometimes encounter difficulty in performing a lobectomy because of incomplete cleavage between lobes. Accessory fissures are occasionally seen; for example, in the left lung a minor fissure can be present, which separates the lingula from the remainder of the upper lobe.


All of the branching structures seen within normal lungs on a chest radiograph represent pulmonary arteries or veins. The pulmonary veins may sometimes be differentiated from the pulmonary arteries—the superior pulmonary veins have a distinctly vertical course. Often, however, it is impossible to differentiate arteries from veins in the lung periphery. On a chest radiograph taken in the erect position, a gradual increase in the diameter of the vessels is seen, at equidistant points from the hilum, traveling from lung apex to base; this gravity-dependent effect disappears if the patient is supine or in cardiac failure.


The lobes of the lung are divided into segments, each of which is supplied by its own segmental pulmonary artery and accompanying bronchus. The walls of the segmental bronchi are rarely seen on the chest radiograph, except when lying parallel with the x-ray beam, in which case they are seen end on as ring shadows measuring up to 8 mm in diameter. The most frequently identified segmental airways are the anterior segmental bronchi of the upper lobes.


Diaphragm and Thoracic Cage


The interface between aerated lung and the hemidiaphragms is sharp, and the highest point of each dome normally is medial to the midclavicular line. The right dome of the diaphragm is higher than the left by up to 2 cm in the erect position, unless the left dome is elevated by air in the stomach. Laterally, the hemidiaphragm forms an acute angle with the chest wall. Filling in or blunting of these costophrenic angles usually represents pleural disease, either pleural thickening or an effusion. In elderly persons, localized humps on the dome of the diaphragm, particularly posteriorly (and therefore most obvious on a lateral radiograph), are common and represent minor weaknesses or defects of the diaphragm. Interposition of the colon in front of the right lobe of the liver is a frequently seen normal variant (so-called Chilaiditi syndrome).


Apparent pleural thickening along the lateral chest wall in the middle zones is a frequent observation in obese patients; it is caused by subpleural fat bulging inward. Deformities of the thoracic cage may cause distortion of the normal mediastinum and so simulate disease. One of the most common deformities is pectus excavatum, which, by compressing the heart between the depressed sternum and vertebral column, causes displacement of the apparently enlarged heart to the left and blurring of the right heart border (Figure 7-25). A similar appearance may arise with an unusually straight thoracic spine, referred to as straight back syndrome.


Jun 12, 2016 | Posted by in RESPIRATORY | Comments Off on Imaging Techniques

Full access? Get Clinical Tree

Get Clinical Tree app for offline access