Assessment of risk at time of discharge could be a useful tool for guiding postdischarge management. The aim of this study was to develop a novel and simple assessment tool for better hospital discharge risk stratification. The study included 3,997 hospital-discharged patients with acute myocardial infarction who were enrolled in the nationwide prospective Korea Acute Myocardial Infarction Registry-1 (KAMIR-1) from November 2005 through December 2006. The new risk score system was tested in 1,461 hospital-discharged patients who were admitted from January 2007 through January 2008 (KAMIR-2). The new risk score system was compared to the Global Registry of Acute Coronary Events (GRACE) postdischarge risk model during a 12-month clinical follow-up. During 1-year follow-up, all-cause death occurred in 228 patients (5.7%) and 81 patients (5.5%) in the development and validation cohorts, respectively. The new risk score (KAMIR score) was constructed using 6 independent variables related to the primary end point using a multivariable Cox regression analysis: age, Killip class, serum creatinine, no in-hospital percutaneous coronary intervention, left ventricular ejection fraction, and admission glucose based on multivariate-adjusted risk relation. The KAMIR score demonstrated significant differences in its predictive accuracy for 1-year mortality compared to the GRACE score for the developmental and validation cohorts. In conclusion, the KAMIR score for patients with acute myocardial infarction is a simpler and better risk scoring system than the GRACE hospital discharge risk model in prediction of 1-year mortality.
The Global Registry of Acute Coronary Events (GRACE) 6-month postdischarge model is a robust tool for the prediction of long-term clinical outcomes in patients with acute coronary syndrome (ACS) and has been demonstrated to predict mortality for up to 4 years with good accuracy. Risk stratification at hospital discharge could be very useful in guiding postdischarge care such as optimal medical therapy. However, the GRACE model has several limitations. Patients and procedural characteristics in acute myocardial infarction (AMI) have been changing. The GRACE risk model was developed and validated based on data from 1999 through 2003. Current clinical treatments may no longer fit the GRACE model with the following examples. Rate of percutaneous coronary intervention (PCI) and use of clopidogrel were merely 30% when the GRACE model was introduced. However, these treatments are currently used in approximately 90% of patients. Furthermore, the GRACE model does not consider the following risk factors: admission hyperglycemia, presence of stroke or peripheral artery disease, and left ventricular systolic function. These have been shown to be helpful in assessing risk in AMI. None of the risk models have focused on new parameters in addition to the GRACE model in current clinical situations. Moreover, the GRACE score is difficult to calculate without the aid of a Web-based calculator or software. Accordingly, the aim of this study was to develop a novel score system based on the strongest factors independently associated with 1-year survival that would be used as a simple assessment tool for improving hospital discharge risk stratification in contemporary clinical practice.
Methods
The Korea Acute Myocardial Infarction Registry (KAMIR), launched in November 2005, is a Korean prospective multicenter data collection registry that reflects real-world treatment practice and outcomes in Asian patients presenting with AMI. The registry consists of 50 community and teaching hospitals with facilities for primary PCI and on-site cardiac surgery. Data were collected by a trained study co-ordinator using a standardized case-report form and protocol. The study protocol was approved by the ethics committee at each participating institution.
Eligible patients were ≥18 years of age at time of hospital admission, had a suggestive history with electrocardiographic change (new ST-T segment change, new onset of left bundle branch block, or development of pathologic Q waves) with a concomitant increase of ≥1 cardiac biomarker value of necrosis above the decision limit for MI such as creatine kinase-MB and troponins I and T.
The study population was enrolled in a nationwide prospective KAMIR from November 2005 through January 2008 from 5,458 patients with AMI who survived to hospital discharge. The entire study population had complete 1-year follow-up data. The developmental cohort consisted of 3,997 consecutive hospital-discharged patients who were enrolled in the nationwide prospective KAMIR-1 from November 2005 through December 2006. The new risk score system was tested in 1,461 hospital-discharged patients who were admitted from January 2007 through January 2008 (KAMIR-2).
GRACE risk scores were calculated in all patients. Age, history of heart failure, history of MI, increased heart rate at rest, low systolic blood pressure on arrival, ST-segment depression, increased initial serum creatinine, increased cardiac biomarkers, and not having in-hospital PCI were used for scoring.
ST-segment depression was defined as new horizontal or downsloping depression 0.05 mV in 2 contiguous leads. Proposed diagnostic criteria for acute kidney injury were an abrupt (within 48 hours) absolute increase in serum creatinine concentration of ≥0.3 mg/dl from baseline, percent increase in serum creatinine concentration of ≥50%, or oliguria of <0.5 ml/kg per hour for >6 hours. Urine volume and prehospital serum creatinine level were not checked in the KAMIR database; level of creatinine for renal injury was defined as an increase >0.3 mg/dl above the upper limit of normal range (1.5 mg/dl). Significant hyperglycemia in AMI was defined as >180 mg/dl according to the American Heart Association scientific statement for hyperglycemia management in patients with ACS. The American Heart Association has recommended that plasma glucose concentrations in patients with ACS be measured and considered for intensive glucose control with intravenous or subcutaneous insulin. Assessment of left ventricular ejection fraction was performed using echocardiography, which is a class I recommendation in the American College of Cardiology/American Heart Association guidelines.
The primary clinical end point was the composite of all-cause death at 1 year. Data were collected by a trained study co-ordinator using a standardized case-report form and protocol. To analyze prediction for 1-year mortality, data from the risk score and added parameters were employed as independent variables. Breslow-Day test was performed to assess homogeneity of relative risk across participating centers. Univariate relation between baseline characteristics and 1-year mortality was assessed by univariate Cox regression analysis. Multivariate analysis by stepwise Cox regression models (backward elimination) tested variables that were significant at a p value <0.2 in univariate analysis. All variables in the final model met the assumptions for proportional hazards.
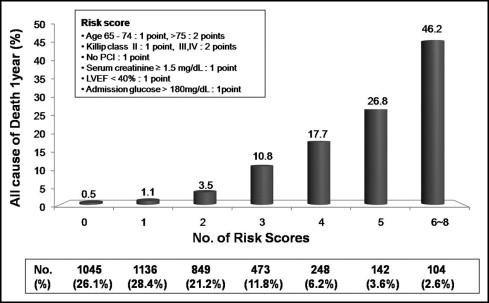
A new risk score was developed using independent variables associated with 1-year mortality. The lowest hazard ratio (HR) was 1.52, with 1 point for an HR <3.04 and 2 points for 3.05 to 4.56. In summary, the risk score was calculated by a simple sum of variables based on the multivariate-adjusted risk relation.
Predicted accuracy of the risk score was assessed using area under the receiver operator characteristic curve (or c-statistic). A new risk score (KAMIR score) system was compared to the GRACE risk score by differences between 2 areas under the curve in the 95% confidential interval (CI). For evaluation of the risk score in all patients, missing variables contributed 0 point to the total score. Data were missing in 48 patients for serum creatinine, 86 patients for serum glucose, 124 patients for Killip class, 29 patients for systolic blood pressure, 27 patients for heart rate, 167 patients for ST-segment depression, and 13 patients for performed PCI; 311 patients (5.7%) did not have an echocardiogram. Except for these variables, no data were missing. A p value <0.05 was considered statistically significant. Analyses were performed using SPSS 15.0 (SPSS, Inc., Chicago, Illinois). Comparison between receiver operator characteristic curves was performed using Analyze-it standard edition (Analyse-it Software, Ltd., Leeds, United Kingdom).
Results
In total 5,458 discharged patients with AMI were included in this study. Baseline characteristics are presented in Table 1 . During 1-year follow up, all-cause death occurred in 228 patients (5.7%) and 81 patients (5.5%) and cardiac death occurred in 166 patients (4.2%) and 56 patients (3.8%) in the development and validation cohorts, respectively. In addition, 5,152 patients (94.4%) underwent coronary angiography, and 197 patients (3.6%) had no significant stenosis (normal coronary artery 1.5%, myocardial bridge 0.2%, spasm 1.1%, mild stenosis 0.8%). PCI was performed in 4,617 patients (84.6%). The test for assessing homogeneity of relative risk across the center was not significant for 1-year mortality (Breslow-Day test, p = 0.641).
| Characteristics | Development Cohort | Validation Cohort |
|---|---|---|
| (n = 3,997) | (n = 1,461) | |
| Age (years) | 62.5 ± 12.5 | 62.6 ± 12.7 |
| 65–74 | 1,185 (29.6%) | 432 (29.6%) |
| ≥75 | 791 (18.0%) | 270 (18.5%) |
| Women | 1,147 (28.7%) | 420 (28.7%) |
| Hypertension | 1,902 (47.6%) | 672 (46.0%) |
| Diabetes mellitus | 1,068 (26.7%) | 378 (26.1%) |
| Hypercholesterolemia | 367 (9.2%) | 159 (10.9%) |
| Current smoker | 2,379 (59.9%) | 905 (61.9%) |
| Previous myocardial infarction | 291 (7.3%) | 87 (6.0%) |
| Previous stroke or peripheral artery disease | 279 (7.0%) | 87 (6.0%) |
| Findings on admission | ||
| Killip class II | 422 (10.6%) | 152 (10.4%) |
| Killip classes III to IV | 463 (11.6%) | 164 (11.3%) |
| Systolic blood pressure <100 mm Hg | 348 (8.7%) | 121 (8.3%) |
| Heart rate >100 beats/min | 398 (10.0%) | 148 (10.2%) |
| ST-segment depression | 714 (18.6%) | 269 (18.4%) |
| Left ventricular ejection fraction <40% | 540 (13.5%) | 184 (13.5%) |
| Serum creatinine ≥1.5 mg/dl | 388 (9.8%) | 154 (10.6%) |
| Admission glucose >180 mg/dl | 1,147 (28.7%) | 405 (28.3%) |
| Angiographic findings | ||
| American College of Cardiology/American Heart Association lesion score C | 1,764 (44.1%) | 562 (38.5%) |
| 3-vessel coronary disease | 835 (20.9%) | 400 (27.4%) |
| Left main coronary artery disease | 115 (2.9%) | 56 (3.8%) |
| In-hospital coronary revascularization | ||
| No percutaneous coronary intervention | 602 (15.1%) | 212 (14.5%) |
| Multivessel percutaneous coronary intervention | 872 (21.8%) | 322 (22.1%) |
| Coronary artery bypass grafting | 133 (3.3%) | 54 (3.7%) |
Univariate predictors of 1-year mortality were age, female gender, hypertension, diabetes mellitus, smoking, previous MI, history of stroke or peripheral artery disease, Killip class, initial heart rate, systolic blood pressure, ST-segment depression on electrocardiogram, left ventricular ejection fraction on echocardiogram, left main coronary artery lesion, 3-vessel disease, and baseline serum creatinine and glucose levels ( Table 2 ). By multivariate Cox regression analysis, the 6 independent factors that increased the risk of 1-year mortality were age 65 to 74 years (HR 2.35, 95% CI 1.58 to 3.51), age >75 years (HR 4.78, 95% CI 3.25 to 7.04), Killip class II (HR 2.14, 95% CI 1.44 to 3.18), Killip classes III to IV (HR 3.76, 95% CI 2.68 to 5.27), no PCI (HR 2.22, 95% CI 1.65 to 2.98), serum creatinine ≥1.5 mg/dl (HR 2.04, 95% CI 1.49 to 2.79), left ventricular ejection fraction <40% (HR 1.86, 95% CI 1.37 to 2.52), and admission glucose >180 mg/dl (HR 1.62, 95% CI 1.06 to 2.19; Table 3 ).
| Characteristics | Beta Coefficient | P Value | HR (95% CI) |
|---|---|---|---|
| Age (years) | |||
| 65–74 | 1.309 | <0.001 | 3.70 (2.58–5.31) |
| ≥75 | 2.080 | <0.001 | 8.00 (5.65–11.33) |
| Women | 0.435 | 0.001 | 1.55 (1.19–2.01) |
| Hypertension | 0.451 | 0.001 | 1.57 (1.22–2.03) |
| Diabetes mellitus | 0.618 | <0.001 | 1.86 (1.44–2.40) |
| Hypercholesterolemia | 0.023 | 0.92 | 1.02 (0.65–1.61) |
| Current smoker | −0.433 | 0.001 | 0.65 (0.51–0.83) |
| Previous myocardial infarction | 0.650 | <0.001 | 1.92 (1.44–2.55) |
| Previous stroke or peripheral artery disease | 1.074 | <0.001 | 2.93 (2.11–4.07) |
| On admission | |||
| Killip class | |||
| II | 1.166 | <0.001 | 3.21 (2.26–4.56) |
| III to IV | 2.519 | <0.001 | 7.65 (5.80–10.07) |
| Systolic blood pressure <100 mm Hg | 0.436 | 0.023 | 1.55 (1.06–2.25) |
| Heart rate >100 beats/min | 1.163 | <0.001 | 3.20 (2.39–4.27) |
| ST-segment depression | 0.644 | <0.001 | 1.90 (1.44–2.51) |
| Left ventricular ejection fraction <40% | 1.342 | <0.001 | 3.83 (2.91–5.03) |
| Serum creatinine ≥1.5 mg/dl | 1.599 | <0.001 | 4.75 (3.64–6.20) |
| Glucose >180 mg/dl | 0.692 | <0.001 | 2.00 (1.55–2.57) |
| Angiographic finding | |||
| American College of Cardiology/American Heart Association lesion score C | 0.217 | 0.232 | 1.24 (0.87–1.77) |
| 3-vessel coronary disease | 0.587 | 0.002 | 1.80 (1.25–2.59) |
| Left main coronary artery disease | 0.900 | 0.014 | 2.46 (1.20–5.03) |
| In-hospital revascularization | |||
| No percutaneous coronary intervention | 1.372 | <0.001 | 3.94 (3.04–5.11) |
| Multivessel percutaneous coronary intervention | 0.204 | 0.30 | 1.23 (0.83–1.80) |
| No coronary artery bypass grafting | −0.377 | 0.22 | 0.69 (0.37–1.26) |
| Characteristics | Beta Coefficient | p Value | HR (95% CI) |
|---|---|---|---|
| Age (years) | |||
| 65–74 | 0.871 | 0.001 | 2.39 (1.44–3.97) |
| >75 | 1.468 | <0.001 | 4.34 (2.59–7.28) |
| Killip class | |||
| II | 0.850 | 0.001 | 2.34 (1.39–3.94) |
| III to IV | 1.401 | <0.001 | 4.06 (2.54–6.50) |
| No percutaneous coronary intervention | 0.797 | <0.001 | 2.22 (1.65–2.98) |
| Serum creatinine ≥1.5 mg/dl | 0.580 | 0.012 | 1.79 (1.13–2.81) |
| Left ventricular ejection fraction <40% | 0.805 | <0.001 | 2.24 (1.47–3.41) |
| Admission glucose >180 mg/dl | 0.417 | 0.040 | 1.52 (1.02–2.26) |
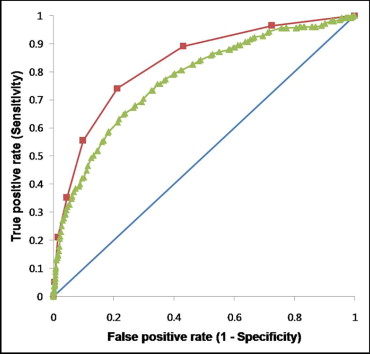
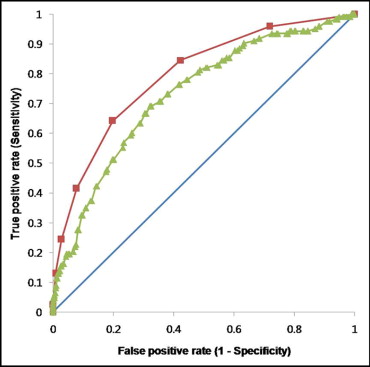
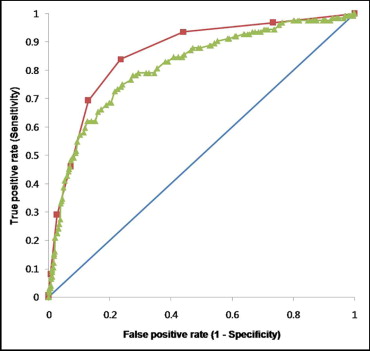
A new risk score (KAMIR score) for AMI showed a strong graded relation to 1-year mortality (0.5% to 46.2%; Figure 1 ). Accuracy for 1-year mortality by the GRACE and KAMIR score systems were 0.77 (area under the curve, CI 0.74 to 0.80) and 0.83 (CI 0.80 to 0.86), respectively. A significant difference existed (0.77 vs 0.83, p <0.0001). The KAMIR score (area under the receiver operator characteristic curve 0.79, CI 0.75 to 0.83) demonstrated a significant difference in predictive accuracy compared to the GRACE score (0.79 vs 0.73, p = 0.0007) for ST-segment elevation MI and non–ST-segment elevation MI (0.86 vs 0.81, p = 0.0079; Figures 2 through 4 ). The KAMIR score also demonstrated significant differences in predictive accuracy compared to the GRACE model for the validation cohort in the entire range of AMI ( Table 4 ). The KAMIR score included more in-hospital variables rather than medical history ( Table 5 ).


Stay updated, free articles. Join our Telegram channel

Full access? Get Clinical Tree


