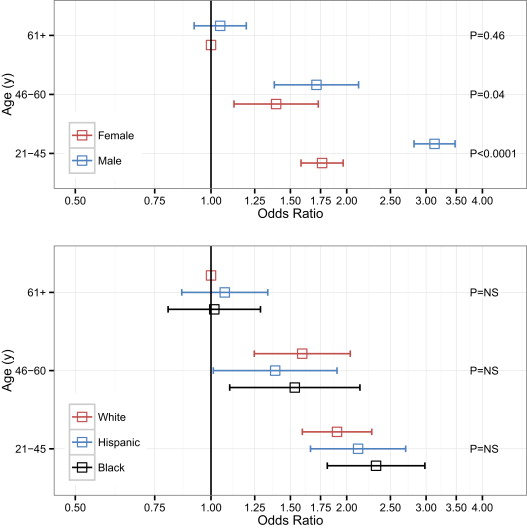
A standard (“core”) implementation of American College of Cardiology/American Heart Association 2013 lipid guidelines (based on 10-year risk) dramatically increases the statin-eligible population in older Americans, raising controversy in the cardiovascular community. The guidelines also endorse a more “comprehensive” risk approach based in part on lifetime risk. The impact of this broader approach on statin eligibility remains unclear. We studied the impact of 2 different implementations of the new guidelines (“core” and “comprehensive”) using the National Health and Nutrition Examination Survey. Although “core” guidelines led to 72.0 million subjects qualifying for statin therapy, the broader “comprehensive” application led to nearly a twofold greater estimate for statin-eligible subjects (121.2 million), with the greatest impact among those aged 21 to 45 years. Subjects indicated for statin therapy under comprehensive guidelines had a greater burden of cardiovascular risk factors and a higher lifetime risk of cardiovascular disease than those not indicated for statins. In particular, men aged 21 to 45 years had a 3.13-fold increased odds of being eligible for statin therapy only under the “comprehensive” guidelines (vs standard “core” guidelines; 95% confidence interval 2.82 to 3.47, p <0.0001). There were no racial differences. In conclusion, the “comprehensive” approach to statin eligibility espoused by the American College of Cardiology/American Heart Association 2013 guidelines would increase the statin-eligible population to over 120 million Americans, particularly targeting younger men with high–risk factor burden.
Recent American College of Cardiology (ACC)/American Heart Association (AHA) 2013 guidelines for treatment of cholesterol for reduction of risk of cardiovascular disease (CVD) remain controversial. Published analyses of their impact suggest statin therapy will be recommended in nearly 12.8 million additional United States residents aged 40 to 75 years. These analyses have largely focused on the application of the “core” recommendations for treatment of those with established CVD, diabetics, those with low-density lipoprotein (LDL) ≥190 mg/dl, and those with an estimated 10-year CVD risk of >7.5% (based on the Pooled Cohort Equations [PCE]). However, the guidelines also recognize an optional, broader criterion for treatment in primary prevention, including basing therapeutic decisions on abnormalities in emerging risk factors such as high-sensitivity C-reactive protein, coronary artery calcification, family history, and lifetime risk. It is important to understand how many subjects may qualify based on this broader reading of the guidelines and what types of patients will be most affected. We sought to investigate the incremental increase in statin prescriptions based on health care providers following the optional “comprehensive” application of the 2013 ACC/AHA guidelines to identify subpopulations in which statin implementation may be emphasized.
Methods
The National Health and Nutrition Examination Survey (NHANES) is an ongoing research program conducted by the National Center for Health Statistics aimed at assessing the health and nutritional status of noninstitutionalized, civilian adults and children in the United States using a combination of interviews, physical examinations, and diagnostic testing. The complex survey design of NHANES assigns sample weights to each participant, allowing estimation of subgroup sizes, proportions, and characteristics among the overall noninstitutionalized United States population. The overall study design was approved by the National Center for Health Statistics’ Institutional Review Board and informed consent was obtained for all participants.
We combined data from the 2007 to 2008 and 2009 to 2010 data collection cycles to define the populations indicated for statin therapy under Third Report of the Expert Panel on Detection, Evaluation and Treatment of High Blood Cholesterol in Adults (ATP3) and under the 2013 ACC/AHA guideline updates. Data from participants in morning sessions (n = 4,910, adults aged ≥21 years) were used, as fasting lipid profiles were not available from afternoon session participants. We used sample weights developed by the National Center for Health Statistics to enable computation of population estimates from only the morning session subjects. Subjects were considered to have diabetes if their fasting glucose was ≥126 mg/dl, hemoglobin A1c was ≥6.5%, or if it was reported by history. Prediabetes was considered present among nondiabetics if hemoglobin A1c was ≥5.7% or fasting glucose was ≥100 mg/dl. Subjects were considered to have known CVD if they reported being told by a health professional that they had coronary heart disease, angina, heart attack, or stroke. We used the 2004 update of the ATP3 and AHA 2013 recommendations to define which subjects qualified for statin therapy under ATP3, AHA 2013, both, or neither guidelines ( Supplementary Figure 1 ). All patients who self-reported being treated with lipid-lowering medications were presumed to meet indications for both ATP3 and ACC/AHA 2013 as pretreatment lipid profiles were not available, consistent with previous studies. In addition to “core” criteria described in Figure 2 of the ACC/AHA 2013 guidelines, we also applied “comprehensive” criteria described in Figure 4 of the ACC/AHA 2013 guidelines. For the “comprehensive” criteria, we did not include coronary artery calcium score or ankle-brachial indexes, as these data were not collected in the NHANES cycles used for this analysis. Additionally, we considered family history of premature CVD to be history of myocardial infarction in a first degree relative before age 50 to coincide with NHANES data collection.
The 10-year risk of myocardial infarction or coronary death and atherosclerotic CVD were computed in accordance with the Framingham Heart Study hard coronary heart disease risk equations and the PCE, respectively. For the ATP3 risk equation, the continuous risk equations for age, gender, total- and high-density lipoprotein cholesterol, systolic blood pressure, and smoking status were used using coefficients obtained from the Framingham Heart Study website to maximize accuracy and precision of risk estimates. Race- and gender-specific PCE were used for non-Hispanic whites and non-Hispanic blacks. For Hispanics and all other nonwhite or nonblack racial groups, the gender-specific PCE for non-Hispanic whites was used, as recommended in the guidelines.
Subjects were considered indicated under “core” ACC/AHA 2013 guidelines if they had established CVD, LDL ≥190 mg/dl, were aged 40 to 75 years with diabetes and LDL ≥70 mg/dl, were aged 40 to 75 years with PCE risk ≥7.5% and LDL ≥70 mg/dl, or were being treated with cholesterol lowering medications. Subjects were considered indicated under “comprehensive” guidelines if they met “core” criteria or if they were aged 40 to 75 years with PCE risk 5% to 7.5% with LDL ≥70 mg/dl, had LDL ≥160 mg/dl at any age, had high sensitivity C-reactive protein levels ≥2.0 mg/dl, were aged 21 to 59 years with high lifetime risk of CVD (defined for this study as ≥50%), or had early family history of CVD in a first degree relative (defined as myocardial infarction before age 50 for this study). Although ankle-brachial index and coronary artery calcification criteria are also endorsed by the guidelines, these data were not available in the NHANES cycles analyzed for this study.
Values are presented as means with 95% confidence intervals [CIs]. All statistical tests were performed using SAS 9.4 (SAS Institute Inc., Cary, North Carolina). Type I error (α) threshold was set at 0.05. Analytic methods accounted for the complex survey design of NHANES. Domain analysis was used to estimate parameters for subgroups and to exclude those aged <21 years from final estimates. Variance estimation for survey data was performed using Taylor series. Comparisons in patient characteristics between those with or without statin indications were made using linear regression for continuous variables. For categorical and binary variables, comparisons were made using the chi-square test. Logistic regression was used to evaluate the incremental impact of “comprehensive” implementation on those who are not treated under “core” implementation, using interaction terms to test for effect modification of age trends by gender and race.
Multiple imputation was used for critical missing data such as variables required to compute 10-year risk (total cholesterol, systolic blood pressure, high-density lipoprotein, antihypertensive use, and current smoking) or for determination of indications for statin therapy (history of CVD, hemoglobin A1c, and glucose). Rates of missing data ranged from 0.04% to 3.1%. Ten imputations were performed using fully conditional specification resulting in ≥0.994 relative efficiency for all imputed variables. The results of analysis of the imputed data sets were synthesized using the rules described by Rubin.
Results
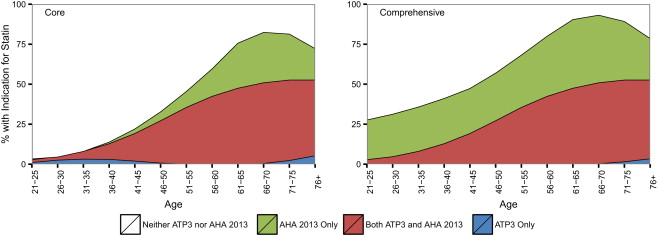
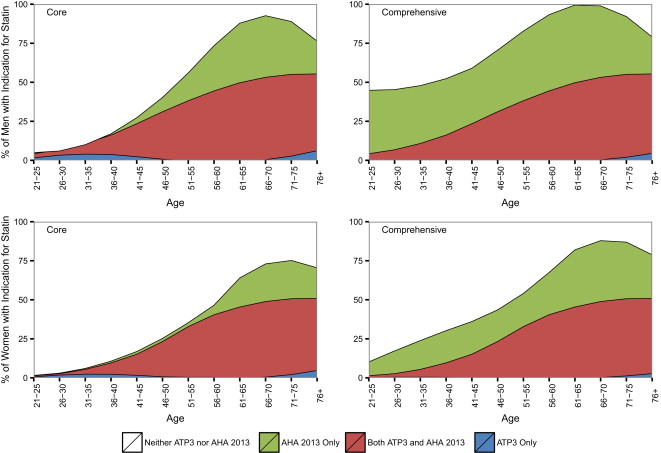
We observed that of the 213.4 million subjects >21 years of age, 55.7 million (95% CI 48.8 to 62.7 million) would qualify for statin prescription on the basis of ATP3 criteria. Figure 1 compares “core” and “comprehensive” implementations of ACC/AHA 2013 with ATP3 across the age spectrum. A “core” application of the ACC/AHA 2013 guidelines (as outlined in Table 1 ) would yield 72.0 million subjects, whereas the “comprehensive” interpretation of the guidelines would yield nearly a twofold greater statin-eligible population (121.2 million). Although “comprehensive” guideline implementation leads to greater treatment than “core” in all age groups, the incremental increase in treatment is greatest among those aged 21 to 45 years where approximately 29.7 million additional subjects are indicated for statin therapy only under “comprehensive” implementation. Of these, >1/2 or 15.2 million subjects qualified because of high lifetime risk of CVD.
| Group 1: Neither (N=1271) | Group 2: Comprehensive Only (N=603) | Group 3: Both Core & Comprehensive (N=172) | Group 1 vs 2 | Group 2 vs 3 | |
|---|---|---|---|---|---|
| Population | 64.8 million (58.8-70.8 million) | 29.7 million (25.4-34.0 million) | 7.9 million (6.2-9.5 million) | ||
| Age (years) | 32.1 (31.5-32.7) | 33.1 (32.5-33.8) | 39 (37.7-40.2) | 0.02 | <0.0001 |
| Men | 38.7% (35.5-41.9) | 68.8% (63.9-73.7) | 62% (52.2-71.8) | <0.0001 | <0.0001 |
| Race | <0.0001 | <0.0001 | |||
| Hispanic | 18.8% (14.2-23.4) | 18.2% (13.1-23.4) | 14.1% (8-20.3) | ||
| White | 60.9% (55.3-66.6) | 64% (57.3-70.7) | 64.5% (53.6-75.4) | ||
| Black | 11.7% (9.2-14.1) | 12.9% (9.6-16.2) | 13.2% (6.8-19.7) | ||
| Other | 8.6% (5.6-11.6) | 4.8% (2.3-7.4) | 8.1% (4.6-11.7) | ||
| Education (grade) | 0.002 | 0.03 | |||
| <9th | 4.9% (3.5-6.2) | 5.3% (3.9-6.8) | 4.9% (2.3-7.5) | ||
| 9-11 | 9.4% (7.5-11.3) | 17.6% (14.3-21) | 14.6% (9.4-19.8) | ||
| HS Grad/GED or equivalent | 18.4% (14.9-22) | 30.2% (26.1-34.3) | 25.5% (15.8-35.2) | ||
| Some College or AA Degree | 32% (28.7-35.2) | 29.5% (25-34.1) | 29.4% (19.3-39.6) | ||
| College Grad or Above | 35.3% (30.5-40.1) | 17.3% (13.2-21.4) | 25.6% (16-35.1) | ||
| Poverty-Income Ratio | 2.9 (2.7-3) | 2.5 (2.3-2.7) | 2.7 (2.4-3) | 0.0003 | 0.26 |
| FHx of Premature MI | 0 (0 – 0) | 30.2% (25.7-34.8) | 28% (19.3-36.8) | <0.0001 | <0.0001 |
| Systolic BP (mmHg) | 112 (111.1-112.9) | 117.2 (115.8-118.6) | 120.1 (117.2-123) | <0.0001 | 0.08 |
| Diastolic BP (mmHg) | 67.6 (66.5-68.6) | 70 (68.6-71.3) | 74 (71.6-76.5) | 0.0006 | 0.005 |
| BP ≥140/90 | 3.5% (2.2-4.8) | 6% (3.9-8.2) | 17.2% (10.6-23.8) | <0.0001 | <0.0001 |
| Antihypertensive Rx | 2.6% (1.8-3.5) | 15.3% (10.9-19.7) | 36.2% (23.9-48.6) | <0.0001 | <0.0001 |
| LDL (mg/dl) | 105.8 (104.5-107.1) | 121.9 (118.4-125.4) | 139.4 (127.7-151.1) | <0.0001 | 0.004 |
| LDL (Category) | <0.0001 | <0.0001 | |||
| Coronary Heart Disease | 0% (0-0) | 0% (0-0) | 21.8% (15-28.6) | ||
| Diabetes Mellitus | 0.3% (0.1-0.6) | 5.8% (3.3-8.2) | 25.2% (17.9-32.5) | ||
| Treated | 0% (0-0) | 0% (0-0) | 29% (20.8-37.1) | ||
| <70 | 7.7% (6-9.4) | 4.6% (2.7-6.5) | 0% (0-0) | ||
| 70-100 | 34.5% (31.5-37.5) | 23.3% (18.8-27.9) | 0.2% (-0.2-0.6) | ||
| 100-130 | 38.9% (36-41.8) | 29% (25.3-32.6) | 0.5% (-0.5-1.4) | ||
| 130-160 | 18.6% (16.3-21) | 16.6% (13.2-19.9) | 1.6% (0.2-3) | ||
| 160-190 | 0% (0-0) | 20.7% (16.8-24.6) | 3% (-0.2-6.3) | ||
| ≥190 | 0% (0-0) | 0% (0-0) | 18.8% (10.9-26.7) | ||
| HDL (mg/dl) | 54.4 (53.3-55.4) | 49.8 (48.1-51.4) | 47.8 (45.1-50.5) | <0.0001 | 0.16 |
| HDL <40 | 17.2% (14.4-20.1) | 27.6% (21.7-33.5) | 29.7% (21.1-38.4) | <0.0001 | 0.001 |
| Triglycerides (mg/dl) | 107.9 (102.5-113.3) | 140.2 (132.5-147.9) | 182.2 (152.8-211.5) | <0.0001 | 0.009 |
| Total Cholesterol (mg/dl) | 181.5 (179.8-183.2) | 198.7 (194.6-202.8) | 220.2 (206.7-233.6) | <0.0001 | 0.002 |
| Glucose (mg/dl) | 95.2 (94.2-96.1) | 102.2 (99.9-104.5) | 119.6 (109.4-129.7) | <0.0001 | 0.002 |
| Hemoglobin A1c (%) | 5.2 (5.2-5.2) | 5.4 (5.4-5.5) | 6 (5.8-6.3) | <0.0001 | 0.0001 |
| Pre-Diabetes Mellitus | 32.2% (27.8-36.5) | 42.6% (37.2-47.9) | 43.8% (33.6-54) | <0.0001 | <0.0001 |
| ATP3 Risk Factors | <0.0001 | <0.0001 | |||
| CHD | 0% (0-0) | 0% (0-0) | 21.8% (15-28.6) | ||
| Diabetes Mellitus | 0.3% (0.1-0.6) | 5.8% (3.3-8.2) | 25.2% (17.9-32.5) | ||
| 0 | 71.6% (67.9-75.3) | 16% (12.8-19.3) | 16.4% (7.8-25.1) | ||
| 1 | 25.3% (21.8-28.8) | 46.5% (40.7-52.4) | 22.1% (14.1-30.2) | ||
| 2 | 2.7% (1.5-4) | 28.4% (23.2-33.5) | 8.6% (4.8-12.4) | ||
| 3 | 0.1% (-0.1-0.2) | 3.3% (1.7-4.9) | 5.8% (1.8-9.8) | ||
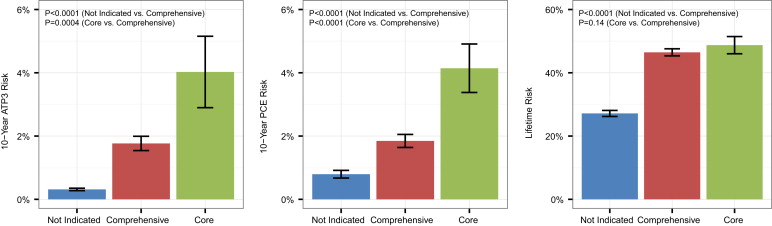
| 10-Year ATP3 Risk | 0.3 (0.3-0.4) | 1.8 (1.5-2) | 4 (2.9-5.2) | <0.0001 | 0.0004 |
| 10-Year PCE Risk | 0.8 (0.7-0.9) | 1.8 (1.6-2.1) | 4.1 (3.4-4.9) | <0.0001 | <0.0001 |
| Lifetime Risk | 27.1 (26.2-28.1) | 46.5 (45.3-47.6) | 48.7 (46-51.5) | <0.0001 | 0.14 |
Stay updated, free articles. Join our Telegram channel

Full access? Get Clinical Tree


