Step 1
Check setup (transducer leveling, zeroing, and calibration)
Select appropriate fluid-filled catheter (short, large bore, stiff, with side holes, or end hole)
Assure there are tight connections between catheter(s) and transducer(s), avoid fluid leakage
Remove all air bubbles in the circuit
Step 2
Perform assessment of wave configuration with close correlation to the ECG
Check for artifacts that can distort waveform tracing (e.g., over- or under-damping)
Check an arterial blood gas to confirm normocapnia and rule out respiratory pathology
Measure at end expiration
Obtain pressure waveform data before injecting contrast
The graphical representations of pressure waveforms play an important role in understanding the hemodynamic assessment. Accurate acquisition and interpretation allows diagnosis of cardiac function (or dysfunction) based on the interrelated events within the cardiac cycle, while inaccurate measurements can lead to misinterpretation and potential harm.
Pressure changes within the cardiac chambers and vessels are generally recorded through membrane transducers transforming the pressure signal to an electrical signal, which is filtered, amplified, and displayed as a change in pressure over time. The transducer may be located at the tip of a catheter, as a high-fidelity pressure sensor that provides high-fidelity representations of the pressure changes. A major disadvantage of such systems is cost and difficulty in multiple reuses, limiting their application to research. More commonly the pressure transducer is outside of the body, and the pressure waveform is transmitted from the intravascular catheter to the transducer through a column of fluid.
Common to all catheter-based hemodynamic acquisitions and critical for data accuracy is the transducer pressure setup, which requires special attention to check that transducers are leveled, zeroed, and calibrated. For transducers that are fixed to the table, the mounting should be at the phlebostatic axis which is located at the fourth intercostal space and 1/2 the anterior-posterior diameter of the chest, the midaxillary line, which approximates the location of the right atrium. The next step is zeroing the transducer which refers to the establishment of a reference point for subsequent pressure measurements. The stopcock to the transducer membrane is opened to air (atmospheric pressure) and electronically the signal set as zero by the hemodynamic system. Calibration of the system is performed by the physiological recorder to set the appropriate scale factor. Once this is complete, the transducer is ready to display accurate pressure measurements. If the transducer is placed above the true zero position, pressure measurements will be lower than the actual pressure and the opposite is true if placed below the true zero position. As such, it is important to pay close attention to this portion of the procedure, as small pressure changes may lead to errors in diagnosis and perhaps inappropriate therapies. Some transducer configurations are not fixed to the table and incorporated into a manifold which connects the catheter to the transducer and fluid flushes. In this case, the manifold can be placed anywhere on the table, but the transducer zeroed to the midaxillary line with a fluid-filled tube. When obtaining measurements in this configuration, the manifold must be placed at the same location as when zeroed. The pressure signal may suffer distortions as pressure wave oscillates through the fluid-filled system. In this regard, the fidelity of the pressure signal depends on the physical characteristics of the measuring system, i.e., the length of the tubing to transducer, the compliance characteristics of the catheter (tubing) wall, the size of the catheter lumen, and the viscosity of the fluid within the catheter. If the oscillations are muffled and far apart, the system is referred to as over-damped. This will underestimate systolic pressures and overestimate diastolic pressures. An example may be seen when catheters are kinked or in the case of a loose connection between within the lines. An under-damped system occurs when the oscillations are too pronounced, the pressures are magnified, and systolic pressures are overestimated and diastolic pressures underestimated. As such these effects can be modified to some extent by changing the viscosity of the fluid, for example, mixing contrast or blood within the catheter. Air bubbles may also be inadvertently introduced anywhere from the tip of the catheter to the transducer membrane. Any amount of air results in damping, by lowering the natural frequency of the measuring system and allows high-frequency components of the signal to oscillate, producing pressure wave form overshoots (commonly seen at the systolic and diastolic inflection of a ventricular trace). Flushing the measurement system restores its natural frequency response and the fidelity of the signal.
9.3 The Pressures
9.3.1 The Right Atrium
Normal right atrial (RA) pressure is 2–8 mmHg. It is determined by atrial and ventricular compliance, atrioventricular valve function, and central venous pressure (CVP). The latter can be influenced by several dynamic factors such as cardiac output, respiratory activity, skeletal muscle contraction, sympathetic venous tone, and hydrostatic forces, components which can modify the pressure in the RA.
When the tip of the catheter is placed on the right atrium, the resulting waveform has two major positive waves (a and v) and two negative descents (x and y) (Fig. 9.1). The a wave is generated from the pressure rise following atrial contraction and occurs following the P wave on the ECG by approximately 80 msec and normally is the dominant wave. As such, an a wave is absent in patients with atrial fibrillation. Increased a waves can occur in restricted atrial emptying into the ventricle such as atrioventricular valve stenosis or noncompliant ventricular chambers. Following atrial contraction, pressure decline is represented by the x descent, due to atrial relaxation and the downward motion of the atrioventricular junction during the early phase of ventricular systole. Occasionally, a third wave (c wave) may be observed as a small positive deflection during early ventricular systole when the atrioventricular valve is closed and bulges into the right atrium. If present, the c wave interrupts the x descent and follows the a wave by the same time as the PR interval on the ECG. Accordingly, patients with first-degree AV block may have increased c waves. As atrial relaxation continues, the x descent is now termed x′ and is present as pressure declines. The positive deflection following the nadir of the x descent is termed the v wave and is generated by passive venous filling of the atrium while the tricuspid valve is closed, the peak of the wave occurring at the end of ventricular systole, which corresponds to the end of the T wave in the ECG. Finally, the y descent reflects the fall in RA pressure when the atrioventricular valve opens and rapid emptying into the ventricle occurs. During inspiration the chest expands and pressure inside the chest becomes negative. The negative pressure is transmitted to the RA, and right atrial pressure falls during inspiration. In patients with congestive heart failure, poorly compliant pericardium or myocardium or cardiac tamponade right atrial pressure fails to fall or rise during inspiration. This abnormal finding often given the name of Kussmaul’s sign and is clinically characterized as a paradoxical rise in the jugular venous pulse during inspiration and associated with an exaggerated y descent.
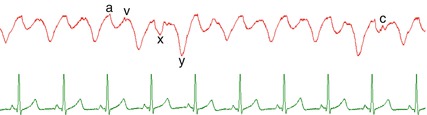
Fig. 9.1
Upper panel: venous pressure tracing from the right atrium denoting timing of the various wave components. The a wave is generated from the pressure rise following atrial contraction and occurs following the P wave on the ECG. The positive deflection following the nadir of the x descent is the v wave and is generated by passive venous filling of the atrium while the tricuspid valve is closed. Lower panel: the ECG
9.3.2 The Right Ventricle
Normal right ventricular systolic pressure is 20–30 mmHg and 2–8 mmHg at the end of diastole. It is important to remember that in normal physiologic circumstances, the right ventricle (RV) pumps the same stroke volume as the left ventricle (LV) but with considerable less amount of stroke work (~25 %) because of the lower resistance of the pulmonary circulation. Once ventricular contraction begins, pressure increases in the RV forcing the closure of the atrioventricular valve, and in this early and extremely brief period, the pulmonary valve is closed allowing pressure to increase with no corresponding volume change (isovolumetric contraction). When the pressure exceeds that in the pulmonary artery (PA), the pulmonary valve opens with blood exiting the chamber. This is characterized as a rapid but sloped upstroke in the RV waveform (different from that of the LV) and occurs in most instances immediately after the onset of the QRS complex on the ECG. When repolarization occurs triggering the beginning of ventricular relaxation, pressure begins to fall, and when ventricular pressure falls below PA pressure, the pulmonary valve closes. Similarly, during this brief period, both the pulmonary valve and atrioventricular valve are closed, and pressure falls without change in volume (isovolumetric relaxation) until the diastolic pressure is lower than that of the RA, rendering the atrioventricular valve to open (Fig. 9.2). End diastole is generally measured at the nadir of the RV pressure trace before the subsequent ejection. During early and late ventricular filling, pressure in the RV increases slowly, and when atrial contraction occurs, an a wave may appear on the ventricular waveform at end diastole. Under normal circumstances, the RV absorbs atrial contraction without any significant rise in pressure. In situations where the RV is noncompliant, the pressure may be transmitted through the chamber to open prematurely the pulmonary valve. An a wave may also be present under other pathological situations such as volume or pressure overload (i.e., pulmonary hypertension). The contour of the RV pressure trace can also indicate the form of pathology present. For example, in pulmonary valve stenosis with an intact ventricular septum, the systolic trace is triangular in shape, while in the setting of a ventricular septal defect (such as Fallot’s tetralogy), the RV trace has the same contours as that of the LV, with a systolic plateau.
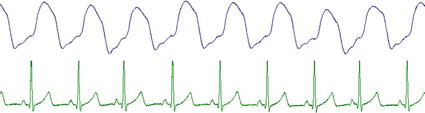
Fig. 9.2
Upper panel: typical appearance of the pressure wave generated by the right ventricle. Note the contour contrasted to that of the right ventricle in the presence of valvar stenosis as shown in Fig. 9.3. Lower panel: the ECG
9.3.3 The Pulmonary Artery
Normal PA systolic pressure is 17–32 mmHg, and diastolic pressure 4–13 mmHg with mean pulmonary pressure ranging from 12 to 16 mmHg, reflecting the large cross-sectional area of the pulmonary circulation and low vascular resistance. Normally there is no systolic pressure gradient between the PA and RV unless there is valve, subvalve, or supravalve outflow obstruction (Fig. 9.3). An anacrotic notch is rarely seen in the upstroke of the pulmonary artery trace, while a dicrotic notch can be seen as pulmonary artery pressure drops, and the pulmonary valve closes and continues to fall until it reaches diastolic pressure. Elevated pulmonary pressures can be present in high-flow states with normal pulmonary vascular resistance (i.e., hypervolemia, large patent ductus arteriosus, or a ventricular septal defect) or high-resistance states (i.e., pulmonary vascular disease) or downstream obstruction (i.e., pulmonary vein or mitral stenosis).
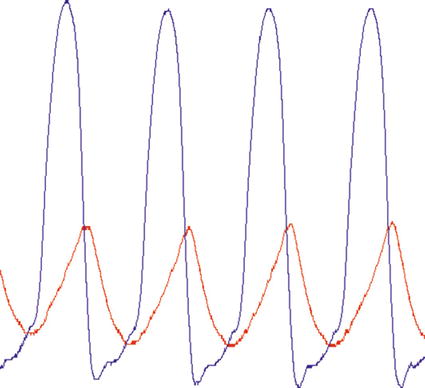
Fig. 9.3
A right ventricular trace in the presence of pulmonary valve stenosis. Note the triangular appearance contrasted to that in Fig. 9.2. Pressure transfer to the pulmonary artery is delayed and lower than that of the right ventricle due to the restricted outlet
9.3.4 Pulmonary Capillary Wedge Pressure
Pulmonary capillary wedge pressure (PCWP) is obtained during a right heart catheterization and is used as an estimate of left atrial pressure, and in the absence of pulmonary venous obstruction or mitral valve disease is a reflection of diastolic LV pressure (LVEDP). Normal mean PCWP values are between 2 and 12 mmHg. To measure the PCWP, a balloon-tipped end-hole catheter is maneuvered into a distal pulmonary artery and, with balloon inflation, occludes flow. This creates a static column of blood between the wedged balloon and the left atrium which reflects the pressure waveform of the left atrium. PCWP wave morphology resembles the left atrial waveform with positive a and v waves and negative x and y descents. The pressure tracing appears slightly damped and delayed (40–140 ms) relative to the left atrial waveform as the pressure wave must travel through the pulmonary capillaries. When assessing the PCWP, the operator should be careful and avoid balloon overinflation. This can occur with over-wedging which presents a false PCWP without recognizable a and v waves or can lead to pulmonary artery rupture which can be life-threatening. The PCWP measurement varies with the respiratory cycle where intrathoracic pressures vary with respiration and are transmitted to the pulmonary vasculature. Accordingly, the end-expiratory wedge pressure is often used when measuring the PCWP.
9.3.5 The Left Atrium
The left atrial (LA) pressure waveform has essentially the same shape as described for the right atrial pressure waveform, but the pressure is slightly higher with a dominant v wave. Normal mean pressures range between 5 and 12 mmHg. While LA pressure can typically be assessed indirectly by measuring the PCWP, direct measurement can be achieved in patients with an open communication at the atrial level (i.e., patent oval foramen or atrial septal defect) or by a transseptal atrial approach with a conventional transseptal needle or one having a radiofrequency tip. Such procedures can be guided by intracardiac echocardiography. An elevated a waves may be present in mitral stenosis or poor LV compliance. Great v waves may be seen in mitral regurgitation. The waveform will take the contour of an RV waveform in the presence of an atrial defect, with normalization of mean pressures.
9.3.6 The Left Ventricle
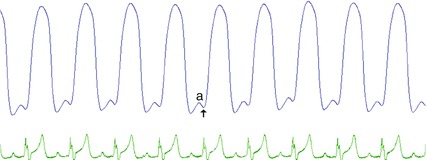
In adults, normal LV pressure is between 90–140 mmHg during systole and 5–12 mmHg at end diastole. In children, systolic and diastolic LV pressure varies with age. The same physiological events detailed for the RV apply to the left ventricle. However, the waveform is morphologically different from the RV with a squared off configuration, due in part to the higher vascular resistance and time course of pressure decay (Fig. 9.4). When the mitral valve closes, there is a rapid upstroke during early isovolumetric contraction. Once pressure exceeds the pressure in the aorta, the aortic valve opens and blood is ejected into the systemic circulation, often with a prominent anacrotic notch. Ventricular pressure continues to rise during the ejection phase of systole and equals aortic pressure. As pressure in the LV begins to fall during relaxation, the aortic valve closes once pressure in the aorta exceeds LV pressure, marked by a dicrotic notch, which denotes the end of systole. As the pressure drops during isovolumetric relaxation, to below that of the left atrium, the mitral valve opens and diastole filling begins. Similar to what has been described for the RV, early and late filling phases of the LV show a slow gradual increase in pressure with atrial contraction contributing the remaining 10–25 % of ventricular filling, where LVEDP is reached just before the abrupt rise in systolic pressure. End-diastolic pressure is measured coincident with the R wave of the ECG or post a wave and should be labeled as a post “a” wave measurement of LVEDP, distinct from the nadir of LV pressure at the end of isovolumetric relaxation (early filling). If an increased a wave (atrial contraction) is present before the LVEDP, poor compliance of the LV may be suspected. Additionally an elevated LVDEP is considered a marker of reduced diastolic performance and heart failure.
 < div class='tao-gold-member'>


Only gold members can continue reading. Log In or Register to continue
Stay updated, free articles. Join our Telegram channel
Full access? Get Clinical Tree
