Our understanding of the hemodynamic consequences of cardiac pacing has evolved dramatically over past decades. Dual-chamber pacing, rate-responsive pacing, rate-adaptive and differential atrioventricular (AV) intervals, alternative-site pacing, ventricular pacing avoidance algorithms, ventricular rate regularization and cardiac resynchronization therapy are all attempts to mimic and/or restore normal cardiac conduction and physiology.
Application of the appropriate pacing therapy first requires understanding of normal physiology, the various interrelated components contributing to the normally functioning cardiovascular system, and the effects of cardiac and noncardiac diseases on these individual components as well as on function of the whole. Given that our understanding of cardiac function in normal and abnormal conditions is incomplete and that current technology is imperfect, the goal to mimic the normal cardiovascular system perfectly under all conditions has yet to be met. Nevertheless, hemodynamically optimized pacing continues to attract intense interest as technologic advances bring us closer to that goal.
Cardiovascular Physiology
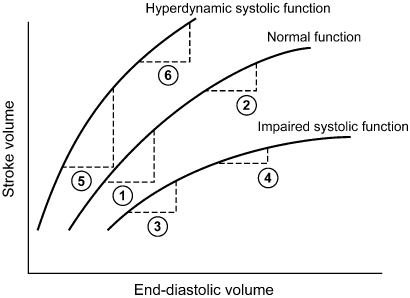
Challenge to the cardiovascular system, such as exercise or emotion, usually results in an increase in cardiac output, which is determined by heart rate and stroke volume. The relative contribution of each is variable and in part determined by age, the type and intensity of activity, baseline cardiovascular conditioning, and whether there is underlying disease (Fig. 2.1).
Fig. 2.1 Left ventricular (LV) function curve indicating the relationship between LV end-diastolic volume and stroke volume. Normal LV function is represented by the middle curve. If LV systolic function is on the ascending limb of the curve, an increase in end-diastolic volume results in a significant increase in stroke volume (1). This increase is even greater for patients with hyperdynamic systolic function (5) and less for patients with impaired systolic function (3). At greater end-diastolic volumes, i.e., higher LV filling pressures, further increasing the end-diastolic volume results in smaller increments in stroke volume. Even though patients with normal (2) or hyperdynamic (6) LV function may have a greater absolute increase in stroke volume, any increase in stroke volume for patients with LV dysfunction may be critically important (4).
(Modified from Greenberg B, Chatterjee K, Parmley WW, Werner JA, Holly AN. The influence of left ventricular filling pressure on atrial contribution to cardiac output. Am Heart J 1979; 98:742–51, by permission of Mosby.)
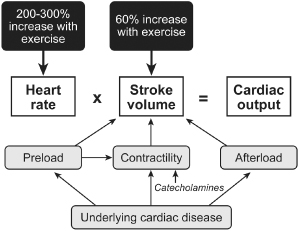
The cardiovascular demands incurred with exercise are usually met primarily by an increase in heart rate and secondarily by increases in stroke volume. Aerobically trained athletes can increase stroke volume proportionally more, thus enabling them to reach the same cardiac output with a smaller increase in heart rate. Stroke volume is defined as the amount of blood ejected with each ventricular contraction, i.e., end-diastolic volume minus end-systolic volume. In the normal heart, end-diastolic volume depends on diastolic filling pressure, total blood volume, distribution of that blood volume, and atrial systole (preload). End-systolic volume depends on myocardial contractility and afterload. The Frank–Starling law relates the degree of left ventricular (LV) filling pressure to cardiac output at various degrees of contractility (Fig. 2.2).
Fig. 2.2 Determinants of cardiac output during exercise.
(Modified from Janosik DL, Labovitz AJ. Basic physiology of cardiac pacing. In: Ellenbogen KA, Kay GN, Wilkoff BL, eds. Clinical Cardiac Pacing. Philadelphia: WB Saunders Co., 1995:367–98, by permission of WB Saunders Co.)
All of these relationships are modulated by metabolic alterations, autonomic tone, pharmacologic agents, and the cardiac rhythm. For example, the increase in sympathetic tone associated with an increase in heart rate decreases the AV interval. Antiarrhythmic drugs can increase or decrease the heart rate at rest and in response to exercise, either by a direct effect on the sinus node or by effects on the autonomic nervous system.
Abnormal Physiology
A large segment of the pacing population has cardiac disease or other comorbidities that affect cardiac performance. These conditions can be characterized as those affecting heart rate, stroke volume, or both.
Chronotropic incompetence (an inadequate heart rate increase with exercise or stress) may be caused by isolated sinus node dysfunction, autonomic dysfunction, or drugs. Individuals with normal LV function may be asymptomatic at rest but experience symptoms with activity, depending on activity level, comorbid conditions (such as pulmonary disease), and the severity of chronotropic incompetence. Patients with significant LV dysfunction may be less tolerant of chronotropic incompetence because their impaired stroke volume makes them more dependent on heart rate to maintain cardiac output. Patients may be unaware of how symptomatic they are unless objectively evaluated.
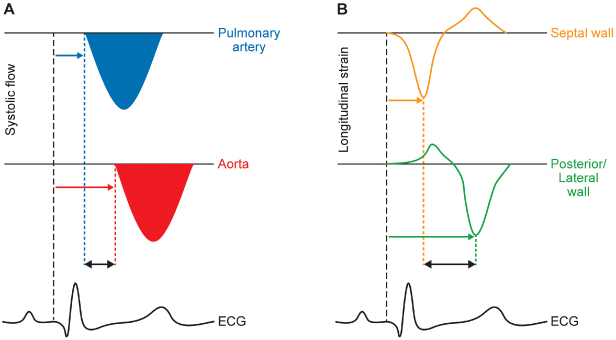
Myocardial contractility may be impaired by coronary artery disease, myocardial infarction, nonischemic cardiomyopathy, valvular disease, or pericardial disease. Patients with LV dysfunction regardless of cause are more dependent on preload and afterload to maintain optimal stroke volume. Many of these patients have associated conduction system disease, such as sinus node dysfunction, AV nodal disease, or His–Purkinje disease. AV dissociation and interventricular and intraventricular dyssynchrony can worsen already impaired myocardial performance. Interventricular dyssynchrony refers to activation of the right (RV) and left ventricles (LV) at different times; intraventricular dyssynchrony refers to temporal delay in mechanical contraction of different LVr segments (Fig. 2.3). It has been the focus of extensive study, as it adversely impacts clinical heart failure. Metabolic abnormalities, such as chronic acidosis, hypoxia, and hypercarbia, may depress cardiac performance. Patients with severe LV dysfunction may also have autonomic dysfunction that further limits the ability of the heart to increase heart rate and stroke volume with physiologic stress.
Fig. 2.3 Echocardiographic assessment of interventricular (A) and intraventricular (B) dyssynchrony. In (A), the flow of blood across the pulmonary valve (top) and aortic valve (middle) is charted as velocity (vertical axis) against time (horizontal axis). The difference in pre-ejection time (i.e., time delay from onset of the QRS [bottom] to onset of pulmonary or aortic flow), is a measure of interventricular dyssynchrony. In (B), the degree of myocardial tissue deformation (“strain”, in this case measured in the longitudinal plane) of the septal (top) and posterior/lateral (middle) walls is charted vertically. The difference in time to peak strain between the two opposing walls, as calibrated by the ECG (bottom), is a measure of intraventricular dyssynchrony.
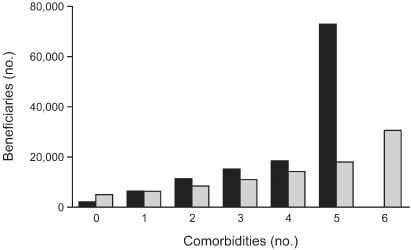
Many individuals with LV dysfunction have a number of associated comorbidities, e.g., concomitant renal failure, diabetes mellitus, coronary artery disease, hypertension, chronic obstructive pulmonary disease, and many others, all of which may affect indices of preload, afterload, and autonomic function as well as directly impair myocardial contractility (Fig. 2.4).1 Drugs used in the treatment of these conditions, atrial fibrillation, and coronary artery disease may further affect these functions and directly suppress intrinsic conduction. Understandably, determining which patients will benefit from hemodynamic pacing techniques and which pacing technique will most benefit any individual patient is complex and incompletely understood.
Fig. 2.4 Number of comorbidities per patient in congestive heart failure population (dark bars). Cost per additional comorbidity: total Medicare expenditures (light bars).
Reproduced from Braunstein JB, Anderson GF, Gerstenblith G, et al. Noncardiac comorbidity increases preventable hospitalizations and mortality among Medicare beneficiaries with chronic heart failure. J Am Coll Cardiol 2003; 42:1226–33, by permission of Elsevier.)
Basics of Hemodynamic Pacing
Chronotropic Response
Appropriate heart rate response during exercise, i.e., chronotropic competence, is the most important contributor to cardiac output, especially at moderate or extreme degrees of exercise (Fig. 2.5).2–4 At rest and at lower levels of activity, AV synchrony contributes significantly to achieving an appropriate cardiac output (Fig. 2.6). Because many paced patients are at the lower end of the activity curve most of the time and a significant proportion of these patients are also dependent on adequate preload because of decreased ventricular compliance, AV synchrony is perhaps just as important as rate responsiveness for achieving optimal cardiovascular hemodynamics in the typical patient. Restoration of both rate responsiveness and AV synchrony should be the goal of physiologic pacing and should be viewed as complementary.
Fig. 2.5 Schematic representation of the contribution of atrioventricular synchrony and rate response to cardiac output (CO) at various levels of activity. At rest and low levels of activity, maintenance of atrioventricular synchrony makes a proportionately greater contribution to cardiac output. At higher exercise levels, cardiac rate (HR) clearly contributes more to cardiac output.
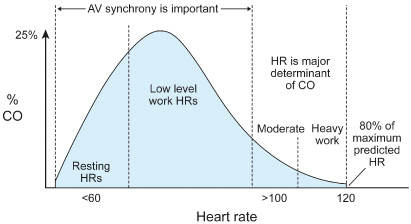
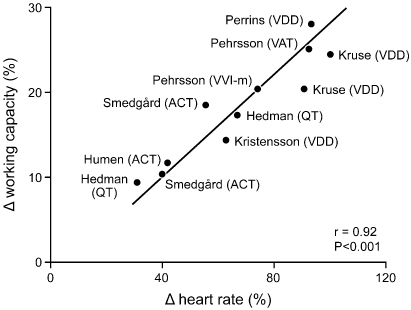
Fig. 2.6 Representation of multiple studies comparing the relative contribution of heart rate and atrioventricular synchrony to work capacity. All studies agree that heart rate is the greatest contributor during exercise. ACT, VVIR activity sensor; QT, VVIR QT sensor; VVI-m, rate-matched ventricular pacing.
(From Nordlander R, Hedman A, Pehrsson SK. Rate responsive pacing and exercise capacity: a comment. Pacing Clin Electrophysiol 1989; 12:749–51, by permission of Futura Publishing Co.)
Atrioventricular Dissociation and Ventriculoatrial Conduction
The earliest indication for pacing was complete heart block, and ventricular-only pacing was the only mode available. Establishing a stable ventricular rhythm was lifesaving and overshadowed the fact that normal cardiac function was not re-established. However, some patients experienced hemodynamic decline with this mode of pacing. Later it was established that hemodynamic impairment could be caused by ventriculoatrial conduction and atrial contraction against a closed AV valve, which could result in pacemaker syndrome.5 Ventriculoatrial conduction can activate mechanical stretch receptors in the walls of the atria and pulmonary veins (Fig. 2.7). Vagal afferents transmit these impulses centrally, and reflex peripheral vasodilatation results. In addition, various neurohormonal agents, such as atrial natriuretic peptide, are activated. Pacemaker syndrome may be manifested by a variety of symptoms and physical signs (Table 2.1; Fig. 2.8). Pacemaker syndrome was initially identified as a complication of VVI pacing; however, it may occur with any pacing mode when there is AV dissociation. It may also occur in persons with a markedly prolonged AV delay, with atrial systole effectively occurring concurrently with or after ventricular systole (Fig. 2.9).
Table 2.1 Pacemaker syndrome.
| Potential symptoms |
| Weakness |
| Chest pain |
| Syncope or near-syncope |
| Dyspnea |
| Cough |
| Neck pulsations |
| Apprehension |
| Abdominal pulsations |
| Potential physical findings |
| Hypotension |
| Congestive heart failure |
| Cannon “a” waves |
| Blood pressure decline during ventricular pacing |
| Decrease in cardiac output and arterial pressure |
| Increase in peripheral vascular resistance during monitoring |
Fig. 2.7 (A) Optimal cardiac filling with atrioventricular (AV) synchrony. (B) With VVI pacing, the ventricle is not optimally filled and there is contraction against a closed AV valve. (C) As a result of the loss of AV synchrony, venous pressure is increased, and multiple symptoms may ensue.
(From Levine PA, Mace RC. Pacing Therapy: A Guide to Cardiac Pacing for Optimum Hemodynamic Benefit. Mount Kisco, NY: Futura Publishing Co., 1983: 29, 36, by permission of the publisher.)
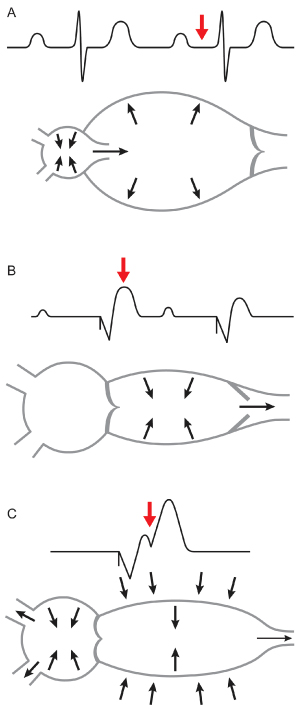
Fig. 2.8 Hemodynamic tracing from a patient with a VVI pacemaker. The arterial blood pressure increases with the transition from VVI pacing to normal sinus rhythm.
(From Hayes DL, Holmes DR Jr. Hemodynamics of cardiac pacing. In: Furman S, Hayes DL, Holmes DR Jr, eds. A Practice of Cardiac Pacing, 3rd edn. Mount Kisco, NY: Futura Publishing Co., 1993: 195–218, by permission of Mayo Foundation.)
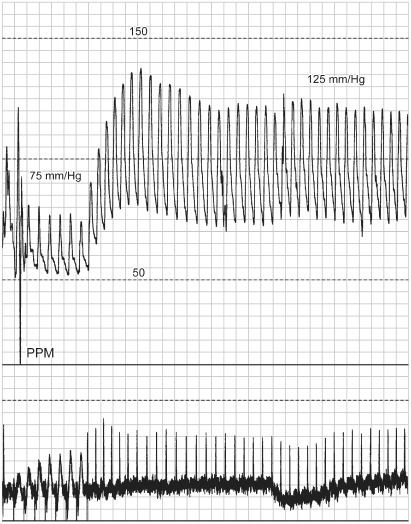
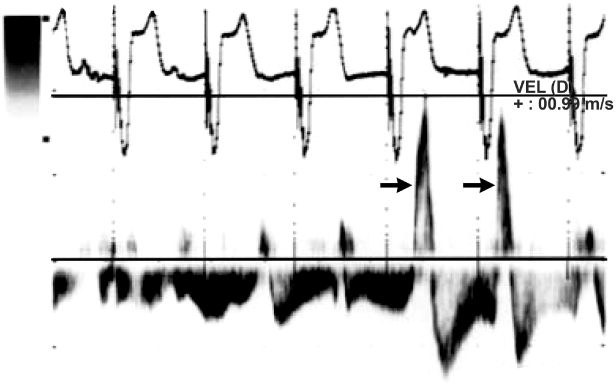
Fig. 2.9 Right-sided pacemaker syndrome. Pulsed wave hepatic vein Doppler from an 81-year-old man with heart failure and a history of atrioventricular conduction block treated with a VVI pacemaker. Transthoracic echocardiography indicated normal ventricular systolic function, elevated right ventricular systolic pressures, and a dilated inferior vena cava. Arrows point to hepatic vein flow reversals in timing with atrial systole, consistent with canon-waves. After upgrading to a DDD pacemaker was accompanied by resolution of clinical signs of heart failures and normalization of right ventricular systolic pressures as well as the above flow reversals.
(From de Zuttere D, Galey A, Jolly G, Rocha P. Diagnosis of pacemaker syndrome by suprahepatic vein pulsed Doppler echocardiography. Eur J Echocardiogr 2011; 12:E25, with permission of the publisher.)
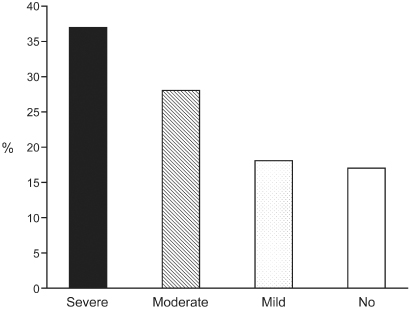
The prevalence of pacemaker syndrome is difficult to determine and depends in part on how it is identified. Older studies evaluating objective clinical impairment with pacing in a nontracking mode suggest that the incidence may be in the range of 7–10%.6 In a substudy of the Mode Selection Trial (MOST) trial, investigators noted the development of “severe” pacemaker syndrome in approximately 20% of patients paced in the VVIR mode. Improvement was noted with reprogramming to a dual-chamber pacing mode.7 However, in an older crossover study8 of patients with pacing in each of the DDD and VVI modes for 1 week in randomized order, 83% of subjects experienced some degree of pacemaker syndrome with pacing in the VVI mode. This finding suggests that when patients have a basis for comparison, they are more aware of symptoms of pacemaker syndrome (Fig. 2.10).
Fig. 2.10 Degree of symptoms detected in patients randomized to DDD and VVI pacing modes. Overall, 83% of patients had some symptoms consistent with pacemaker syndrome.
(Modified from Heldman D, Mulvihill D, Nguyen H, et al. True incidence of pacemaker syndrome. Pacing Clin Electrophysiol 1990; 13:1742–50, by permission of Futura Publishing Co.)
Atrioventricular Synchrony
The contribution of AV synchrony to maintaining physiologic cardiac performance is well established. AV synchrony is estimated to increase stroke volume by as much as 50% and in normal hearts may decrease left atrial pressure and increase cardiac index by as much as 25–30%. Although patients with normal ventricular function may have the greatest absolute degree of improvement with restoration of AV synchrony, a greater degree of relative improvement is typical in patients with severe LV systolic dysfunction. In these patients, any improvement derived from appropriately timed atrial systole may be beneficial.
Mitral valve closure and diastolic filling are influenced by the timing of atrial and ventricular contraction. Identifying the optimal AV interval for a given patient can be difficult. Regardless of whether the AV interval is programmed too long or too short, optimal AV interval timing leads to premature mitral closure. If the AV interval is too long, ventricular contraction does not immediately follow atrial emptying. Thus, the AV valves “float” back towards the atria, resulting in near closure of these valves prior to the onset of ventricular systole. This results in a soft first heart sound and, when extreme, regurgitation of blood through the AV valves during diastole (diastolic AV regurgitation). If the AV interval is unduly short, ventricular contraction and closure of the AV valves occurs before completion of atrial emptying. Because in patients with cardiomyopathy and heart failure there can be considerable differences in the timing of RV and LV contraction and relaxation, optimal AV closure for one side of the circulation may not be ideal for the other. Patients with severe diastolic dysfunction benefit even more from appropriately timed atrial systole because dependence on optimal preload is even greater to maintain satisfactory cardiac output.
The influence of pacing mode on factors indirectly but importantly related to cardiovascular performance has also been studied. P-synchronous pacing has been shown to result not only in significantly higher cardiac outputs than VVI pacing, but also in lower systemic vascular resistance, lower serum lactate levels, smaller AV oxygen gradients, and lower levels of circulating vasoactive peptides and norepinephrine.
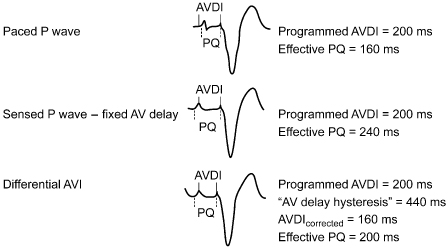
Mechanical AV delay varies between paced and sensed atrial beats because of the intrinsic delay in atrial activation after atrial pacing, i.e., intra-atrial conduction. The absolute intra-atrial conduction delay varies significantly among patients and also depends on underlying conduction or myocardial disease (Fig. 2.11). The right intra-atrial conduction time is measured from the beginning of the P wave, or the intracardiac signal recorded in the upper right atrium, to the onset of atrial depolarization in the para-Hisian bundle region. The normal right intra-atrial conduction time is usually between 30 and 60 ms. Interatrial conduction time, measured from the beginning of the P wave or depolarization in the upper right atrium to the onset of left atrial depolarization, is recorded at the level of the distal coronary sinus. The interatrial conduction time is generally between 60 and 85 ms.9 Taking the interatrial and intra-atrial delay into consideration and programming the differential AV interval accordingly will result in improved hemodynamics.10
Fig. 2.11 A differential atrioventricular interval (AVDI) attempts to correct for the timing differences between a paced and a sensed atrial event. When the atrium is paced, the atrioventricular interval (AVI) begins with delivery of the pacing artifact. However, there is latency between delivery of the pacing artifact and actual depolarization. Depending on interatrial conduction time, the pacedsensed difference can be great. In this diagram, the AVI is programmed to 200 ms for each event, but the effective AVI is 160 ms after the sensed atrial event and 240 ms after the paced atrial event.
(From Janosik DL, Pearson AC, Buckingham TA, Labovitz AJ, Redd RM. The hemodynamic benefit of differential atrioventricular delay intervals for sensed and paced atrial events during physiologic pacing. J Am Coll Cardiol 1989; 14:499–507, by permission of the American College of Cardiology.)
Because intra-atrial conduction delay varies from patient to patient and the relative timing of left and right atrial contraction depends on the actual site in the atrium of earliest activation, it can be very difficult to predict consistently when atrial systole will actually be complete for both atria (Fig. 2.12). Added to this, the extent of intra-atrial conduction delay is dependent on the site of activation (pacing site within diseased/scarred area, etc.) during atrially paced complexes, further complicating the issue. Clues on the ECG that suggest echocardiographic AV optimization may be particularly helpful include a P-wave duration >120 ms, an absent or negative PR segment, and notching and/or isoelectric periods during the inscription of the P wave. In practice, with the exception of cardiac resynchronization devices, echocardiographic optimization is rarely performed. Programming the AV interval is discussed further below.
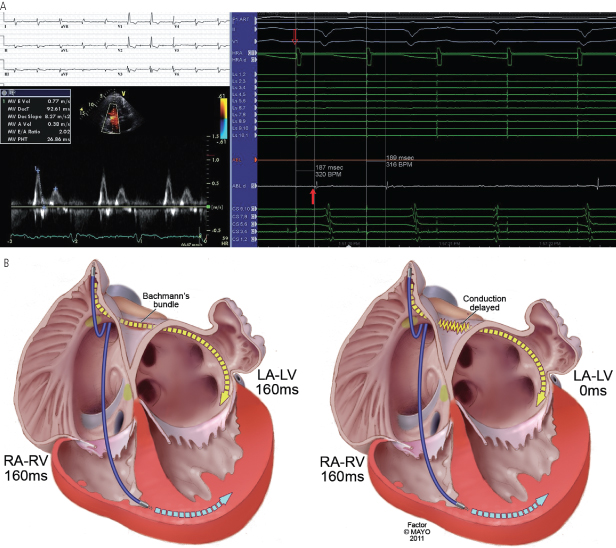
Fig. 2.12 Interatrial conduction delay. The PR interval or the paced AV interval does not always correlate with LA–LV timing. In (A), despite a markedly prolonged PR interval (380 ms, top left), the timing of the mitral valve Doppler inflow (bottom left) is normal on account of a delay of 187 ms (right) between the right (hollow arrow, paced signal) and left (filled arrow, sensed signal) atria as determined by intracardiac electrograms.
(Courtesy of Dr. Brian Powell, Mayo Clinic, Rochester, MN).
(B) With normal conduction (A), an adequate delay in the paced RA–RV interval results in an adequate LA–LV interval. In B, interatrial delay results in a delayed LA activation, such that the effective LA–LV interval results in simultaneous LA and LV contraction, or the equivalent of a left-sided pacemaker syndrome.
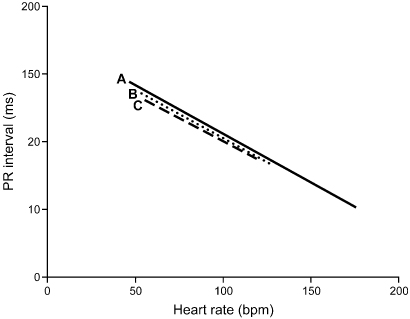
In addition to independently programmable paced and sensed AV intervals, dual-chamber pacemakers provide rate-adaptive AV intervals. Conduction time through the AV node normally decreases because of sympathetic nervous system activity with physiologic increases in heart rate, resulting in shorter AV intervals at higher heart rates. Any variation in heart rate has been demonstrated to result in an immediate, precise, and inversely proportional variation in the AV interval in normal hearts.11 A linear relationship exists between heart rate and the AV interval, independent of age or baseline PR interval (Fig. 2.13).12 In patients with conduction system disease or autonomic dysfunction, the AV delay may not shorten with heart rate increase. Rate-adaptive AV interval attempts to mirror normal physiology and allow a higher maximal tracking rate, and has been shown to improve hemodynamic indices during exercise compared with those with a fixed AV interval.11,13
Fig. 2.13 Linear regression of PR interval (ms) and heart rate (bpm) from electrocardiograms of young healthy subjects (A), older healthy subjects (B), and patients after myocardial infarction (C). Linear shortening of the interval occurs as exercise intensity increases.
(From Rees M, Haennel RG, Black WR, Kappagoda T. Effect of rate-adapting atrioventricular delay on stroke volume and cardiac output during atrial synchronous pacing. Can J Cardiol 1990; 6:445–52, by permission of Pulsus Group.)
Optimization of the AV interval has been a source of frustration for many years. When dual-chamber pacemakers were first introduced and only a fixed AV interval was possible, very simple programming guidelines were followed. In general, if the patient had intact AV conduction, the AV interval was programmed long enough to allow intrinsic conduction. If the patient had AV block, the AV interval was programmed to mimic what was considered to be a normal PR interval, i.e., 150–200 ms. However, this outdated approach fails to account for the previously described mechanical intra-atrial delay from atrial pacing to atrial depolarization, the effect of any interatrial conduction delay, and the deleterious effects of RV apical pacing that may be avoided if a significantly longer AV interval allows intrinsic conduction to occur. In addition, optimization of the AV interval becomes a significantly more important hemodynamic issue with the introduction of cardiac resynchronization therapy.
Atrioventricular Optimization
Optimizing the AV interval serves to optimize LV preload. Selection of the best AV interval often depends on echocardiographic or invasive hemodynamic measurement. Patients who require biventricular systems typically have abnormal and variable intra-atrial and intraventricular conduction. This makes the prediction of left-sided atrial ventricular mechanical delay difficult using right atrial pacing. Thus, a given AV interval will result in markedly different left-sided AV mechanical delays in different patients based on their individual intra-atrial and intraventricular conduction delay. The site of both ventricular and atrial leads also impacts optimization of AV timing. For example, an atrial lead placed on the intra-atrial septum with an LV lead placed near the base of the LV will give rise to a completely different AV mechanical interval than a right atrial appendage position used with LV apical pacing, even though the AV interval is set similarly.
The rationale for cardiac resynchronization therapy is primarily to normalize the ventricular activation sequence and coordinate septal and free wall contraction, thereby improving cardiac efficiency.14 Although this primary utility of ventricular resynchronization is independent of AV conduction and mechanical AV delays, an incremental benefit above that achieved with ventricular resynchronization has been demonstrated with a range of ideal AV delays,15 and others have demonstrated the effects of suboptimal AV delays in heart failure.16 With long AV delays, there is a suboptimal contribution of atrial systole. This gives rise to diastolic mitral regurgitation and limits the diastolic filling that occurs as a result of active atrial systole. Shortening the AV delay decreases the amount of diastolic mitral regurgitation and dilated cardiomyopathy, thereby decreasing pulmonary capillary wedge pressures, etc. Conversely, an AV delay that is too short gives rise to a suboptimally shortened filling period for the LV and thus decreased preload and cardiac output.
The degree and extent of intra-atrial conduction delay in patients with heart failure and abnormal heart is highly variable. In the normal state, sinus impulses from the right atrial–superior vena caval junction reach the left atrium primarily through the roof of the atrium (Bachmann’s bundle) and secondarily through the fossa ovalis and the musculature of the coronary sinus.17 Once the impulse reaches the atria, a distinct sequence of activations involving predictable differences in activation of the posterior atrium, left atrial appendages, and pulmonary vein are observed. While this intra-atrial conduction is occurring, conduction via the AV node to the ventricle is also occurring. In patients without bundle branch block there is near-simultaneous activation of the right and left mid endocardial surfaces of the intraventricular septum. With AV pacing using a right atrial appendage lead and a RV apical lead configuration, increased intra-atrial conduction delay may give rise to near-simultaneous left atrial and LV activation, producing the equivalent of a left-sided pacemaker syndrome (Fig. 2.12). On the other hand, placement of the atrial lead in the Bachmann’s bundle region in a patient with insignificant intra-atrial conduction delay, but with significant conduction delay from the RV pacing site to the LV, will cause marked prolongation of the left-sided mechanical AV interval. Intra-atrial conduction delay also affects the AV interval during atrial sensing. During atrial tracking, right atrial events are sensed after the onset of atrial depolarization. In some patients, sinus activation occurs first on the septal side of the right atrial superior vena caval junction. There may be marked intra-atrial delay from this site to the right atrial appendage where the pacing lead is required. In these patients, by the time the atrial event is sensed, left atrial activation may be ongoing or even completed, giving rise to a very long left atrium to LV mechanical delay with usual AV timing.
Thus, the location of the atrial, the RV and the LV leads, the magnitude and difference between intra-atrial conduction and intraventricular conduction delay and the lead function at any given time (atrial pacing vs. sensing) all impact LA–LV mechanical intervals in a manner that is difficult to predict.18
LV end-diastolic pressures may change significantly based on the actual AV delay, and this change is largely independent of the site of ventricular pacing.18 LV contractility as measured as dP/dt is also affected by the AV delay, and this effect is incremental to the benefit seen with LV-based pacing over RV pacing.19 In the PATH-CHF trial, a hemodynamic benefit as seen with increased LV maximal dP/dt and increased impulse pressure was demonstrated with either LV or biventricular pacing in comparison with RV-based pacing. The effect, however, was seen best at AV delays between 25% and 75% of the intrinsic PR interval.15 A benefit of LV free-wall pacing when compared with an anterior site in the LV when measuring a percent increase in dP/dt has also been demonstrated. This effect was also optimal at AV delays between 50 and 100 ms and prolongation of the AV delay showed a decrease in this beneficial effect on contractility irrespective of the site of pacing.20
Principles of Echocardiographic Atrioventricular Optimization
The AV or PR interval is usually simply measured from either the atrial pacemaker artifact or from the start of the P wave to the beginning of the QRS complex. The mechanically relevant AV interval is the time between mechanical atrial contraction and ventricular contraction. The echocardiographic parameter most useful in studying the filling characteristics of the LV is the mitral valve inflow Doppler velocity. The mitral valve inflow pattern in sinus rhythm is biphasic. Distinct filling waves can be recognized (Fig. 2.14). The first is the early filling wave (E wave). This represents blood flow into the LV during diastole. The velocity and magnitude of this flow are dependent primarily on the relaxation characteristics of the LV. The second distinct wave is the A wave, which occurs only in sinus rhythm and is from active atrial contraction. Because of electromechanical delays in the atrium and the ventricle there is a distinct interval between the start of the P wave and the start of the A wave measured by mitral Doppler inflow. In fact, the QRS complex itself is usually inscribed typically before the start of the A wave. When the PR–AV interval is short, the QRS is inscribed early and this results in aortic ejection and mitral valve closure occurring (forced by ventricular contraction) prior to complete inscription of the atrial Doppler inflow (truncation of the A wave) (Fig. 2.15). Thus, with short AV delays, diastolic flow is limited and the full benefit of atrial contraction is not obtained. This is important in all patients with heart failure, but extremely important in patients with significant diastolic dysfunction/relaxation abnormality. In these patients, because of problems with ventricular relaxation, the E wave is limited and a greater portion of diastolic filling is from atrial systole and the A wave. Conversely, with a long AV interval (PR interval) the A wave is completed. However, a significant gap between the end of atrial filling (A wave) and the beginning of ventricular contraction and aortic ejection occurs. During this delay the mitral valve has passively closed (soft first heart sound) and diastolic mitral regurgitation may occur. Thus, in an optimal AV interval the atrial filling wave has completed and there is no excessive delay between this completion and the beginning of aortic ejection. Most methods of echocardiographic AV optimization use this principle. In one technique the mitral inflow Doppler velocity and aortic outflow are continuously monitored echocardiographically. During this monitoring the AV interval is first set at or about the patient’s intrinsic PR interval (long AV interval). The AV interval is then progressively shortened until truncation of the A wave is just seen. This AV interval with or without a small positive offset is taken as the optimized AV interval. Using the principle that optimal AV delay results when spontaneous mitral valve closure occurs at about the same time as forced closure (ventricular contraction) and therefore aortic ejection, Ritter et al.21 have described the following method. Initially, a short AV delay (AV1) is programmed and the interval between the onset of the QRS to the end of the truncated A wave (QA1) is measured (Fig. 2.16). Next there is a long AV delay (AV2) that maintains ventricular capture (prior to spontaneous AV conduction), but allowing mitral valve closure before aortic ejection is measured (Fig. 2.16). The interval between the start of the QRS to the end of the nontruncated A wave is noted (QA2). The optimal AV interval according to the Ritter calculation is AV1 + [(AV2 − AV1) − (QA1 − QA2)] (Fig. 2.17). Thus, the greater the difference in the AV interval that allows complete inscription of the A wave and the short AV interval the larger the optimal AV interval will be. On the other hand, a large difference between the start of the QRS and the end of the A wave when allowing for complete AV inscription (long atrial filling) will result in the optimal AV interval being short. Echocardiographic images demonstrating use of the Ritter method are demonstrated in Fig. 2.18.
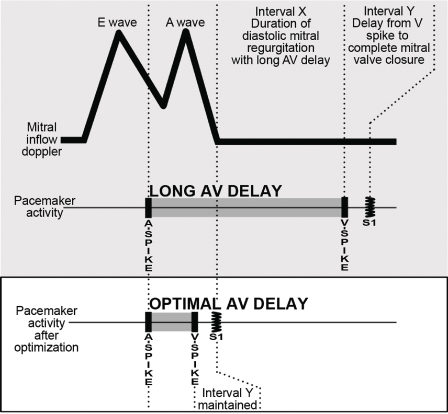
Fig. 2.14 There exists a significant delay between electrical and mechanical events that need to be understood to provide optimal atrioventricular programming in resynchronization devices. This figure shows the situation where the PR interval is too long following the electrical event (P waves). Diastolic mechanical flow from atrium to ventricle (the A wave) as a result of atrial contraction occurs slightly later. Similarly, following the QRS complex aortic ejection occurs after a definite and significant electromechanical delay interval. Because atrial filling has been completed and the ventricle has not yet started contracting, blood flows back into the atrium during diastole (diastolic mitral regurgitation). Programming a shorter PR interval (AV interval) will prevent this from occurring.
(From Hayes DL, Wang P, Sackner-Bernstein J, Asirvatham S. Resynchronization and Defibrillation for Heart Failure: A Practical Approach. Blackwell-Futura, 2004: 145. Copyrighted and used with permission of Mayo Foundation for Medical Education and Research.)
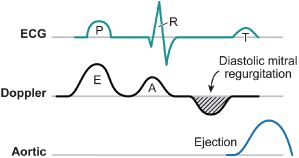
Fig. 2.15 The situation when the P–R interval is too short. Now ventricular systole (mechanical contraction of the ventricle) occurs even before complete emptying of the atrium (truncation of the A wave). Thus, in a mechanical sense the patient is the equivalent of atrial fibrillation (no effective hemodynamic contribution of the atrium).
(From Hayes DL, Wang P, Sackner-Bernstein J, Asirvatham S. Resynchronization and Defibrillation for Heart Failure: A Practical Approach. Blackwell-Futura, 2004: 145.)
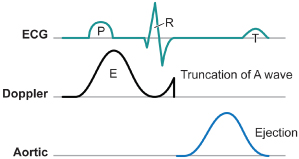
Fig. 2.16 Echocardiographic example for atrioventricular (AV) delay optimization. With the short AV delay, truncation of the A wave is seen. Gradually lengthening the AV delay takes away the truncation while further lengthening (long AV delay) allows diastolic mitral regurgitation (see text).
(Data from Ritter P, Dib JC, Mahaux V, et al. PACE 1995; 18:855 (abstract). Reproduced with permission from Blackwell Publishing.)
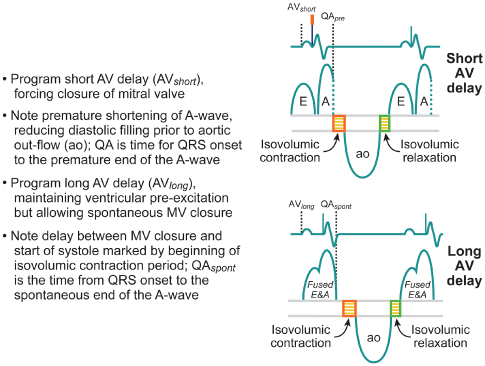
Fig. 2.17 Calculation of the optimal atrioventricular (AV) interval using the Ritter formula.
(Data from Ritter P, Dib JC, Mahaux V, et al. PACE 1995; 18:855 (abstract). Reproduced with permission from Blackwell Publishing.)
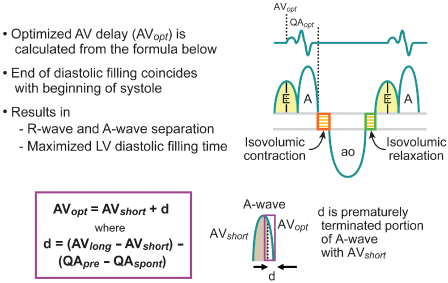
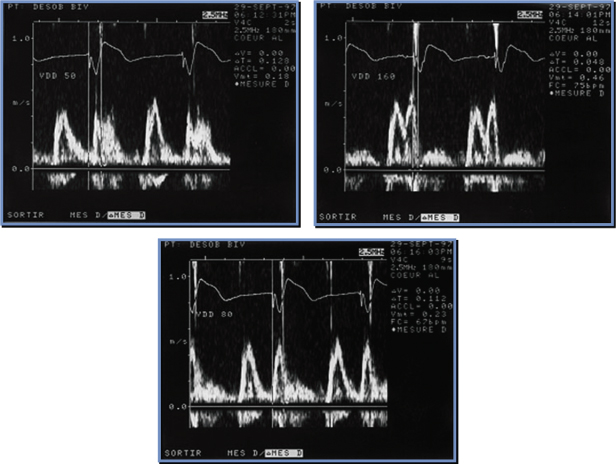
Fig. 2.18 Echocardiographic images demonstrating the Ritter method for atrioventricular (AV) interval optimization. The upper left panel obtained with a short AV interval; upper right panel obtained with a long AV interval; lower panel demonstrates optimal separation of E and A waves.
An alternative method for AV optimization was also proposed many years ago (Fig. 2.19).22 In this somewhat simpler method, a slightly prolonged AV delay is set. From this number is subtracted the interval between the end of the A wave and complete closure of the mitral valve. This interval from the end of the A wave to the beginning of aortic ejection or complete closure of the mitral valve is the duration of diastolic mitral regurgitation. Thus, from a single long AV interval the optimal AV interval can be calculated. The steps for using the Ishikawa method would be to set a long AV interval and measure the mitral Doppler inflow. The interval between the end of the complete A wave and the beginning of aortic ejection can be measured. This measurement is subtracted from the long AV interval.
Fig. 2.19 Ishikawa method for atrioventricular (AV) optimization (see text).
(Modified from Ishikawa T, Sumita S, Kimura K, et al. Critical PQ interval for the appearance of diastolic mitral regurgitation and optimal PQ interval in patients implanted with DDD pacemakers. Pacing Clin Electrophysiol 1994; 17:1989–94.)
Several observations with regard to AV optimization in the PATH-CHF study also allow for relatively simpler AV interval optimization. Patients with a wide QRS complex demonstrated shorter optimal AV delay sensations with a narrow QRS complex. This is likely to be because intraventricular conduction delay is more prominent than interatrial conduction delay. The optimal average AV interval for patients with a QRS >150 ms was 43% of the intrinsic AV interval. On the other hand, for patients with a normal or narrower QRS, optimal AV intervals were about 80% of the intrinsic AV interval. This, of course, will be affected by the position of the LV lead. For example, if the LV lead is located at a site causing early aortic ejection, then a longer AV interval despite the wider QRS will be required.
Acute hemodynamic studies suggest that optimal ventricular contractility is further enhanced in individual patients when a patient’s specific AV interval is programmed. It has been shown that there is a close correlation between impedance-measured AV interval and echo Doppler-derived AV interval and externally applied impedance signals are a relatively straightforward bedside method to adjust the AV interval.23–25
A major weakness that remains is the inability to optimize the AV interval during exercise. Optimization of the AV interval at rest does not reflect the optimal AV interval during exercise, which can be longer, shorter, or the same as that at rest.26 Programming the AV delay during exercise results in superior exercise hemodynamics than derivations from the resting AV delay.26 Techniques have been hypothesized for AV interval optimization during stress in cardiac resynchronization systems.27 While adaptive algorithms to optimize the AV interval during exercise would be a step forward, several problems remain. The actual optimal AV interval during exercise may vary with loading conditions on the heart, e.g., when over-diuresis or incipient heart failure occurs. Even with real-time physiologic parameter monitoring as part of a feedback system, the optimal AV interval may be difficult to determine, as no single parameter may be representative of all factors that need to be considered. The optimal AV interval for diastolic function is difficult to determine; only measuring mitral inflow Doppler measurements and making sure that all of atrial contraction has contributed to diastole is probably too simplistic. Ventricular stretch, efficiency of ventricular relaxation, and optimization of early filling may involve different AV interval optimizing algorithms from systolic function optimization. Even if the AV interval has been carefully optimized, if radiofrequency ablation is performed in the atrium, antiarrhythmic drugs are used, or myocardial infarctions have occurred, a completely different relative atrial and ventricular timing may result. Another confounding variable is optimal RA–RV timing. The operator may perfectly optimize LA–LV timing, only to find that there is significant diastolic tricuspid regurgitation giving rise to hepatic engorgement and right-sided heart failure.
Atrial Mechanical Function
Enhanced atrial contraction should follow optimal atrial conduction. In a study of cardiac resynchronization therapy recipients, atrial sensed beats (allowing for intrinsic intra-atrial and interatrial conduction), compared with right atrial paced beats, resulted in improved LV output and filling as well as improved tissue Doppler strain indices of right and left atrial function and interatrial mechanical synchrony.28 Similarly, compared with those with interatrial delay, whether intrinsic or pacing-induced, atrial contraction and mechanical synchrony improved with pacing the right atrial septum, Bachman’s bundle, or with biatrial pacing.29–33 Whether these observations translate into clinically significant outcomes, such as long-term benefits with atrial remodeling and cardiac output, is currently unknown.
Effect of Pacing Mode on Morbidity and Mortality
An early study of the effect of pacing mode on morbidity and mortality34 paved the way for intense clinical interest in and subsequent clinical trials on the effect of pacing mode on morbidity and mortality and on the potential adverse effects of VVI pacing (Figs 2.20 and 2.21). In this early study, at 4 years of follow-up, atrial fibrillation had occurred in 47% of the patients receiving VVI pacing, but in only 7% of those receiving AAI pacing (P < 0.0005); heart failure occurred in 37% of the VVI group and in 15% of the AAI group (P < 0.005); and mortality was 23% in the VVI group and 8% in the AAI group (P < 0.025).
Fig. 2.20 Potential adverse clinical outcomes from VVI pacing. CVA, cerebrovascular accident.
(Modified from Gillis AM. Pacing to prevent atrial fibrillation. Cardiol Clin 2000; 18:25–36, by permission of WB Saunders Co.)
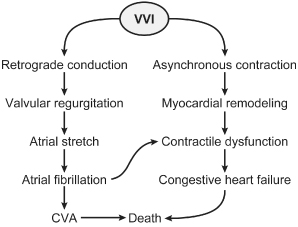
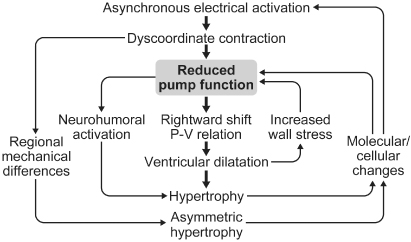
Fig. 2.21 Elegant representation of the adverse hemodynamic consequences of ventricular pacing.
(Reprinted with permission from Sweeney MO, Prinzen FW. A new paradigm for physiologic ventricular pacing. J Am Coll Cardiol 2006; 47:282.)
Many other investigators have performed retrospective reviews to assess the effect of pacing mode on mortality. Despite the inherent weaknesses of retrospective analyses, it is difficult to dismiss the similar finding among all the studies of significantly lower mortality with DDD or AAI pacing than with VVI pacing and significantly lower incidences of atrial fibrillation.35
Survival was assessed in a large population of patients (20,948) with sinus node dysfunction.36 This random sample was from the complete US cohort of Medicare patients receiving pacing for sinus node dysfunction in 1988 through 1990. The DDD/DDDR pacing mode was an independent correlate of survival.
A number of prospective trials have assessed the effect of pacing mode on morbidity and mortality. Andersen et al.37 published the first prospective data on pacing mode and survival. (This trial is referred to as the Andersen Trial or the Danish Pacemaker Trial.) Among 225 patients (mean age 76 years) with sinus node dysfunction randomized to AAI or VVI pacing, the incidence of atrial fibrillation was higher in the VVI group (AAI group 14%; VVI group 23%; P = 0.12) and the incidence of thromboembolism was also higher in the VVI group than in the AAI group (P = 0.0083). Although no difference in mortality could be detected at the initial analysis at 3.3 years, subsequent analysis at 5.5 years showed improved survival and less heart failure in the AAI group.38 In addition, there was a persistent reduction in the incidence of atrial fibrillation and thromboembolic events. This trial stands alone in demonstrating lower mortality with physiologic pacing. This may be explained by the fact that the physiologic pacing mode implemented was AAI mode. With AAI pacing, the patient maintains intrinsic AV conduction; perhaps more important, this avoids the abnormal depolarization pattern of RV pacing that would occur with VVI or DDD pacing.
In a smaller trial,39 paroxysmal atrial fibrillation occurred more frequently with VVI pacing than with DDD pacing. However, the Pac-A-Tach trial40 found no significant difference in recurrence of atrial tachyarrhythmias by intention to treat at 1 year—48% in DDDR and 43% in VVI.
The Pacemaker Selection in the Elderly (PASE) trial, a prospective, randomized, single-blind trial, compared DDDR with VVIR pacing modes.41 There was no statistically significant difference in quality of life between DDDR and VVIR pacing modes, but there was a trend toward improved quality of life in patients with sinus node dysfunction randomized to dual-chamber pacing. Perhaps more significant was a crossover of 26% of patients from ventricular pacing to dual-chamber pacing because of pacemaker syndrome.
The Canadian Trial of Physiologic Pacing (CTOPP)42 compared VVIR with DDDR or AAIR and had primary end-points of overall mortality and cerebrovascular accidents and secondary end-points of atrial fibrillation, hospitalizations for CHF, and death from a cardiac cause. CTOPP demonstrated that physiologic pacing (DDD/AAI) was associated with a reduced rate in the development of chronic atrial fibrillation, from 3.78% to 2.87% per year, at the 3-year analysis. No significant improvement in quality of life or mortality was demonstrated with dual-chamber pacing. However, there was a slight divergence of the mortality curves favoring dual-chamber pacing. In addition, quality of life was improved in subsets of patients. These included patients who were pacemaker-dependent and patients with severe diastolic or systolic dysfunction.43
The UK Pacing and Cardiovascular Events (UKPACE) trial compared DDD with VVI pacing modes in patients ≥70 years old who required permanent pacing for second- or third-degree AV block.43 UKPACE demonstrated no significant difference between pacing modes in the primary end-point of all-cause mortality or in the composite secondary end-point of cardiovascular deaths, atrial fibrillation, heart failure hospitalizations, cerebrovascular accidents or thromboembolic events, and reoperation.
Of the major trials assessing the effect of pacing mode on morbidity and mortality, the Mode Selection Trial (MOST) and subsequent substudies have probably had the most profound effect on the practice of pacing.44 MOST randomized 2010 patients with sinus node dysfunction to either VVI or DDD pacing. The primary end-points were all causes of mortality and cerebrovascular accidents. This trial failed to demonstrate any difference in mortality, but did demonstrate a lower incidence of atrial fibrillation with physiologic pacing and reduced the signs and symptoms of heart failure. Quality of life was slightly improved. The rates of hospitalization for heart failure and of death, stroke, or hospitalization for heart failure were not significant in unadjusted analyses, but with adjusted analyses became marginally significant. The study concluded that, overall, dual-chamber pacing offers significant improvement compared with ventricular pacing.
Substudies of the MOST trial,45 DAVID (Dual Chamber and VVI Implantable Defibrillator),46 and MADIT-II (Multicenter Automatic Defibrillator Trial II)47 have demonstrated the adverse effects of RV apical pacing when no ventricular pacing was required, i.e., the patient had intact AV conduction at some AR interval.
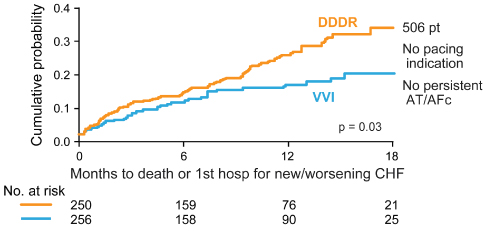
The DAVID trial was designed to assess the effect of dual-chamber pacing vs. backup ventricular pacing in patients with an implantable cardioverter-defibrillator (ICD) indication but no indication for antibradycardia pacing, no history of recurrent atrial arrhythmias and an LV ejection fraction of ≤40%.46 Patients were randomized to effectively no pacing, VVI backup pacing at 40 bpm, or DDDR pacing with a lower rate of 70 bpm. Dual-chamber pacing offered no advantage and actually increased the combined end-point of death or hospitalization for heart failure (Fig. 2.22).
Fig. 2.22 Survival in the DAVID trial. Survival was significantly improved in patients in whom ventricular pacing was avoided. DDDR mode vs. VVI mode an composite end-point of death or new/worsening heart failure hospitalization. In DDDR group, patients who survived to 3 months’ follow-up had worse 12-month event-free rates when percentage of RV pacing was >40% (P = 0.09).
(Reprinted with permission from Wilkoff BL, Cook JR, Epstein AE, et al. Dual-chamber pacing or ventricular backup pacing in patients with an implantable defibrillator: the Dual Chamber and VVI Implantable Defibrillator (DAVID) Trial. JAMA 2002; 288:3115–23. Copyrighted and used with permission of Mayo Foundation for Medical Education and Research.)
Given these findings, DAVID II48 tested the hypothesis that atrial pacing is as safe as VVI backup pacing. Six hundred patients with LV ejection fraction of 40% or less and meeting criteria for ICD placement were randomized to AAI (at 70 bpm) or VVI (at 40 bpm). No difference in mortality, heart failure, atrial fibrillation, or quality of life was seen between the groups.
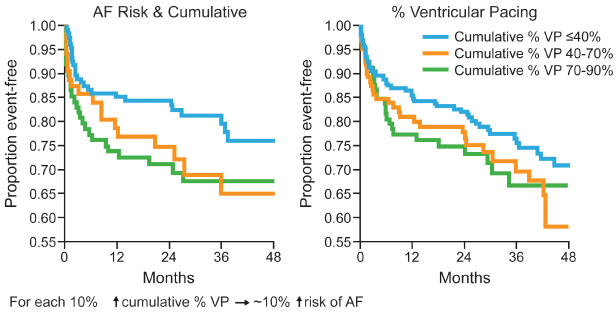
Investigators from the MOST trial demonstrated that in patients with a normal baseline QRS duration, cumulative percent of ventricular pacing is a strong predictor of hospitalization for heart failure, and the risk of atrial fibrillation also increased linearly with cumulative percent of ventricular pacing. This occurs even when AV synchrony is preserved (Figs 2.23 and 2.24).
Fig. 2.23 Sweeney and colleagues demonstrated a relationship between percentage ventricular pacing (VP) and subsequent hospitalization for heart failure and the occurrence of atrial fibrillation. DDDR mode, cumulative percentage VP and risk of first heart failure hospitalization (HFH). Risk of HFH increased between 0 and 40% with VP, but RR was level above 40% VP. Risk is reduced to about 2% if VP is minimized.
(Reprinted with permission from Sweeney MO, Hellkamp AS, Ellenbogen KA, et al. MOde Selection Trial Investigators. Adverse effect of ventricular pacing on heart failure and atrial fi brillation among patients with normal baseline QRS duration in a clinical trial of pacemaker therapy for sinus node dysfunction. Circulation 2003; 107:2932–7, by permission of American Heart Association.)
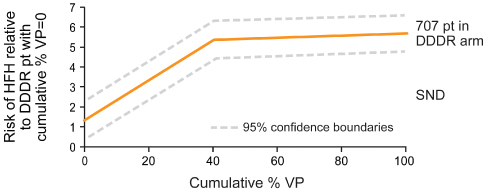
Fig. 2.24 From Sweeney and colleagues, a representation of the relationship between cumulative percentage ventricular pacing and the incidence of atrial fibrillation (AF).
(Reprinted with permission from Sweeney MO, Hellkamp AS, Ellenbogen KA, et al. Mode Selection Trial Investigators. Adverse effect of ventricular pacing on heart failure and atrial fibrillation among patients with normal baseline QRS duration in a clinical trial of pacemaker therapy for sinus node dysfunction. Circulation 2003; 107:2932–7, by permission of American Heart Association.)
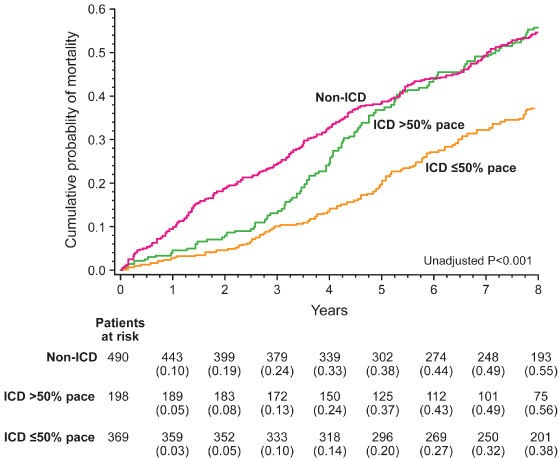
In the MADIT-II trial, patients with myocardial infarction and LV ejection fraction ≤30% were randomized to receive an ICD or conventional therapy. Those in the ICD group had a significant lower mortality. However, in those in whom the RV was paced more than 50% of the time, this mortality benefit was attenuated such that after 4 years there was no significant difference in mortality than in control subjects, whereas in those with <50% RV pacing the benefit in mortality was maintained (Fig. 2.25).49
Fig. 2.25 Outcome with right ventricular apical pacing in MADIT-II. Kaplan–Meier survival curve of participants in the MADIT-II trial, comparing implantable cardioverter-defibrillator (ICD) recipients with RV pacing >50% with ≤50%. Those with frequent RV pacing had a similar mortality to those stratified to the non-ICD arm of the trial. See main text.
(From Barsheshet A, Moss AJ, McNitt S, et al. Long-term implications of cumulative right ventricular pacing among patients with an implantable cardioverter-defibrillator. Heart Rhythm 2011; 8:212–8.)
These findings led to the development and widespread use of pacing algorithms that avoid ventricular pacing. Rather than placing a pacemaker capable only of atrial pacing and therefore not providing backup ventricular pacing in the event of AV block, ventricular pacing avoidance algorithms may dynamically alter the AV interval to allow intrinsic ventricular depolarization, and other algorithms may allow one or more P waves to occur without a subsequent pacemaker output in an effort to promote intrinsic ventricular depolarization (Figs 2.26 and 2.27). Three prospective trials (INTRINSIC RV, SAVE-PACe, and DANPACE) have investigated whether pacing modes and device algorithms that minimize RV pacing influence outcome. The INTRINSIC RV (Inhibition of Unnecessary RV Pacing With AVSH in ICDs)50 study tested the hypothesis that minimizing RV pacing using a device algorithm called AVSH (AV search hysteresis) was noninferior to VVI backup pacing. No difference in mortality or heart failure was seen at 1 year. The SAVE-PACe (Search AV Extension and Managed Ventricular Pacing for Promoting Atrioventricular Conduction)51 trial randomized 1065 patients with sinus node disease requiring dual pacemaker implantation to conventional dual-chamber pacing or dual chamber with features designed to permit automatic lengthening or elimination of the pacemaker’s AV interval in order to withhold ventricular pacing. There was no difference in mortality or heart failure between the two allocation groups, though there was an increase in atrial fibrillation with minimized ventricular pacing. In DANPACE (Danish Multicenter Randomized Trial on Single Lead Atrial Pacing versus Dual Chamber Pacing in Sick Sinus Syndrome),52 patients with sick sinus syndrome requiring pacemaker implantation were randomized to AAIR or DDDR. The two groups were similar with respect to mortality and heart failure occurrence. A surprising finding was a greater incidence of paroxysmal atrial fibrillation in the AAIR group. Reasons are unclear, but may relate to paradoxical effects in patients with pro-longed AV conduction. The findings are similar to the MVP (Managed Ventricular Pacing) trial53 assessing the equivalence of atrial pacing plus ventricular backup at 60 bpm versus ventricular backup at 40 bpm in a randomized study of 1030 ICD recipients. Patients were in sinus rhythm without bradycardia at baseline. The study was terminated prematurely because those with a PR interval of ≥230 ms had increased mortality and heart failure occurrence.
Fig. 2.26 Example of managed ventricular pacing. One QRS complex is allowed to “drop” in an effort to maintain intrinsic atrioventricular (AV) conduction and intrinsic ventricular determination.
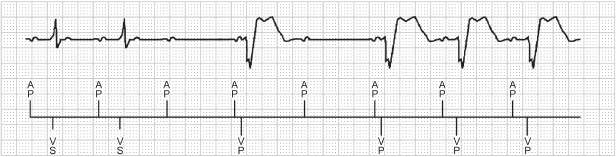
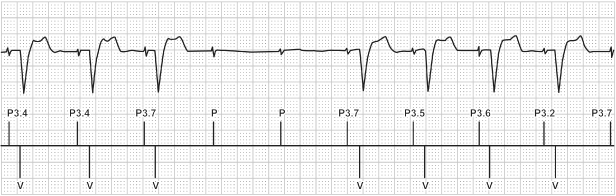
Fig. 2.27 Example of AAIR Safe Pace. Again, in an attempt to maintain intrinsic ventricular conduction, this algorithm will allow up to two P waves to occur without pacing.
Information emerging, but not yet published, from large cohorts of patients followed on remote-monitoring networks is concordant with the trials discussed above demonstrating lower mortality when unnecessary RV stimulation is avoided.
The potential advantage of extending RV pacing avoidance to cardiac resynchronization therapy (CRT) has also been studied. In one investigation, synchronized LV pacing, i.e., eliminating RV stimulation produced acute LV and systemic hemodynamic benefits similar to biventricular pacing. This pacing configuration provided superior RV hemodynamics compared with biventricular pacing.54
Optimal Ventricular Pacing Sites
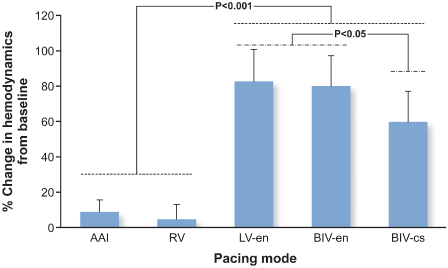
Given the potential adverse effects of RV apical pacing, significant attention has been given to other RV pacing sites that may avoid these adverse effects (Table 2.2). Although there is no definitive answer regarding optimal RV pacing site(s), there have been multiple studies assessing different pacing configurations and their impact on hemodynamics (Fig. 2.28). Tables 2.3 and 2.4 summarize some of the studies to date. Although a number of studies have now been published, many of the series are small, some involving long-term pacing and others short-term observation only, and overall there is no trend or concordance of the results. A series of trials are underway that may better address the issue.55
Table 2.2 Clinical studies of the adverse effects of right ventricular (RV) apical pacing.
Source: Manolis AS. The deleterious consequences of right ventricular apical pacing: time to seek alternate site pacing. Pacing Clin Electrophysiol 2006; 29:298–315, by permission of Blackwell Publishing.
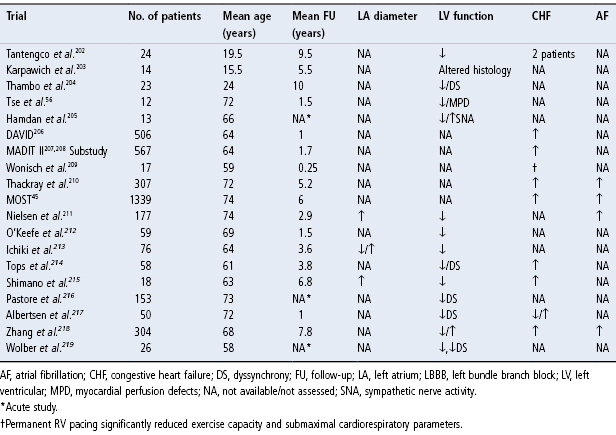
Table 2.3 Studies comparing hemodynamic and/or clinical effects of right ventricular (RV) apical pacing and alternate site pacing in the RV outflow tract (RVOT), RV septal (RVS), the His bundle (His), left ventricular (LV) or biventricular (Biv) site.
Source: Modified from Manolis AS. The deleterious consequences of right ventricular apical pacing: time to seek alternate site pacing. Pacing Clin Electrophysiol 2006; 29:298–315, by permission of Blackwell Publishing.
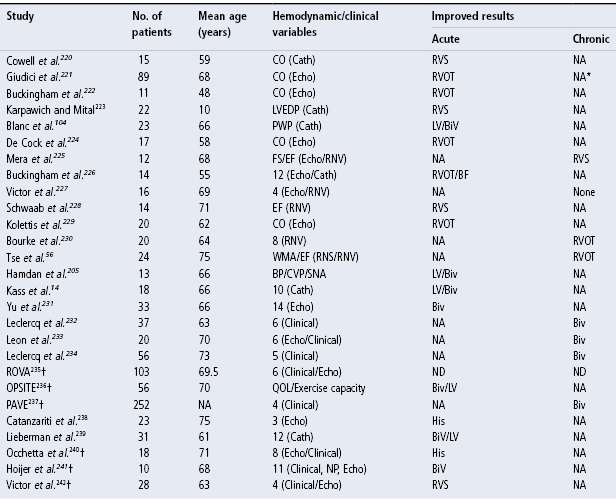
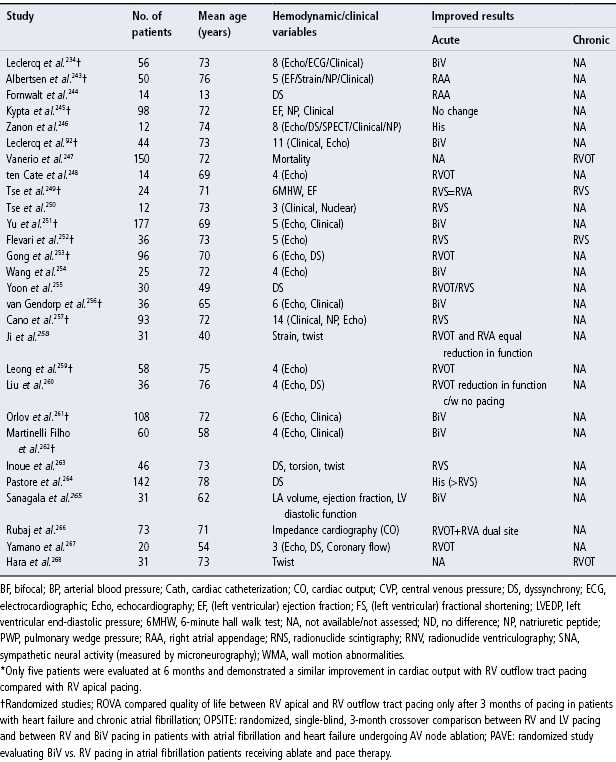
Table 2.4 Other studies of alternate site pacing.
Source: Manolis AS. The deleterious consequences of right ventricular apical pacing: time to seek alternate site pacing. Pacing Clin Electrophysiol 2006; 29:298–315, by permission of Blackwell Publishing.
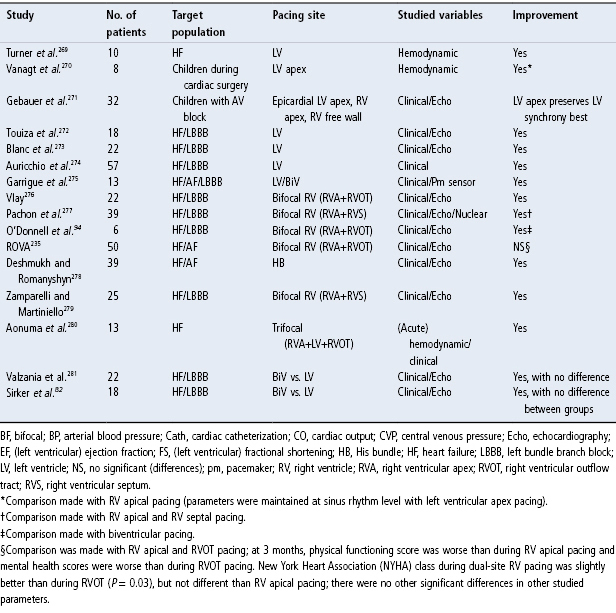
Fig. 2.28 Percentage change in hemodynamics from baseline by pacing mode in response to pacing at optimal site. AAI, atrial pacing only; BIV-cs, conventional CRT; BIV-en, DDD biventricular endocardial; LV-en, DDD LV endocardial; RV, DDD right ventricular.
(From Ginks MR, Lambiase PD, Duckett SG, et al. A simultaneous X-Ray/MRI and noncontact mapping study of the acute hemodynamic effect of left ventricular endocardial and epicardial cardiac resynchronization therapy in humans. Circ Heart Fail 2011; 4:170–9.)
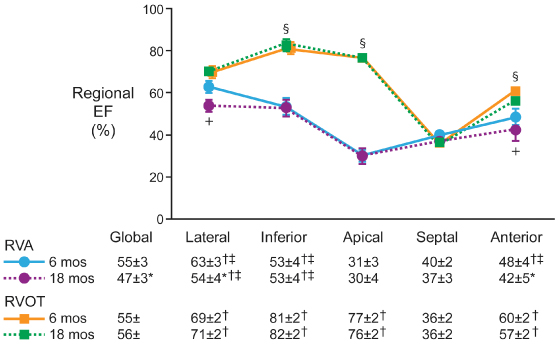
In a study of 24 patients randomized to RV apical or RV outflow tract (RVOT) pacing, the mean QRS duration was significantly longer with apical pacing than during outflow tract pacing (151 ± 6 vs. 134 ± 4 ms; P = 0.03). At 18 months, the incidence of myocardial perfusion defects (83% vs. 33%) and regional wall motion abnormalities (75% vs. 33%) were higher and LV ejection fraction (47 ± 3 vs. 56 ± 1%) was lower in those patients paced apically than in those patients with outflow tract pacing (all P < 0.05). Investigators concluded that preserving synchronous ventricular activation with RVOT pacing prevented the long-term deleterious effects of RV apical pacing on LV function and perfusion (Fig. 2.29).56 Inadvertently placing the lead onto the RV anterior or free wall instead of the septum results in a longer QRS duration (158.1 ± 4.7 ms vs. 140.7 ± 3.9 ms).57 The mid-RV septum and RVOT septum yield similar paced QRS duration.58,59 Reviews of procedural outcomes from large volume centers performing RVOT lead placement report it to be safe and durable.60,61
Fig. 2.29 Changes in regional ejection fraction comparing right ventricular apical (RVA) and RV outflow tract (RVOT) pacing groups studied by Tse. +P < 0.05 RVA 18 months vs. RVA 6 months; §P < 0.05 RVOT vs. RVA at 6 months and 18 months; *P < 0.05 compared with RVA pacing at 6 months; †P < 0.05 compared with septal region; ‡P < 0.05 compared with apical region; data are expressed as mean value ± SEM.
(From Tse HF, Yu C, Wong KK, et al. Functional abnormalities in patients with permanent right ventricular pacing: the effect of sites of electrical stimulation. J Am Coll Cardiol 2002; 40:1451–8, by permission of the American College of Cardiology.)
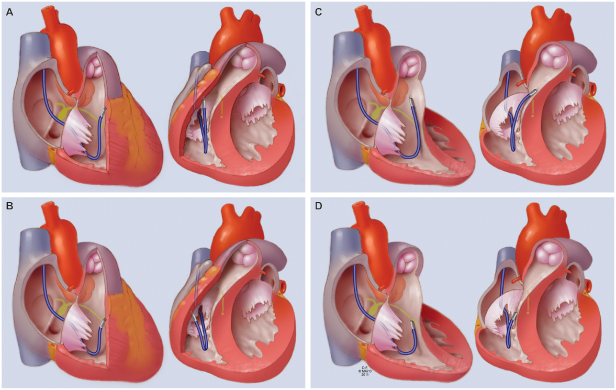
In addition to investigations of alternate RV pacing sites, there have been multiple additional studies that have investigated the hemodynamics of LV pacing, multisite RV pacing, and pacing the ventricles in three sites (Table 2.4). However, a definitive answer regarding the optimal ventricular pacing site(s) is still not available. Also, the literature is confusing because of the anatomic terms used to describe alternative RV pacing sites. The difficulty in comparing different ventricular pacing sites has led to proposed nomenclature to describe alternative RV pacing sites, i.e., other than the apical pacing site.60,62 The RVOT, once defined fluoroscopically as the area between the pulmonary valve above (the exact border of which can be discerned by the change in the local QRS signal as it is traversed) and an imaginary straight line extending from the apex of the tricuspid valve to the RV border, can be subdivided into high and low halves midway between these boundaries. Thus, the four recognized pacing sites in the RVOT are the high and low septum and the high and low free wall (Fig. 2.30). With RV septal pacing, the QRS in lead I is negative, whereas in RV free wall pacing it is positive. Pacing in the higher RVOT will result in a more positive QRS in a VF, and vice versa. The exact site of RVOT pacing is critical to the pattern of LV activation. For example, cephalad to the crista supraventricularis on the free wall, the wavefront of activation will spread to the RV significantly ahead of the intraventricular septum and LV. On the other hand, a posterior pacing site above the crista supraventricularis may pre-excite the LV free wall because of the myocardial architecture and direction of spiral lamination of the myocardium in this location. Further, the remnants of an extensive embryologic infra-Hisian conduction system (right superior fascicles) if present in a patient will result in more rapid and early conduction via the His–Purkinje system than in patients who do not have such remnants and thus rely entirely on intraventricular conduction for wave propagation.
Fig. 2.30 Alternative site RV septal and free wall pacing site. (A) High free wall. (B) Low free wall. (C) High septum. (D) Low septum. For each, the left image depicts orientation in the right anterior oblique fluoroscopic projection and the right depicts the left anterior oblique projection. See text for details.
(Adapted from the information in Vlay SC. Right ventricular outflow tract pacing: practical and beneficial: a 9-year experience of 460 consecutive implants. Pacing Clin Electrophysiol 2006; 29:1055–62.)
Pacing in Heart Failure
Heart failure affects approximately 1% of the over-65-year-old population in the USA.63 Over 1 million hospitalizations with a primary diagnosis of heart failure occur each year64 and approximately 1 in 9 death certificates lists heart failure as a cause.63 The rationale for pacing as therapy for heart failure was first proposed in the 1990s. Improvement by dual-chamber pacing was shown to be related to optimal synchronization of atrial and ventricular contractions.16 However, only patients with heart failure who have prolonged PR intervals, in which atrial contraction occurs so prematurely that the atrial “kick” to ventricular contraction is lost, appear to derive benefit from dual-chamber pacing. Conversely, in patients with normal or short AV conduction, the diastolic filling period does not change and cardiac output decreases by 23%, most likely because of the systolic and diastolic dyssynergy induced by RV pacing.16 Overall, the clinical trials demonstrated that dual-chamber pacing had limited long-term efficacy as an adjunct to medical therapy in relieving heart failure symptoms.65,66
Progressive QRS widening frequently accompanies heart failure, in particular when associated with LV remodeling and reduced ejection fraction. The electrical dyssynchrony that results is associated with mechanical dyssynchrony and an increased mortality in heart failure.67–69 Understanding and intervening on the underlying mechanisms has led to the well-established discipline of cardiac resynchronization therapy. Similar to the hemodynamic effects of isolated left bundle branch block (LBBB), LBBB in cardiomyopathy increases isovolumic contraction and relaxation times, thereby increasing the duration of mitral regurgitation and shortening LV filling time, with the net effect of decreasing preload (Fig. 2.31). The duration of mitral regurgitation is more sensitive to heart rate in patients with LBBB than in those without.70 The magnitude of these effects is proportional to the QRS duration. Regionally diminished myocardial function or disturbed temporal sequence of contraction secondary to abnormal electrical activation disproportionately worsens systolic dysfunction in cardiomyopathy, because the remaining myocardium cannot provide the compensatory increase in fiber shortening necessary to maintain stroke volume.71
Fig. 2.31 Relationship between right ventricular (RV) and left ventricular (LV) events in normal subjects (A) and in patients with left bundle branch block (LBBB) (B). In the normal group, LV events either precede or occur simultaneously with RV events. In LBBB, the sequence is reversed, with RV events preceding those of the left ventricle. po, to, ao, mo: time of pulmonic, tricuspid, aortic and mitral valve openings; pc, tc, ac, mc: time of respective valve closures.
Stay updated, free articles. Join our Telegram channel

Full access? Get Clinical Tree


