The prognostic relevance of a rapid rate of hemodynamic progression of aortic stenosis (AS) has been predominantly investigated in tertiary centers. We reviewed the clinical and echocardiographic data from 153 asymptomatic patients with AS (age 77 ± 9 years; 65% men), with normal left ventricular function and paired echocardiograms ≥4 months apart (mean 2.9 ± 2.1 years), evaluated in a nonreferral echocardiographic laboratory. The severity of AS was graded by the peak aortic velocity (Vmax) and progression was classified as slow or fast according to a cutoff value of 0.3 m/s increase annually. The end points were all-cause mortality and a composite of all-cause mortality and aortic valve replacement (AVR). At baseline, 135 patients (88%) had mild-to-moderate and 18 (12%) severe AS. Of the 153 patients, 49 (32%) showed fast progression (0.61 ± 0.32 m/s/yr) and 104 (68%) had slow progression (0.10 ± 0.16 m/s/yr). Among the 144 patients (94%) with clinical follow-up data, 40 died and 48 underwent AVR. The mortality rate was greater than that of the general population (p <0.001). On multivariate analysis, the independent predictors of mortality were the yearly change in Vmax (hazard ratio [HR] 13.352 per m/s increase, 95% confidence interval [CI] 5.136 to 34.713, p <0.001) and age (HR 1.122 per year, 95% CI 1.0728 to 1.735, p <0.001). The predictors of the composite end point of death and AVR were the yearly change in Vmax (HR 12.307, 95% CI 6.024 to 25.140, p <0.001) and Vmax on the initial echocardiogram (HR 2.684, 95% CI 1.921 to 3.750, p <0.001). In conclusion, primary care patients with asymptomatic AS are usually elderly and frequently develop rapid hemodynamic progression, which independently predicts, not only AVR, but also overall mortality.
Most data assessing the hemodynamic progression of aortic valve stenosis (AS) have originated from tertiary referral centers, and the prognostic implications of the rapid progression of AS in the primary care setting has not been elucidated. Thus, we decided to evaluate persistently asymptomatic patients with AS undergoing echocardiographic follow-up in a primary care ambulatory center to assess the characteristics, predictors, and prognostic relevance of the rate of hemodynamic progression of AS in a nonreferral outpatient facility.
Methods
Subjects aged ≥21 years, with any degree of AS, who were referred to the echocardiographic laboratory of an outpatient facility (CMSR Veneto Medica) from January 1997 to December 2008 by their primary care physician, were retrospectively identified. The patients who had had ≥2 echocardiograms ≥4 months apart and without any symptoms attributable to AS at each echocardiographic examination were included in the present study to avoid any referral bias resulting from AS-related symptoms. The exclusion criteria were (1) a left ventricular (LV) ejection fraction <50%; (2) the presence of any other valvular disease greater than mild in severity; (3) the presence of a congenital heart condition other than the bicuspid aortic valve; and (4) previous valvular or aortic surgery. All patients provided written informed consent. The internal review board approved the study protocol. All the patients underwent comprehensive Doppler-echocardiography, according to the American Society of Echocardiography recommendations, by experienced echocardiographers. The LV volumes and ejection fraction were measured using Simpson’s biplane rule method. The LV mass (in grams) was calculated using the Devereux formula and indexed for height to the power of 2.7. The relative wall thickness was computed as the posterior wall thickness/LV radius at end-diastole. AS was assessed as previously reported. The maximum instantaneous and mean pressure gradients across the aortic valve were calculated using a modified Bernoulli equation, and the aortic valve area (AVA) was calculated from the continuity equation. AS was graded as mild, moderate, or severe according to a peak aortic velocity (Vmax) of <3, 3 to 4, and >4 m/s, respectively. The mean progression of aortic jet velocity (expressed as m/s/yr) was calculated by dividing the difference between the last and first echocardiographic examination by the interval between the examinations and was graded as slow or fast according to a cutoff value of 0.3 m/s increase annually. Calcification of the aortic valve was assessed qualitatively, as previously suggested. The arterial blood pressure was measured using a properly sized cuff sphygmomanometer.
Follow-up information was obtained by direct interviews with the patients or their general practitioner. The end points were all-cause mortality and a composite end point comprising all-cause mortality and aortic valve replacement (AVR). Particular care was taken to obtain information regarding the indications for AVR and the cause of death, including the review of reports from the in-hospital stay and death certificates. The primary indications for AVR were classified as (a) the development of AS-related symptoms; (b) patients with severe AS who developed an LV ejection fraction <50%; (c) patients with moderate-to-severe AS undergoing coronary artery bypass graft surgery; and (d) patients with moderate-to-severe AS undergoing surgery on the aorta or other heart valves. Because the physicians caring for most of the patients were not involved in the present study, we could not rule out that patients might have undergone AVR for other reasons, such as moderate-to-severe calcification of the aortic valve or rapid hemodynamic progression to severe AS.
Continuous variables are expressed as the mean ± SD, unless otherwise specified. The unpaired Student t test or 1-way analysis of variance was used for comparison of normally distributed data. The chi-square test or Fisher’s exact test was used to compare noncontinuous variables expressed as proportions. Interobserver variability in the assessment of AS was evaluated using the Bland-Altman plot. Survival curves were constructed according to the Kaplan-Meier method, and comparisons were performed using the log-rank test. The relative risks and 95% confidence intervals were calculated using univariate and multivariate Cox proportional hazard regression models. Multivariate analyses were performed using a stepwise forward regression model, in which each variable with a p value of ≤0.05 (from the univariate analysis) was entered into the model. All multivariate models included age, gender, hypercholesterolemia, diabetes mellitus, arterial hypertension, coronary artery disease (defined as previous acute coronary syndrome and/or revascularization procedures, positive stress tests of inducible ischemia, or any coronary artery stenosis >70% at coronary angiography), LV ejection fraction, LV mass index, aortic valve jet velocity at study entry, and the yearly change in aortic jet velocity. Patient survival from study entry was also compared to an age- and gender-matched “reference group,” obtained by the database of the general population of the Veneto Region reported by the Servizio Epidemiologico della Regione Veneto (available at http://www.ser-veneto.it/ ). All p values are 2-sided and considered significant when p <0.05. Calculations were performed using the Statistical Package for Social Sciences, version 12.0, software (SPSS, Chicago, Illinois).
Results
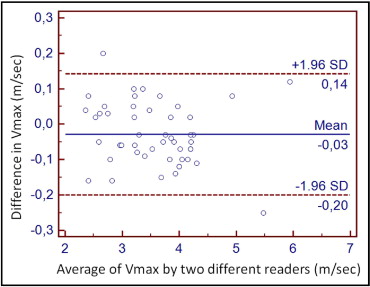
During the study period, 153 patients with AS, without exclusion criteria and ≥2 echocardiograms (median 3.5, range 2 to 7 per patient) were evaluated in our echocardiographic laboratory and constituted the study population ( Table 1 ). The indications for the first echocardiogram were known or suspected AS in 57 (37%), arterial hypertension in 44 (28%), known or suspected coronary artery disease in 18 (12%), palpitations and/or arrhythmias in 18 (12%), and not specified in 16 (11%). Echocardiographers were not involved in any aspect of patient care, except for 7 of the patients with AS. At the baseline examination, 64 patients (42%) had mild, 71 (46%) moderate, and 18 (12%) severe AS. The Bland-Altman analysis showed excellent inter-reader reproducibility in Vmax ( Figure 1 ) . The aortic valve was moderately to heavily calcified in all but 6 patients with mild aortic calcium.
| Variable | Overall (n = 153) | Slow Progression (n = 104) | Fast Progression (n = 49) | p Value |
|---|---|---|---|---|
| Men | 85 (65%) | 64 (62%) | 21 (43%) | 0.16 |
| Age (years) | 77 ± 1.9 | 76 ± 9 | 77 ± 9 | 0.5 |
| Height (cm) | 168 ± 0.1 | 168 ± 0.1 | 167 ± 0.1 | 0.4 |
| Weight (kg) | 75.2 ± 12.6 | 74.8 ± 12.8 | 75.9 ± 12.4 | 0.6 |
| Body surface area (m 2 ) | 1.85 ± 0.19 | 1.84 ± 0.16 | 1.84 ± 0.2 | 0.7 |
| Body mass index (kg/m 2 ) | 26.7 ± 3.8 | 26.4 ± 3.8 | 27.1 ± 4.0 | 0.3 |
| Hypertension | 113 (73%) | 77 (74%) | 36 (73%) | 0.8 |
| Hypercholesterolemia | 55 (36%) | 35 (34%) | 20 (41%) | 0.4 |
| Diabetes | 33 (22%) | 20 (19%) | 13 (26%) | 0.4 |
| Coronary artery disease | 37 (24%) | 25 (24%) | 12 (24%) | 0.9 |
| Current smoker | 11 (7%) | 8 (8%) | 3 (6%) | 0.6 |
| Systolic blood pressure (mm Hg) | 142.4 ± 15.2 | 143.1 ± 15.6 | 141.0 ± 14.1 | 0.4 |
| Diastolic blood pressure (mm Hg) | 82.2 ± 9.2 | 82.5 ± 9.2 | 81.5 ± 9.1 | 0.6 |
| Left ventricular end-diastolic diameter (mm) | 51.0 ± 5.1 | 51.6 ± 4.7 | 49.6 ± 5.5 | 0.02 |
| Left ventricular mass index (g/m2.7) | 58.8 ± 13.6 | 59.4 ± 12.2 | 57.5 ± 16.1 | 0.4 |
| Relative wall thickness | 0.45 ± 0.06 | 0.44 ± 0.06 | 0.46 ± 0.07 | 0.10 |
| Left ventricular end-diastolic volume index (ml/m 2 ) | 60.4 ± 13.0 | 61.6 ± 13.0 | 57.7 ± 12.8 | 0.08 |
| Ejection fraction (%) | 62.1 ± 5.2 | 62.0 ± 5.5 | 62.2 ± 4.5 | 0.8 |
| Aortic valve jet velocity (m/s) | 3.2 ± 0.6 | 3.2 ± 0.7 | 3.3 ± 0.6 | 0.3 |
| Peak aortic gradient (mm Hg) | 43 ± 18 | 43 ± 24 | 44.9 ± 23 | 0.43 |
| Mean aortic gradient (mm Hg) | 26 ± 12.4 | 25 ± 13.4 | 26.8 ± 10 | 0.4 |
| Aortic valve area (cm 2 ) | 1.2 ± 0.3 | 1.3 ± 0.3 | 1.2 ± 0.3 | 0.1 |

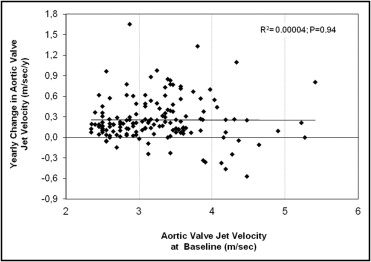
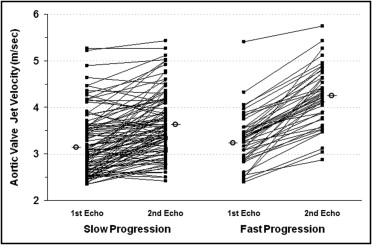
For the entire patient group, the average interval between the first and last echocardiographic examinations was 2.9 ± 2.1 years (range 0.3 to 9.7) and was <1 year (range 0.33 to 0.92) for only 16 patients (10.5%; mean age 78.9 ± 7 years). The average increase in aortic peak jet velocity was 0.26 ± 0.32 m/s/yr, with great individual variability in hemodynamic progression ( Figure 2 ) . In patients with >2 echocardiograms, the rate of change in stenosis severity during the first year (0.21 ± 0.20 m/s/yr) was not different from the overall annual rate for the whole follow-up period (0.26 ± 0.32 m/s/yr, p = 0.17). The rate of progression was not different in patients with severe AS (0.13 ± 0.42 m/s/yr) than in those with mild-to-moderate AS (0.27 ± 0.28 m/s/yr, p = 0.06). A faster pattern of hemodynamic progression (>0.3 m/s/yr) was detected in 49 patients (32%; 0.61 ± 0.32 m/s/yr) and 104 (68%) displayed a slow progression pattern (0.10 ± 0.16 m/s/yr, p <0.001; Figure 3 and Table 1 ). Only the LV end-diastolic diameter was different in patients with rapid progression than in patients with a slow progression pattern ( Table 1 ). The echocardiographic follow-up duration was significantly shorter in patients with faster hemodynamic progression than in those with slower evolution (1.7 ± 1.16 vs 3.32 ± 2.2 years, respectively, p <0.001). At the last echocardiogram, the patients with rapid progression had a greater Vmax compared to those with slow progression (4.3 ± 0.6 vs 3.6 ± 0.7 m/s, respectively, p <0.001; Figure 3 ) and smaller AVA (0.92 ± 0.21 vs 1.07 ± 0.28 cm 2 , respectively, p = 0.001). A progression to severe valve stenosis (Vmax >4 m/s) was observed in 43 (32%) of the 135 patients with initially mild-to-moderate AS. At the last echocardiographic examination, the mean AVA in these 43 patients was 0.85 ± 0.14 cm 2 and was ≤1 cm 2 in 38 patients.


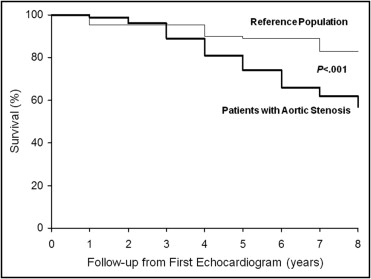
Follow-up data were collected for 144 patients (94%) for 2.36 ± 1.9 years after the last repeat echocardiogram, for a total follow-up period of 4.9 ± 2.7 years after the first echocardiographic examination. Overall, the actuarial probability of survival after the first echocardiogram was significantly worse than that predicted for the age- and gender-matched reference population (p <0.001; Figure 4 ) . At the baseline evaluation, the patients who experienced combined events, compared to those without events, had a higher Vmax (3.4 ± 0.7 vs 3.0 ± 0.5 m/s, p = 0.001) and smaller AVA (1.2 ± 0.3 vs 1.4 ± 0.3 cm 2 ; p = 0.001). A total of 88 patients (61%) reached the combined end point, including 40 deaths and 48 AVRs. The reason for the 48 AVRs was the development of symptoms attributable to AS in 38, a decrease in the LV ejection fraction to <50% in 4, and the coexistent need for coronary artery revascularization in the presence of moderate-to-severe AS in 3. Only 3 patients were referred for AVR by their primary physician because of a rapid increase in Vmax and severe AS. The cause of death was of definite cardiovascular origin in 30 patients (75%; including 2 patients whose death was related to an ischemic stroke), of noncardiac origin in 5 (including 1 with perioperative mortality at noncardiac surgery), and was not determined in the remaining 5. The rate of increase in Vmax was significantly greater in patients with an event (0.33 ± 0.36 m/s/yr) than in those without (0.15 ± 0.22 m/s/yr, p = 0.001). The event rate in patients with rapid progression (80%) was significantly greater than that in patients with slow progression (52%, p = 0.001). Furthermore, the event-free and overall survival rates were significantly worse in patients with mild-to-moderate AS at baseline and rapid hemodynamic progression than in patients with mild-to-moderate AS but slow progression of hemodynamic severity (p <0.001) and was similar to that in patients with severe AS (p = 0.96; Figure 5 ). Finally, the event-free survival was similar among the different age tertiles (overall p = 0.56; data not shown). In patients with mild and moderate AS, the rapid progression pattern showed a 69% positive predictive value for the combined end points and a 42% and 29% positive predictive value with respect to overall death and AVR, respectively. At the first echocardiogram, the patients who subsequently died compared to those who underwent AVR were older (83 ± 7 vs 73 ± 10 years, respectively; p <0.01) had a smaller mean body surface area (1.78 ± 0.19 vs 1.87 ± 0.17 m 2 , respectively; p = 0.03) and mean body mass index (25.6 ± 3.9 vs 27.3 ± 3.9 kg/m 2 , respectively; p = 0.02). No difference was observed in all the other clinical and echocardiographic parameters (data not shown). The yearly increase in Vmax was comparable between the patients who died and those who required AVR (0.31 ± 0.36 m/s/yr vs 0.33 ± 0.36 m/s/yr, respectively; p = 0.84). Nonetheless, at the last echocardiographic examination, the patients who died during follow-up had a lower Vmax than those who had undergone AVR (3.78 ± 0.66 vs 4.24 ± 0.65 m/s, respectively, p = 0.002), with a relatively larger AVA (0.98 ± 0.22 vs 0.88 ± 0.2 cm 2 , respectively; p = 0.03) but a similar LV ejection fraction (60.3 ± 7.4% vs 61.8 ± 6.6%, respectively).


