Hemodynamic Measurements
PHYSICS OF PRESSURE MEASUREMENT
The most common method of measuring pressures in the cardiac catheterization laboratory is to use fluid-filled catheter systems that convey the pressure wave from the site of interest through a catheter, manifold, and a pressure transducer that converts the pressure waveform to an electrical signal. A catheter with a pressure transducer at the tip provides a more accurate pressure recording, but these catheters are too expensive for routine clinical use.
Fluid-filled catheters commonly produce several types of artifacts in recorded waveforms:
1. Low-frequency response
2. Overshoot
3. Zero level
Low-frequency response and overshoot are common to all types of fluid-filled pressure-transmitting devices. The natural resonant frequency of a catheter–manometer system is the frequency at which the system oscillates when stimulated. The desirable frequency response for measuring intracardiac pressures in an adult with a fluid filled catheter system is about 20 Hz or more. When the natural resonant frequency response of a catheter system is below about 12 Hz, low-frequency catheter oscillation waves will obscure high-frequency cardiac waveforms. The operator should try to minimize the following factors that lower the frequency response of a catheter–manometer system:
1. Air bubbles in the catheter system
2. High-viscosity fluid in the catheter (e.g., contrast material instead of saline)
3. Long fluid-filled tubing between the catheter and the pressure transducer
4. A long catheter
5. A narrow-bore catheter
6. A catheter made of soft, compliant material
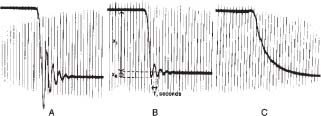
Overshoot is produced by reflected waves within the catheter–manometer system. The magnitude of overshoot can be reduced by mechanical or electrical damping. Overdamping eliminates overshoot, but it reduces frequency response. Optimal damping reduces overshoot without producing a major drop in frequency response (Fig. 45.1).
The pressure transducer in a fluid-filled catheter system must be placed in a position equal to the mid-height atrial level to achieve the “zero level.” This is approximately one-half the distance between the front and the back of the chest in a supine patient. If the transducer is placed at the level of the anterior chest surface of a supine patient, the recorded pressures will be falsely low.
Respiration produces cyclical changes in the absolute pressure of all intrathoracic cardiovascular structures. Pressure measurement should be measured during end expiration. The ultimate goal of setting up a fluid-filled catheter pressure measurement system is to achieve the highest frequency response possible, optimally damp the system to eliminate overshoot, and locate the pressure transducer at the zero level.
BASIC INTRACARDIAC WAVEFORMS
The basic configuration of normal waveforms is similar for the right and left atria. The V-wave amplitude is generally greater than the A wave in the left atrium, whereas the A wave predominates in the right atrium (RA). Electromechanical delay is about 40 to 80 milliseconds. The basic intra-atrial waveforms and the events to which they correspond are as follows:
A: atrial contraction
C: ventricular contraction
V: rising atrial pressures during ventricular systole; occurs during the T wave
C-V, or systolic: rapidly rising atrial pressure due to severe atrioventricular valve regurgitation
X descent: atrial relaxation; occurs after the A-wave peak, before the C wave
X′ descent: atrial relaxation; occurs after the C wave and before the V wave
Y descent: opening of the atrioventricular valve; occurs after the peak of the V wave (Fig. 45.2).
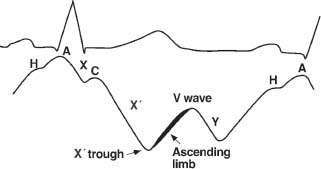
FIGURE 45.2 Timing of the interatrial waveform with the electrocardiogram.
Arrhythmias may produce a variety of changes in intracardiac pressures:
1. Atrial fibrillation will eliminate A waves.
2. Junctional rhythm will displace A waves closer to the C wave.
3. Premature ventricular contractions (PVCs) and ventricular pacemaker rhythm may produce cannon A waves in the atrium as a result of atrial contraction against a closed atrioventricular valve.
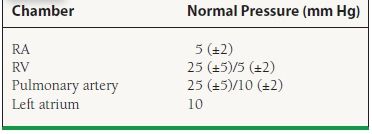
Normal values for intracardiac pressures are listed in Table 45.1.
TABLE
45.1 Normal Values for Intracardiac Pressure
Pulmonary Capillary Wedge Pressure Waveforms
Pulmonary capillary wedge (PCW) pressures indirectly reflect left atrial pressures. PCW waveforms demonstrate a mechanical time delay, decreased amplitude, and decreased frequency response compared to simultaneously recorded left atrial waveforms (Fig. 45.3). The reason for these changes is the retrograde transmission of pressure waves from the left atrium through the pulmonary veins, capillaries, and arterioles to the wedged catheter in the pulmonary artery. The mechanical time delay is determined by the location of the wedged catheter in the pulmonary arterial circuit and by the volume and compliance of the pulmonary venous circuit and left atrium. A stiff 7 French end-hole catheter (e.g., Cournand) will wedge more distally in the pulmonary artery, with a mechanical time delay of about 70 to 80 milliseconds. A balloon-tipped catheter will wedge more proximally in the pulmonary artery branches, with a mechanical time delay up to 150 to 160 milliseconds. Proper wedging of the right heart catheter can be demonstrated by:
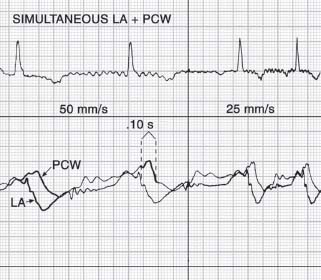
FIGURE 45.3 Electromechanical delay between left atrial waveform and pulmonary capillary wedge pressure waveform.
1. A mean PCW pressure about 10 mm Hg lower than mean PA pressure
2. Blood withdrawn from the wedged catheter has an oxygen saturation at least equal to arterial saturation.
For the PCW to accurately reflect left atrial pressure, the pulmonary artery catheter must be positioned in an area of the lung where the mean pulmonary capillary pressure (Pc) exceeds the mean alveolar pressure (PA). The lungs can be divided into three physiologic zones of blood flow. These zones are based upon the relative differences in alveolar pressure, mean pulmonary artery pressure, and pulmonary capillary pressure:
 Zone 1 (highest in elevation): This is the part of the lung that is above the level where the alveolar pressure (PA) is equal to the pulmonary artery pressure (Pa), such that PA > Pa > Pc throughout this zone. There is minimal to no blood flow in this zone because the pressure exerted on the pulmonary artery by the alveoli prevents blood flow to the capillaries.
 Zone 2 (middle elevation): This region of the lung lies between where the pulmonary artery pressure equals the alveolar pressure and where the alveolar pressure equals the pulmonary capillary pressure; such that Pa > PA > Pc.
 Zone 3 (lowest in elevation): This is the region of the lung that lies below the level where the alveolar pressure equals the pulmonary capillary pressure, such that Pa > Pc > PA.
If the pulmonary catheter is in an area where the alveolar pressure is greater than the pulmonary capillary pressure, then the PCW waveform will be falsely elevated. Thus, the PCW pressure accurately reflects left atrial pressure only when the catheter is in zone 3 of the lung. In the catheterization laboratory, a newly placed pulmonary artery catheter selectively advances to zone 3, thereby assuring valid PCW measurement. However, when in the intensive care unit, the patient can be repositioned or significant fluid changes can occur thereby changing the intrapulmonary hemodynamics. Thus it is often necessary to verify that the location of the catheter tip still exhibits zone 3 physiology. Marked respiratory variation in the PAWP tracing and a loss of the normal atrial pressure waveform suggest that the catheter is in a zone other than zone 3. When using a balloon-tipped pulmonary artery catheter, withdrawing the catheter back to the right ventricle (RV) and then readvancing the catheter with the balloon tip inflated will usually reposition the catheter into zone 3.
Accurate PCW pressures may be difficult to obtain in patients with near systemic levels of pulmonary hypertension. Characteristically, the PCW pressures may appear falsely elevated, which may lead to a false impression of postcapillary pulmonary hypertension. In these cases, direct left ventricular and/or left atrial pressure measurement may be required to determine if the left heart pressures are truly elevated.
Pressure Wave Artifacts
In addition to the artifacts that may be produced by low-frequency response and overshoot, catheter structure or placement may introduce artifacts in pressure recordings.
End-hole artifacts may occur when the tip of an end-hole catheter becomes occluded during contraction of an atrial or ventricular wall. If this occurs during atrial systole with a catheter in the atrium, the A wave will appear greatly magnified (Fig. 45.4). If end-hole occlusion occurs with a catheter in a pulmonary artery, the PCWP will appear falsely low and flat.
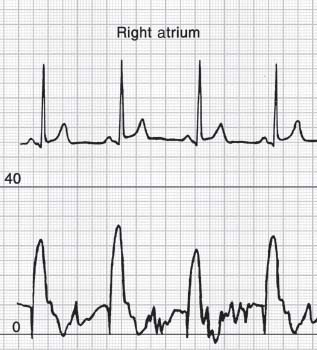
FIGURE 45.4 Falsely elevated A wave recorded from an endhole catheter in the right atrium.
Simultaneous recording of ventricular and aortic pressures may occur when the tip of a pigtail catheter is located in the ventricle and the side port in the aorta. This may produce a bizarre-looking pressure wave with an apparently elevated diastolic left ventricular pressure (Fig. 45.5).
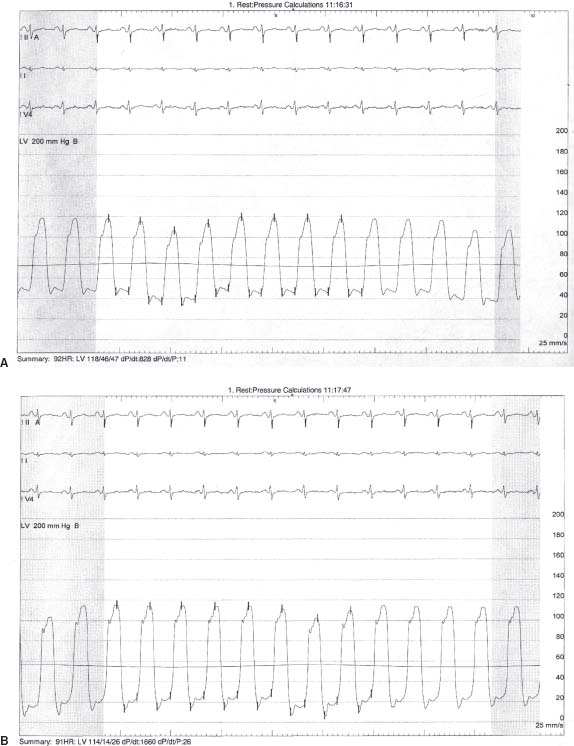
FIGURE 45.5 A: Pressure recording from pigtail catheter with endhole in the left ventricle and side-holes in the aorta revealing a falsely elevated LVEDP. B: Pressure recording in same patient with pigtail catheter completely in left ventricle demonstrating the accurate LVEDP.
Catheter-whip artifact is a high-frequency oscillation that results from rapid movement of the catheter by blood flow. This is particularly likely to occur in the pulmonary artery and above a stenotic aortic valve.
Cardiac Output Measurement
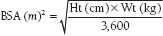
The fundamental function of the heart is to deliver enough blood to the systemic circulation to meet the oxygen demands of tissues. The normal cardiac output (CO) increases with body size and exercise and decreases with age. Numerous other factors may affect resting CO. In order to account for body size, the CO is normalized to body surface area (BSA) in square meters (m2), and the result is the cardiac index. BSA may be obtained from a nomogram or calculated by the following formula:
The normal resting cardiac index falls from about 4.5 L/min/m2 at age 7 years to 3 L/min/m2 in middle age, and to 2.5 L/min/m2 at age 70.
The two major methods for measurement of CO in the cardiac catheterization lab are the Fick oxygen technique and the indicator dilution technique.
The Fick Technique
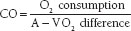
The Fick principle states that the total uptake or release of any substance (such as oxygen) by an organ (such as the lungs) is the product of blood flow to the organ and the arteriovenous (A-V) concentration difference of the substance. If pulmonary blood flow equals systemic blood flow, then
Oxygen consumption can be estimated by measuring the oxygen uptake from room air by use of a Douglas bag or metabolic hood. In order to conserve time and expense, many laboratories use an assumed oxygen consumption based on the formula 125 mL/min/m2 for younger patients (110 mL/min/m2 for older patients) or 3 mL/min/kg. However, assumed oxygen consumption values may produce discrepancies of ±10% to 25% in about half of patients.
A-V oxygen difference is obtained by subtracting the oxygen content of pulmonary venous (or systemic arterial) from pulmonary arterial (or “mixed venous”) blood. Oxygen content may be calculated using the formula
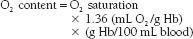
where Hb is hemoglobin.
The final formula for calculation of CO then becomes

Estimation of pulmonary arterial oxygen content by using “mixed venous” blood from the venae cavae is less accurate. Mixed venous blood oxygen saturation is an estimation of what the pulmonary artery blood oxygen saturation would be if no shunt were present. This can be approximated by the following formula:

and

where superior vena cava (SVC) and inferior vena cava (IVC) are the respective O2 saturations.
Use of arterial blood to estimate pulmonary venous blood oxygen content is acceptable, because, in the absence of shunts, only a small amount of venous blood enters the arterial circuit within the heart via the Thebesian veins. Narrow A-V oxygen differences (as seen with high CO) are more likely to introduce error than wide differences (as seen with low CO). Thus, the Fick method is most accurate in patients with low CO.
Assume that a patient has the following measured values:
Oxygen consumption = 250 mL/min
Femoral artery oxygen saturation = 97%
SVC oxygen saturation = 70%
IVC oxygen saturation = 78%
Hb concentration = 14.0 g%
The mixed venous blood saturation will be
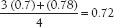
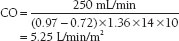
In this case, the CO can be calculated as
Indicator Dilution Methods
The most commonly used indicator dilution method today is the thermodilution technique. This method utilizes a bolus injection of saline, followed by continuous measurement of the temperature of the blood by a thermistor in the pulmonary artery. The resulting curve is analyzed by computer to derive the CO using the basic indicator dilution equation. With this method, the temperature of the injectate (measured in the injectate fluid container before injection) is assumed to increase by a predictable amount during injection.
Accurate measurement of both blood and injectate temperatures immediately before injection is important for measuring thermodilution COs. According to the formula for calculating thermodilution CO, the temperature difference between blood and injectate (typically 16°C when room-temperature injectate is used) is directly proportional to CO. Small errors in either of these measurements can produce errors in calculated CO.
Thermodilution CO will be overestimated if the injectate temperature is inappropriately increased by permitting the injectate to remain in the syringe or by holding the syringe in the hand before and during injection. Use of cooled injectate, as opposed to room-temperature injectate, may produce an even greater mean error, probably because warming of the cooled injectate in the tubing and syringe produces an even greater increase in temperature than use of room-temperature injectate. Even though there is a theoretical advantage to iced injectate because of its greater signal-to-noise ratio, most studies have shown no advantage to iced over room-temperature injectate. A dual-thermistor catheter appears to minimize these problems with injectate temperature, resulting in more consistent and accurate CO measurements, but at increased expense.
The thermodilution technique will overestimate CO in low-flow states because of warming of blood by the cardiac chambers. The thermodilution method is most accurate in high-flow states. It is unreliable in the presence of significant tricuspid regurgitation because the injectate is warmed during its prolonged stay within the RA and R V. Overall, the thermodilution method should have an error of no more than 5% to 10% when performed correctly.
Shunt Calculation
An intracardiac shunt is an abnormal communication between the left and right heart chambers. A left-to-right intracardiac shunt increases pulmonary blood flow in relation to systemic flo w, and a right-to-left shunt does the opposite.
Oximetry is the most common method for calculating intracardiac shunts in the catheterization laboratory, although dye dilution curves and angiography may also be used. Oximetry is not as sensitive as dye dilution curves for detecting small shunts, but it should be capable of detecting any shunt that is large enough to merit surgical correction. Detailed oximetric analysis requires sampling in the RA (three sites), SVC (high and low), IVC (at renal artery level and below the diaphragm), RV (three sites), pulmonary artery, and aorta.
When a left-to-right shunt exists at the atrial level, it is necessary to use the SVC and IVC oxygen saturations to calculate the mixed venous blood saturation, as described above. The same principle applies when a left-to-right shunt exists at the right ventricular level, especially when tricuspid regurgitation is present. A significant increase in oxygen saturation in the right side of the heart is considered to exist when there is >7% increase from the SVC/IVC to the RA, >5% from the RA to the RV, and >5% from the RV to the PA.
Left-to-right shunts are commonly expressed as Qp/Qs. Qp, or pulmonary flow, and Qs, or systemic flow, are calculated using the formula given above for calculating CO. The A-V O2 difference for Qp requires pulmonary arterial and pulmonary venous samples (or assumption of a pulmonary venous saturation of 95%). The A-V O2 difference for Qs requires arterial and mixed venous samples. A Qp/Qs <1.5 signifies a small left-to-right shunt, 1.5 to 2.0 an intermediate size, and >2.0 a large shunt. A Qp/Qs <1.0 indicates a net right-to-left shunt.
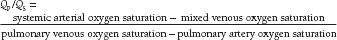
When Qp/Qs is calculated, all the components of the CO formula factor out, leaving only the oxygen saturations. Therefore, Qp/Qs can be calculated by the following formula:
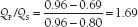
Assume that a patient with an ostium secundum interatrial septal defect has the following measured values:
LV oxygen saturation = 96%
SVC oxygen saturation = 67.5%
IVC oxygen saturation = 73%
PA oxygen saturation = 80%
The mixed venous blood saturation is
In this case, Qp/QS is calculated as follows:
Vascular Resistance
Vascular resistance is defined by the ratio of pressure gradient across a vascular circuit divided by the flow. In a rigid tube with steady laminar flow of a homogeneous fluid, the relationship between pressure and flow is described by Poiseuille’s law, which states that the pressure drop across a circuit with fluid flowing at a constant rate (and therefore its resistance) is directly proportional to the length of the tube and the viscosity of the fluid and indirectly proportional to the fourth power of the radius of the tube. Within the bloodstream, Poiseuille’s law is inaccurate because blood flow is pulsatile and nonlaminar, blood is not homogeneous, and blood vessels are nonlinear and elastic. However, the basic principles of this law still apply in clinical measurements of resistance.
For clinical purposes, two important vascular resistance concepts are commonly derived from pressure and flow data:
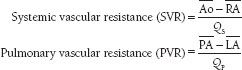
where  is the mean systemic arterial pressure,
  the mean right atrial pressure,
  the mean pulmonary arterial pressure,
  the mean left atrial pressure, QS the systemic blood flow, and QP the pulmonary blood flow. The mean PCW pressure is often used as an approximation of the left atrial pressure.
These calculations yield vascular resistance in Wood units, named after Dr. Paul Wood. To convert to metric resistance units, expressed in dynes-sec-cm-5, multiply vascular resistance by 80. Vascular resistance index (VRI) is obtained by multiplying vascular resistance by body surface area.
Normal values for vascular resistance (in dynes-sec-cm-5) are:
SVR: 1,150 ± 300
SVRI: 2,100 ± 500
PVR: 70 ± 40
PVRI: 125 ± 70
Clinically, SVR calculations are commonly used to diagnose and treat patients with hypotension or heart failure, and PVR to evaluate pulmonary arterial hypertension and the suitability of patients with congenital heart disease for cardiac surgery. PVR calculations are also frequently used to determine the severity of PVR in patients with end-stage heart failure being evaluated for heart transplantation and in patients with end-stage liver failure being evaluated for liver transplantation. Because the length of the vascular bed is likely to be constant in any adult patient, changes in SVR and PVR reflect either altered viscosity of blood or a change in the cross-sectional area of the vascular bed. Severe chronic anemia lowers the values for measured vascular resistance. If the hematocrit remains stable, changes in SVR are produced primarily by altered arteriolar tone. Thus, measurement of SVR becomes the basis for hemodynamic evaluation of shock.
Vasodilatory shock, such as in sepsis or adrenal insufficiency, is associated with markedly decreased SVR and normal or increased CO. Cardiogenic and hypovolemic shock usually produce a decreased CO and markedly increased SVR due to intense peripheral vasoconstriction.
In congenital heart disease, the ratio of PVR to SVR is commonly used as a criterion for operability. Normal is <0.25. Moderate pulmonary vascular disease is 0.25 to 0.75, severe is 0.75 to 1.0, and ≥1.0 is generally considered inoperable. Administration of oxygen or vasodilator drugs, such as nitric oxide, helps to differentiate reversible pulmonary vasoconstriction versus permanent obliterative changes in the pulmonary vasculature.
CALCULATION OF VALVE ORIFICE AREA
Proper calculation of stenotic valve orifice area (VOA) is critically important for proper timing of valve surgery and valvuloplasty. The “gold standard” for calculating VOA is the Gorlin formula, which was developed by Dr. Richard Gorlin.
Gorlin Formula
The Gorlin formula relies on measurement of three variables:
1. CO
2. mean pressure gradient
3. flow period (the portion of the cardiac cycle during which pulsatile flow actually occurs)


