Hemo-dynamo Doc

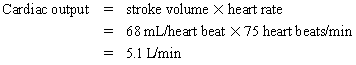
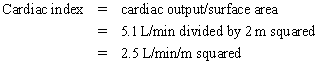
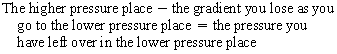
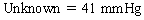
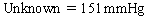
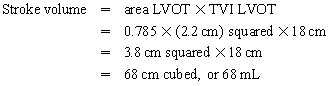
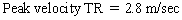
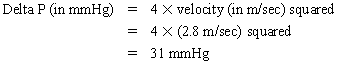
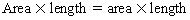
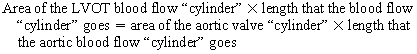
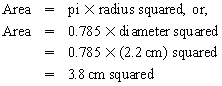
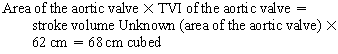
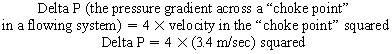
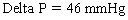
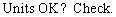
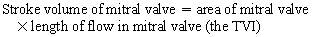
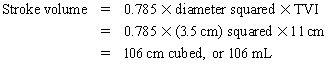
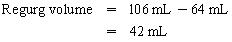
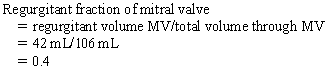
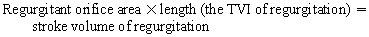
Chapter 23


Hemo-dynamo Doc


Christopher J. Gallagher


The crew of Apollo 13 solved their problems.


See if you can solve these.


The first time you see the quantitative problems of transesophageal echocardiography, you will defecate a quart jar of tenpenny nails, not to be too indelicate about it. But fear not, all is not lost. The math is no more complex than algebra, and the same concepts come back over and over and over again. The best way to show this is to plow through the problems they showed at the 2003 hemodynamics workshop meeting. The first time through (especially if you haven’t seen this stuff before), it will seem like Greek. But by the end (once you see that the same equations reappear like Jason in a Halloween sequel), you should get it.


Go through these problems, and you, too, can be a Hemodynamo-Doc.


Case 1


77-yo man having CABG surgery has an A-line, CVP, and (surprise) a TEE. On echo, the AV appears sclerosed with restricted leaflet motion and trace AR. His BSA is 2.0 m squared. The following measurements are made:


Your job, should you decide to accept it, is to calculate:


If you saw this problem ice cold, and thought the TEE exam was just a matter of looking at some videos and saying, “Yeah, there’s a dissection”, or “There’s mitral regurg”, then you would no doubt die right here and now. Fortunately, forewarned is forearmed; you KNOW this stuff will be on the test, so let’s grind through it.


N.B. There will be a LOT OF REPETITION here as we go through these problems. That is a good thing for it should POUND THIS STUFF THROUGH YOUR THICK SKULLS. At the echo course in San Diego, they emphasize that the course repeats and reinforces the main ideas.


Redundancy is a good thing.


And you can say that again.


Calculation of Stroke Volume:


image


The stroke volume going through the heart is thought of as a “cylinder of blood,” so you look for a place that has both an area that you can measure (lo and behold, the LVOT fits the bill) and a length that you can measure (the LVOT TVI, which is a “length”). TVI stands for time-velocity integral, and is measured by putting the pulsed-wave Doppler (the one that measures velocity at a specific place) right in the LVOT. Then you trace the outside of the velocity curve. The computer in the TEE machine will give you a time-velocity integral, which is the length that the blood moved.


There is a little leap of faith here, with only engineers and pencil-necked geeks understanding exactly the nature of “integration” turning a velocity in cm/sec into a length of cm. Suffice it to say, TVI gives you the length that the cylinder of blood moved.


Volume of a cylinder of blood moving through the heart (which is the stroke volume) = area at a specific place (here, the LVOT) × length at a specific place (here, the TVI of the LVOT).


Cleaning up a little:


image


Area of a circle, you recall from 8th grade or so, is pi × radius squared. Since pi is 3.14 and since radius = diameter divided by 2, then the area equation can be simplified to area = 3.14 × diameter squared/2 squared, or 3.14 × diameter squared/4. Crank out a little division and you come up with:


image


For some reason, in the TEE review course, they always go with area = 0.785 × diameter squared, they never go with pi × radius squared. Whatever, when in Rome, do as the Romans.


So let’s wander back to the stroke volume thing.


image


As you do these problems, pay attention to two things:


The units should come out properly, just like in chemistry or physics class. We ended up with a stroke volume in units of cm cubed, or in other words, mL. That makes sense. That is how you usually measure stroke volume. If, after your crafty machinations, you had come up with units of, say, hectares per nanosecond per light-year, then you must ask yourself, “When was the last time I measured a stroke volume in hectares per nanosecond per light-year?”. The answer being, “Never”, you should go back and redo the math.


Common sense should also play a part in your answer. This patient, ailing though he was, had a stroke volume of 68 mL. That is not the greatest, but is compatible with life in a human being. If, in blazing contrast, your calculated stroke volume came out to 3 mL, then you would have to ask yourself “Just how long does your average human being live with a stroke volume of 3 mL?”.


I wouldn’t sell such a person life insurance.


The flip side of the coin is, what if you calculate a stroke volume of 8900 mL? Either you are calculating the stroke volume of King Kong, or you made a decimal point mistake in there somewhere.


Do your problem, then step back. Look at the units. Use common sense.


Calculation of Peak Right Ventricular Systolic Pressure


Sorry, the free ride is over, you’ll have to put your thinking cap back on for this one.


For this, you’ll need two things, one mathematical, and one commonsensical/visual.


The Mathematical


The Bernoulli equation will appear a million times in any discussion of TEE. The complicated form of this equation takes Sir Isaac Newton to decipher, but the simplified version comes to us as the digestible.


Delta P (the change in pressure between two chambers in a flowing system) = 4 × velocity squared (where the velocity is measured at a “choke point” or narrowing between the two chambers)


So picture the place we’re interested in measuring, here the right ventricle. Where is there a “choke point” or narrowing that leads into or out of the right ventricle, we can measure a velocity. (Remember, the TEE can measure a velocity for you, but it cannot measure a pressure.)


Aha! The patient has tricuspid regurgitation, and there is a measurement of the tricuspid regurg velocity that we can measure:


image


(Note well, the units for the Bernoulli equation work out as follows—use the velocity in m/sec and your gradient will come out in mmHg.)


So let’s convert that TR velocity into a gradient:


image


Now on to the second thing you need to solve this problem.


The Commonsensical/Visual


So we want to know the pressure in one place, we have a gradient, and we have a pressure in a second place. Here’s where the common sense comes in.


There is a higher pressure place, the right ventricle (that’s what contracts, after all). There is a lower pressure place, the atrium (the pressure in that thin-walled chamber better be lower than the thicker walled ventricle).


Common sense tells you that you could set up an equation like this:


image


image


image


image


image


In the TEE review course, they said:


image


This may work for you, but I found it more useful to think through the problem from the vantage of “here’s the high-pressure area, here’s the low-pressure area, and here’s the loss of pressure between them”. That way you’ll understand the way the pressure works, and you’ll be less likely to, say, subtract the CVP from the gradient rather than add the CVP to the gradient. Once you’re done, you can then draw your picture and see if common sense holds up.


Calculation of Peak Aortic Valve Area


Here the continuity equation comes home to roost. At first baffling, the continuity equation makes sense: it’s just a question of cross multiplying and dividing, and shouldn’t make you lose much sleep.


Why bother? Why not just draw a line around the open aortic valve and let the TEE machine do the area for you by planimetry?


Ah, grasshopper, things are not so simple as they seem.


Planimetry, as so many things in life, only works when you don’t need it! (Kind of like the umbrella that never leaks unless it rains, or the life preserver that doesn’t let you drown unless you happen to fall into the ocean.) When the aortic valve is crunchy and stenotic, planimetry (a two-dimensional exercise), just cannot get a good handle on the exact orifice area. You outline up here, but there is more stenosis below your outline, or there is more stenosis above your planimetry, so the planimetry is just no good.


Continuity Equation Idea: flow through one area of the heart equals flow through another area of the heart.


Fluids are not compressible, so you can’t “squish” the blood. Also, blood cannot just “disappear”, which brings up the BIG EXCEPTION to the continuity equation:


If a patient has noncontinuous flow (septal defect somewhere), then you can’t use the continuity equation. To use continuity, have continuity!


So, if you can measure flow through one area, then that should equal flow in another area.


Flow here = flow there. The essence of the continuity equation.


Recall from earlier that we “create” measurable flow by assuming a cylindrical amount of blood flow. (We did that in the original part of this problem, the stroke volume problem. Go back now and nail that down, because that is the heart of the continuity equation.) We measure this cylindrical flow by getting one area and multiplying it by the length (the time-velocity integral), thus getting flow.


image


We know we want to know the aortic valve area, so where can we find another place to measure stuff?


The left ventricular outflow tract, of course! (The LVOT is forever bailing our mathematical asses out of trouble.)


So flow through the LVOT should equal flow through the aortic valve. So plug in the respective three things that we DO have, and solve for the one thing we don’t have:


image


image


You have the diameter of the LVOT, 2.2 cm, so use the area formula:


image


So, plodding along,


image


Cross multiply and divide, solving for the area of the aortic valve, and, voila!


image


Does this pass the units test? Yes. Aortic valve areas are measured in cm squared.


Does this pass the common sense test? Yes, this fits the general size you would expect of a stenotic aortic valve. You didn’t get an aortic valve area the size of an electron, nor did you get an area the size of Comiskey Park.


Now hold on to your slide rulers and cyclotrons—there is, it turns out, another way to get the aortic valve area.


Go back to the cylinder of blood idea (the gist of all these equations). If you look just at the aortic valve, you could say:


image


So, if you were of a mind to, you could calculate the aortic valve area that way, could you not? (The first time you see this, you’ll go, “Huh? Aren’t they cheating?”.) But it’s actually not cheating, because, in order to get the stroke volume, you had to use the concept of the “cylinder of blood going through the LVOT” (see above, where we calculated the very first part of this problem, the stroke volume).


Take a second to digest this.


No, really, look back up there, don’t take this on faith.


Satisfied? Good.


So, here we go with the second way to calculate the area of the aortic valve.


image


Cross multiply and divide, and gee whiz golly, the aortic valve area is still 1.1 cm squared.


That shouldn’t surprise you, as this patient hasn’t aged much during this problem.


What should surprise you is a second answer different from your first. Since you were just grinding the same numbers through in different ways, you should get a second answer the same as the first. If you don’t, go back and rework it.


Calculation of Peak Left Ventricular Pressure


At the TEE course, they didn’t ask for this, but it’s worth doing just to get that “high-pressure area, gradient loss, low-pressure area” idea down.


First, draw a picture of what you’re trying to find. (To repeat, getting the concept down of where the high pressure should be, as well as where the low pressure should be, is important. A good picture will make sure you add where you should add and subtract where you should subtract.)


The high-pressure area should be the left ventricle in systole, because the left ventricle has to overcome the “choke point” of the aortic valve, and still have enough oomph left over to provide systolic pressure.


High pressure in the left ventricle (unknown) − pressure lost in the stenotic aortic valve (the previously calculated gradient of 46 mmHg) = pressure left over in the aorta (the systolic pressure of 105 mmHg)


image


image


Now, redraw the picture and see if it makes sense.


Case 2


48-yo man having CABG. Monitoring includes a finger on the pulse and an anesthesiologist on the phone to Merrill-Lynch. OK, OK, sorry. Monitoring includes an A-line, CVP, and TEE. LV appears dilated and hypocontractile. There is a central jet of MR judged to be 2+ to 3+ in severity. The following measurements are made:


Calculate the following:


Before you regurgitate yourself at all this stuff, a few pointers.


On this, the math part of the test, they will just give you the various measures. They’ll lay LVOT diameter on a silver platter and hand it to you. In other parts of the test, you will visually have to show exactly where you would take this measurement yourself. And on the test the various places are damned close to one another, so make sure you know where to take these measurements.


Second, PISA makes the whole auditorium groan, it seems so esoteric at first. But once you gird your loins and throw yourself into this stuff, you’ll see that PISA is just the continuity equation in another form.


image


PISA’s area is a hemisphere, so that’s a little different.


PISA’s area is affected by its angle to the valve, so that’s a little different.


PISA implies you know what the hell aliasing is, so that’s a little different.


Alright, so PISA is a pain in the ass, what can I tell you? I didn’t make up the exam!


Let’s take a little breather from the PISA monster, get as far along as we can in the calculations, get a little confidence, then jump into the snake pit of PISA-ness.


Calculation of MV Stroke Volume


Danger! Danger, Will Robinson! Remember, when you measure these, to measure both the diameter and the TVI at the same place. In this problem, be sure to measure both the diameter of the mitral valve and the TVI of the mitral valve at the annulus. If you measure the diameter at the annulus and the TVI at, say, the tips of the mitral valve, then you would get an inaccurate result.


image


So once again, we are invoking a “cylinder of blood flow”.


Though the mitral valve is more like an oval, for purposes of this problem, we will consider it a circle:


image


Or, bowing to TEE convention:


image


Units check? Yes. Common sense check? Wait a minute! Didn’t we just calculate an LVOT stroke volume of 64 mL? Now where did this stroke volume of 106 mL come from? What about the Holiest of Holies, the continuity equation?


Confused? Pause for a moment and think about what’s happening.


This patient has mitral regurgitation, so it makes sense that more should go through the mitral valve than goes out the LVOT. Some of that mitral volume is lost by going backward (as we’ll see below). Recall, too, that the continuity equation doesn’t apply here, because the LVOT measurement applies to blood flowing out to the aorta during systole. The blood flow going forward through the mitral valve occurs during diastole.


Systole and diastole do not occur at the same time. They are DIScontinuous so the continuity equation does not apply to them.


So, in review, the units check and the common sense also checks, once you think about what is happening and when it is happening.


Calculation of Regurgitant Orifice Area


This is a little hypothetical, as the regurgitant orifice area is not a fixed thing that instantly appears, then instantly disappears. In reality, it’s more like a door that is closed, opens at a certain speed, stays open for a length of time, and then closes at a certain speed. This calculation looks at the “door all the way open” and ignores the reality of the “opening period” and the “closing period”.


But you’re not here to think. Just do the calculation and keep your trap shut.


Go back to our cylinder of blood and start calculating.


image


image


Cross multiply and divide, you busy little hemodynamic beavers.


image


Units check? Yep. Common sense check? U-u-uh.


That makes sense. The mitral valve isn’t a complete waste case; it is regurgitant, but not wide, wide open, so it makes sense that a portion, not all, of the valve effectively “stays open” during systole, allowing for the 40% regurgitation.


PISA Calculations


Hunker down, cowboys and cowgirls, it’s not so bad as you think. Before we go into the actual calculations in this case, let’s go over the main aspects of PISAtology.


Look at the words that make up PISA, and draw pictures to illustrate the point.


Proximal. That means the colorful and troublesome PISA radius will appear on the upstream part of the “choke point”. So draw a few pictures. If the patient has mitral regurg, and the flow is pouring from the high-pressure left ventricle into the low-pressure left atrium, the PISA will appear where?


Proximal! That is, the PISA will appear in the left ventricle, the “near” side of the “choke point”. The proximal area of the choke hold, not the far side. That would be “distal isovelocity surface area”, and if you think of the chaotic flow on the far side of a “choke point”, that doesn’t make sense.


How about a case of mitral stenosis? Flow is trying to “squeeze” through a tight mitral valve. Where would the PISA radius appear then?


Proximal! On the near side of the choke point, that is, in the left atrium.


Again, a radius on the far side of the choke point doesn’t make sense.


Isovelocity. All the flow at that area is the same. Recall that flow Doppler is a pulsed-wave, not a continuous-wave, phenomenon. At a certain velocity, the color of the wave will change. Conveniently for us, the aliasing velocity (the velocity where color change occurs) is listed on the machine.


Well, why should the isovelocity thing line up so perfectly for us. Why isn’t the isovelocity thing scattered all over the map?


Think of water going toward a narrow sluice gate. The velocities are all over the map, until you get real close; then the pressure bearing down on the water is all the same. The velocities “organize” as the water gets closer to the sluice gate, and you get a hemisphere of water all going the same speed toward that narrow opening. That is why you get a hemisphere of “isovelocity-ness” that appears on the TEE screen.


Surface Area. Unlike earlier equations, which used the area of a circle (pi × radius squared), this area is that of a hemisphere (2 × pi × radius squared). Why? Look at the PISA thing. It is a hemisphere, not a circle.


So that’s where you get the 2 × pi × radius squared. In calculations done at the conference, they give you the radius and you go with 6.28 (that is, 2 × 3.14) × radius squared.


So, once you believe in PISA, have the formula for area of a hemisphere down, and recall the continuity equation, you are in business.


Calculation of Regurgitant Flow Rate by PISA


Just as in other valve calculations, invent the idea of a cylinder of blood flowing along with a certain area and a certain length. This requires a little mind bending, as you are used to looking at the area of a circle and multiplying it by the length. Here, with PISA calling the shots, you make an area of a hemisphere and multiply it by the length.


Try not to think about it too much, you might pop an aneurysm. Just go with the flow.


image


Wait, wait! Where did that aliasing velocity come from again?


That line, where the flow changes color, must all be going at the same velocity—remember the water flowing towards the sluice gate? So read the aliasing velocity right off your TEE screen (it’s listed right next to a colored bar), measure the radius to that line change, and you know that right there, the blood has to be going that fast, the aliasing velocity. And you measured the radius right there, where the color change occurs, so you are satisfying the demand that the area and the velocity be measured at the same place. So,


image


image

Stay updated, free articles. Join our Telegram channel

Jun 4, 2016 | Posted by in CARDIOLOGY | Comments Off on Hemo-dynamo Doc

Full access? Get Clinical Tree

Get Clinical Tree app for offline access