CHAPTER 4 Heart failure, myocardium and pericardium
4.1 HEART FAILURE
There is no ideal definition of heart failure. One definition is of a clinical syndrome caused by an abnormality of the heart which leads to a characteristic pattern of haemodynamic, renal, neural and hormonal responses. A shorter definition is ventricular dysfunction with symptoms.
Echo plays a crucial role when heart failure is suspected (e.g. unexplained breathlessness, clinical signs such as raised venous pressure, basal crackles, third heart sound) to help establish the diagnosis, assess ventricular function and institute correct treatment.
An underlying cause of heart failure should always be sought and echo plays an essential role here also. The most common cause in Western populations is coronary artery disease. Echo may also reveal a surgically treatable underlying cause, e.g. valvular disease or LV aneurysm. Heart failure may be caused by severe AS (which affects 3% of those aged over 75 years) and the murmur at this stage may be absent.
Major therapeutic advances have been made in the past two decades, including the use of modern diuretics, angiotensin-converting enzyme (ACE) inhibitors, device therapy and cardiac transplantation. This has improved the quality and duration of life of many with heart failure.
Some studies (e.g. Framingham study) have provided epidemiological data on heart failure:
The term dilated cardiomyopathy describes large hearts with reduced contractile function in the presence of normal coronary arteries (section 4.4). It is usually of unknown cause. When a cause is established, the term is sometimes preceded by a qualifier, such as alcoholic dilated cardiomyopathy. Hypertension has become a less common cause of heart failure as a consequence of its improved detection and treatment. It remains an important contributory factor to the progression of heart failure and is a risk factor for coronary artery disease.
Causes of chronic heart failure
Adapted from Kaddoura & Poole-Wilson, 1999, Cardiology, McGraw-Hill, pp. 523–533.
It is always important to seek the cause of worsening features (decompensation) of heart failure in a previously clinically stable individual. This may lead to symptoms such as breathlessness or signs such as crackles in the chest, raised venous pressure or peripheral oedema. Echo can help in the investigation of the potential causes:
There are many causes of acute heart failure, the most common of which is myocardial ischaemia or infarction.
Causes of acute heart failure and cardiogenic shock
Adapted from Holmberg, 1996, in Diseases of the Heart, Saunders, pp. 456–466 and Dob, 2003, in Oh’s Intensive Care Manual, Butterworth-Heinemann.
4.2 ASSESSMENT OF LV SYSTOLIC FUNCTION
This is one of the most important and common uses of echo. LV systolic function is a major prognostic factor in cardiac disease and has important implications for treatment. Clinical management is altered if an abnormality is detected (e.g. the diagnosis of systolic heart failure should lead to the initiation of ACE inhibitors unless there is a contraindication).
LV systolic function can be assessed by M-mode, 2-D and Doppler techniques. M-mode gives excellent resolution and allows measurement of LV dimensions and wall thickness. 2-D techniques are often used to provide a visual assessment of LV systolic function, both regional and global. The general validity of this has been shown but there are inter-observer variations. Visual estimation is clinically useful but unreliable in those who have poor echo images, can be limited in value in serial evaluation and inadequate where LV volumes critically influence the timing of intervention. Computer software on the echo machine may be used to provide a quantitative assessment of LV function. Certain geometrical assumptions are made about LV shape which are not always valid, particularly in the diseased heart.
M-mode (Fig. 4.1) can be used to assess LV cavity dimensions, wall motion and thickness. The phrase, ‘a big heart is a bad heart’, carries an important element of truth – poor LV systolic function is usually associated with increased LV dimensions. This is not always the case, e.g. if there is a large akinetic segment of LV wall or an apical LV aneurysm following MI, systolic function may be impaired due to regional wall motion abnormalities but M-mode measurements of LV dimensions may be within the normal range.

Fig. 4.1 M-mode of left ventricle. This can be used to estimate cavity dimensions in systole and diastole, and wall thickness. It is important to identify the continuous endocardial echo and to distinguish this from echoes from chordae or mitral valve leaflet tips.
LV internal dimension measurements in end-systole (LVESD) and end-diastole (LVEDD) are made at the level of the MV leaflet tips in the parasternal long-axis view. Measurements are taken from the endocardium of the left surface of the interventricular septum (IVS) to the endocardium of the LV posterior wall (LVPW). The ultrasound beam should be as perpendicular as possible to the IVS. Care must be taken to distinguish between the endocardial surfaces and the chordae tendineae on the M-mode tracing.
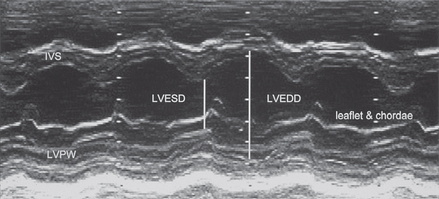
LVEDD is at the end of diastole (R wave of ECG). The normal range is 3.5–5.6 cm.
LVESD is at the end of systole, which occurs at the peak downward motion of the IVS (which usually slightly precedes the peak upward motion of the LVPW) and coincides with the T wave on the ECG. The normal range is 2.0–4.0 cm.
Remember that the normal range for LVEDD and LVESD varies with a number of factors, including height, sex and age.
M-mode measurements can be converted to estimates of volume but this is inaccurate in regional LV dysfunction and spherical ventricles. The LVEDD and LVESD measurements can be used to calculate LV fractional shortening, LV ejection fraction and LV volume, which give some further indication of LV systolic function.
Fractional shortening (FS) is a commonly used measure and is the % change in LV internal dimensions (not volumes) between systole and diastole:
The LV volume is derived from the ‘cubed equation’ (i.e. volume, V = D3, where D is the ventricular dimension measured by M-mode). This assumes that the LV cavity is an ellipse shape, which is not always correct. There are some equations which attempt to improve the accuracy of this technique. The volume in end-diastole is estimated as (LVEDD)3 and in end-systole as (LVESD)3. The ejection fraction (EF) is the % change in LV volume between systole and diastole and is:
LV wall motion and changes in thickness during systole can be measured. The IVS moves towards the LVPW and the amplitude of this motion can be used as an indicator of LV function.
Wall thickness can also be measured. The walls thicken during systole. The normal range of thickness is 6–12 mm. Walls thinner than 6 mm may be stretched as in dilated cardiomyopathy or scarred and damaged by previous MI. Walls of thickness over 12 mm may indicate LV hypertrophy, an important independent prognostic factor in cardiovascular outcome risk.
2-D echo can be used qualitatively to assess LV systolic function by viewing the LV in a number of different planes and views. An experienced echo operator can often give a reasonably good visual assessment of LV systolic function as being normal, mildly, moderately or severely impaired, and whether abnormalities are global or regional.
2-D echo can also be used to estimate LV volumes and EF. Multiple algorithms may be used to estimate LV volumes from 2-D images but all make some geometrical assumptions which may be invalid. The area–length method (symmetrical ventricles) and the apical biplane summation of discs method (asymmetrical ventricles) are validated and normal values available.
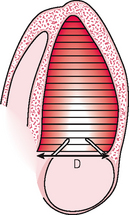
A number of techniques are available. Simpson’s method (Fig. 4.2) divides the LV cavity into multiple slices of known thickness and diameter D (by taking multiple short-axis views at different levels along the LV long axis) and then calculating the volume of each slice (area × thickness). The area is π(D/2)2. The thinner the slices, the more accurate the estimate of LV volume. Calculations can be made by the computer of most echo machines. The endocardial border must be traced accurately and this is often the major technical difficulty. Endocardial definition has improved with some newer echo technology (e.g. harmonic imaging) and automated endocardial border detection systems are available on some echo machines. The computer calculates LV volume by dividing the apical view into 20 sections along the LV long axis.
The LV ejection fraction can be obtained from LV volumes in systole and diastole (as above). Alternatively, computer-derived data can be obtained by taking and tracing the LV endocardial borders of a systolic and a diastolic LV frame.
An estimate of cardiac output can be obtained using LV volumes:
Measurements of LV shape are an important and underutilized aspect of LV remodelling, e.g. after MI. Increasing LV sphericity has prognostic importance and loss of the normal LV shape may be an early indicator of LV dysfunction. 2-D echo allows a simple assessment of LV shape (measuring the ratio of long axis length to mid-cavity diameter).
The location and extent of wall motion abnormality following MI correlates with LV EF and is prognostically useful.
Regional LV wall motion
The LV can be divided up on 2-D imaging of apical 4-chamber and parasternal short-axis views into segments (9 or 16) and an assessment can be made of these segments (Fig. 5.12). This can be useful at rest and in stress echo to determine the location of coronary artery disease (Ch. 5).
A segment’s systolic movement may be classified as:
4.3 CORONARY ARTERY DISEASE
Echo plays an increasingly important role in assessing coronary artery disease. Resting and stress echo (Ch. 5) techniques are used in:
Assessment of ischaemia
Ischaemia results in immediate changes which can be detected by echo:
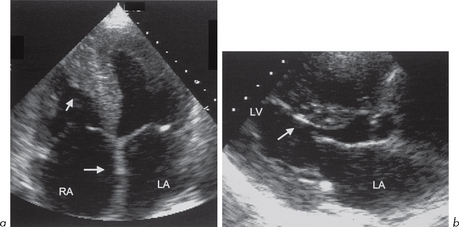
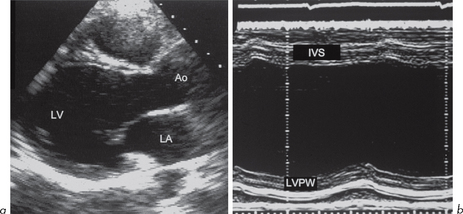
These can be detected by 2-D echo but M-mode is also extremely good because its high sampling rate makes it very sensitive to wall motion and thickening abnormalities. It is essential that the beam is at 90º to the wall. There are limited regions of the LV myocardium that can be examined by M-mode – most usefully, the posterior wall and IVS (Fig. 4.3).

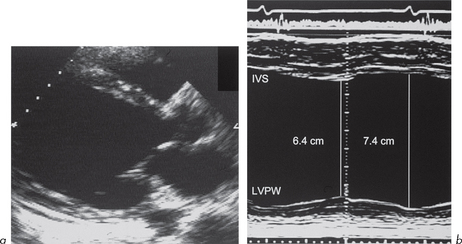
Fig. 4.3 (a) and (b) Dilated left ventricle with impaired systolic function due to coronary artery disease.
The changes reverse if ischaemia is reversed, e.g. by rest, anti-anginal medication, percutaneous transluminal coronary angioplasty, thrombolysis or coronary artery bypass grafting. If the myocardium has its blood supply occluded for more than 1 h, permanent changes occur which include MI and scarring.
Prediction of artery involved
This is done by dividing the LV into segments as described (Figs 5.12 and 5.13). Stress echo is based on this.
Assessment of myocardial infarction
Echo can help in detecting the extent of LV infarction, assessing RV involvement and detecting complications. The changes in LV function with acute MI are similar to those described for ischaemia, but rapidly become irreversible. Detection of RV involvement is important in determining treatment and prognosis (section 4.6).
Complications of myocardial infarction
Many of the complications of acute MI can be detected by echo.
In the following 2 complications (acute MR and acute VSD), LV systolic function is very active, unlike the situation above.

Fig. 4.4 (a) and (b) Papillary muscle rupture following acute myocardial infarction. The muscle (arrows) and the posterior mitral valve leaflet can be seen to prolapse into the left atrium. TOE study.
Myocardial ‘hibernation’ and ‘stunning’
The heart is critically dependent upon its blood supply. Occlusion of a coronary artery results in the cessation of myocardial contraction within 1 min. Myocardial cell death usually occurs after 15 min of ischaemia.
An impairment of contractile function may remain even after restoration of the blood supply without MI. This effect has been termed myocardial stunning (stunned heart). It may cause reversible systolic or diastolic dysfunction. Although stunned myocardium is viable, normal function may not be regained for up to 2 weeks. Recurrent episodes of ischaemia may result in the loss of normal function of the heart, and the term hibernating myocardium (hibernation) has been applied to a similar condition.
Echo assessment of coronary artery anatomy (Fig. 4.6)

Fig. 4.6 Huge dilatation of the right coronary artery (RCA, arrow) due to coronary fistula. TOE short-axis study at aortic valve level.
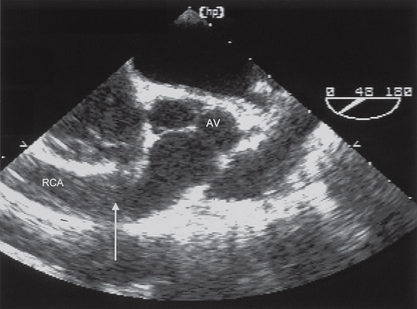
Abnormalities are more likely to be seen during TOE, e.g.
Useful information from echo in patients with heart failure
Left ventricle
Valves
4.4 CARDIOMYOPATHIES AND MYOCARDITIS
The cardiomyopathies are a diverse group of disorders. Cardiomyopathy means heart muscle abnormality, and strictly speaking the term should be applied to conditions that have no known underlying cause. These are known as idiopathic cardiomyopathies. The term has been extended to include conditions where there is an underlying cause (e.g. alcoholic, ischaemic, hypertensive cardiomyopathy etc.)
The most important idiopathic cardiomyopathies are:
1. Hypertrophic cardiomyopathy
This is an autosomal dominant condition with a high mutation rate (up to 50% of cases are sporadic). It is rare with an incidence of 0.4 –2.5 per 100 000 per year. A number of mutations of cardiac proteins have been identified as underlying causes. These include β-myosin heavy chain, myosin-binding protein C, α-tropomyosin and troponin T.
The clinical features include:
The characteristic feature is myocardial hypertrophy in any part of the ventricular wall:
Hypertrophy, particularly of the septum, may cause LV outflow tract obstruction (LVOTO). In this situation, the term hypertrophic obstructive cardiomyopathy (HOCM) is appropriate. This ‘dynamic’ obstruction becomes more pronounced in the later stages of systole. As the LV empties, LV cavity size becomes smaller and the anterior MV leaflet moves anteriorly to contact the septum. It may be present at rest or become more pronounced with exercise. In some individuals with HCM, the most dangerous time is at the end of vigorous exercise, e.g. at half-time in a football match. At this time, ventricular volumes diminish as cardiac output and heart rate decrease, catecholamine drive decreases and there may be changes in circulating electrolyte concentrations, such as K+. These features all combine to increase the risk of syncope and sudden death by increasing the likelihood of LVOTO and arrhythmias.
Echo is diagnostic of HCM. The important echo features are seen using both M-mode and 2-D imaging:

Fig. 4.7 Hypertrophic cardiomyopathy. (a) Asymmetrical septal hypertrophy (arrow). (b) Fluttering and premature mid-systolic closure of the aortic valve (arrow). (c) Continuous Doppler showing a peak velocity across the left ventricular outflow tract of 5.6 m/s (estimated peak gradient 127 mmHg).
The definition of asymmetrical hypertrophy varies but a septal to posterior wall ratio of 1.5 or more is unequivocal evidence of asymmetry.
Neither ASH nor SAM is specific for HCM. ASH may occur in AS and SAM may occur in MV prolapse. Their occurrence together is strongly suggestive of HCM.
Continuous wave Doppler shows increased peak flow through the LVOT. Pulsed wave Doppler with the sample volume in the LVOT proximal to the AV shows that the increase in velocity occurs below the level of the valve, distinguishing the obstruction from valvular aortic stenosis. The peak in maximal velocity across the AV is often bifid in HCM. There may also be features of LV diastolic dysfunction due to LVH (e.g. abnormal transmitral flow pattern with E-wave smaller than A-wave, section 4.5).
2. Dilated cardiomyopathy
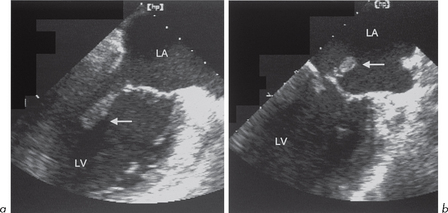
This is characterized by dilatation of the cardiac chambers, particularly the LV (although all other chambers are often involved) with reduced wall thickness and reduced wall motion (Fig. 4.8). The incidence is estimated at 6.0 per 100 000 per year. Most cases are isolated although some familial forms have been identified. The reduced LV wall motion is usually global rather than regional, as seen in LV systolic impairment due to coronary artery disease (ischaemia or infarction).

Fig. 4.8 (a) and (b) Dilated left ventricle with impaired systolic function due to dilated cardiomyopathy. Parasternal long-axis view and M-mode.
Doppler studies may show functional MR and TR.
A number of conditions give rise to a clinical picture which is similar to idiopathic dilated cardiomyopathy. These include toxins such as alcohol and certain drugs, especially those used in the treatment of some cancers.
Chemotherapy with doxorubicin produces a dose-dependent degenerative cardiomyopathy. Cumulative doses should be kept to below 450–500 mg/m2. Subtle abnormalities of LV systolic function (increased wall stress) are found in approximately 1 in 6 patients receiving only one dose of doxorubicin. Most patients who receive at least 228 mg/m2 show either reduced contractility or increased wall stress. Baseline and re-evaluation echo should be carried out in individuals receiving doxorubicin. Further administration appears to be safe if resting EF remains normal, and dangerous if EF is low. Early abnormalities of diastolic function (in the absence of systolic abnormalities) may occur in patients receiving 200–300 mg/m2.
3. Restrictive cardiomyopathy
This is characterized by increased myocardial stiffness or impaired relaxation and abnormal diastolic function of one or both ventricles. A number of disorders give rise to a clinical picture of restrictive cardiomyopathy:
The echo assessment is difficult and the features are not specific. If features of restrictive cardiomyopathy are present, evidence of myocardial infiltration or endomyocardial fibrosis should be sought. The echo differentiation between restrictive cardiomyopathy and constrictive pericarditis can be difficult but is important as it has management implications.
Echo features of restrictive cardiomyopathy
Infiltration
The findings are similar whatever the underlying cause. Amyloid is the most common infiltrative disease (Fig. 4.9). The features are:

Fig. 4.9 Amyloid heart disease. (a) There is left ventricular and right ventricular hypertrophy, with apical obliteration of the right ventricle cavity with thrombus (arrow). The atria are dilated and the interatrial septum is thickened (arrow), as are the valve leaflets. (b) Hypertrophy and speckling of the interventricular septum (arrow).
4. Myocarditis
This is inflammation of the heart muscle. The underlying cause is often not found, or it may be due to:
This is a clinical diagnosis and there may be a history suggestive of an underlying cause. The ECG often shows a resting tachycardia with widespread T-wave inversion. The echo features are not specific and are similar to those of dilated cardiomyopathy, with impaired systolic and diastolic function and evidence of new valvular regurgitation (e.g. MR). Serial echo examinations may show a change in LV function or valvular abnormalities which would support the diagnosis of myocarditis rather than dilated cardiomyopathy. There may be regional LV wall motion abnormalities in myocarditis.
4.5 DIASTOLIC FUNCTION
Clinical features of left heart failure may occur in individuals with normal or near-normal LV systolic function assessed by echo, due to diastolic dysfunction, systolic impairment on exertion or ischaemia.
Diastolic function of the LV relates to chamber stiffness and relaxation following ventricular contraction. It is not a passive phenomenon and requires energy. Abnormalities of LV diastolic function occur in a number of conditions and can be assessed by echo but their assessment is rather complex. These abnormalities may co-exist with abnormalities of systolic function, or may occur in isolation or before systolic impairment becomes obvious.
Diastole has 4 periods – isovolumic relaxation, early rapid filling, late filling and atrial systole. Abnormalities in any of these may contribute to diastolic heart failure.

Stay updated, free articles. Join our Telegram channel

Full access? Get Clinical Tree

