Several randomized trials and decision analysis models have found that remote monitoring may reduce health care utilization and expenditures in patients with cardiac implantable electronic devices (CIEDs), compared with in-office monitoring. However, little is known about the generalizability of these findings to unselected populations in clinical practice. To compare health care utilization and expenditures associated with remote monitoring and in-office monitoring in patients with CIEDs, we used Truven Health MarketScan Commercial Claims and Medicare Supplemental Databases. We selected patients newly implanted with an implantable cardioverter defibrillators (ICD), cardiac resynchronization therapy defibrillator (CRT-D), or permanent pacemaker (PPM), in 2009, who had continuous health plan enrollment 2 years after implantation. Generalized linear models and propensity score matching were used to adjust for confounders and estimate differences in health care utilization and expenditures in patients with remote or in-office monitoring. We identified 1,127; 427; and 1,295 pairs of patients with a similar propensity for receiving an ICD, CRT-D, or PPM, respectively. Remotely monitored patients with ICDs experienced fewer emergency department visits resulting in discharge (p = 0.050). Remote monitoring was associated with lower health care expenditures in office visits among patients with PPMs (p = 0.025) and CRT-Ds (p = 0.006) and lower total inpatient and outpatient expenditures in patients with ICDs (p <0.0001). In conclusion, remote monitoring of patients with CIEDs may be associated with reductions in health care utilization and expenditures compared with exclusive in-office care.
Cardiac implantable electronic devices (CIEDs), including implantable cardioverter defibrillators (ICDs), cardiac resynchronization therapy defibrillators (CRT-Ds), and permanent pacemakers (PPMs), are increasingly used to treat patients with arrhythmias, heart failure, and other risk factors for sudden cardiac death. These implantable devices introduce a need for life-long follow-up to assess the device’s function and monitor the recipient’s clinical condition. The burden of this need has motivated efforts to develop remote monitoring technologies for patients with CIEDs. Several randomized trials have demonstrated that remote monitoring, compared with conventional in-office monitoring, may be associated with reductions in routine office visits, urgent and emergent care, and hospital length of stay, and some have also reported improvements in the efficiency of device-related clinical decision making. Several of these trials have also included economic evaluations. However, the generalizability of economic outcomes from randomized trials to clinical practice is ambiguous. We aimed to address this uncertainty by assessing health care utilization and expenditures in a cohort of patients with newly implanted CIEDs who were followed remotely or with in-office monitoring.
Methods
We analyzed data from the Truven Health MarketScan Commercial Claims and Medicare Supplemental Databases from 2009 to 2011. The nationally representative databases include records from >170 million unique patients since 1995 enrolled in employer-sponsored and public health insurance plans and capture claims from physician office visits, hospital stays, and pharmacies. A protocol describing the study was submitted to the New England Institutional Review Board and deemed exempt from review (NEIRB#13-338).
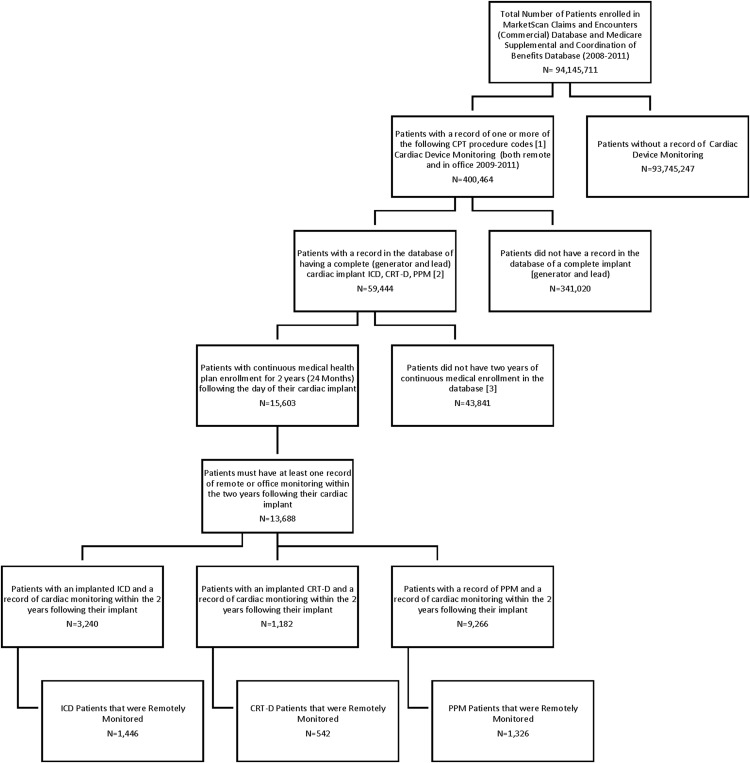
Patients were selected for study inclusion if they newly received a CIED (implant codes noted on attrition Figure 1 ) and had 2 years of continuous enrollment immediately afterward. Management with a remote monitoring system was identified with Current Procedural Terminology (CPT) codes (CPT copyright 2014 American Medical Association). Patients considered to be remotely monitored were required to have a record of at least 1 remote monitoring event in the 0- to 12-month baseline period and the 12- to 24-month follow-up period (see codes noted on attrition Figure 1 ). The 0- to 12-month period served as a baseline for patients monitored remotely or in the office because remote monitoring systems can take several months to be established and functioning. For example, in our cohort, the mean and median times from implant to the first record of remote monitoring were 6.3 and 6.4 months, respectively. Supplementary Table A lists demographics of patients included and excluded because of attrition criteria.
We assessed episodes of care and associated expenditures for office visits, remote monitoring claims, emergency department (ED) visits, and hospitalizations in the 12-month follow-up period. Because our analysis is based on medical claims, we capture only the expenditures associated with the structured billing practices allotted for continued access to the remote monitoring system and do not capture the actual intensity of the utilization by the patient. We distinguished visits resulting in discharge to home from visits resulting in hospitalization. We also assessed total expenditures, comprising ambulatory care, hospital care, radiologic testing and procedures, laboratory testing, and other services.
We compared baseline characteristics of patients with CIEDs who were followed remotely or in the office using t tests for continuous measures and chi-square tests for categorical measures. Because patients who are followed remotely may differ from patients who are followed in the office in ways that may influence subsequent health care utilization and expenditures, we developed more comparable groups using one-to-one matching based on patients’ age (within 5 years), gender, baseline ambulatory and hospital care utilization, and a propensity score. The propensity scores were derived from a logistic regression model that predicted the probability that a patient would be remotely monitored based on their co-morbidities ( International Classification of Diseases, Ninth Revision, Clinical Modification [ ICD-9-CM ] codes for co-morbidities provided in Supplementary Table B ), including diabetes, hypertension, heart failure, coronary artery disease, and stroke.
To examine the relation between remote or in-office monitoring and subsequent health care utilization and expenditures, we developed generalized linear models with a log-link. We specified a negative binomial distribution for the error term for utilization outcomes and a gamma distribution for the error term for expenditure outcomes because these outcomes are right skewed in distribution. Regression models adjusted for the presence of remote monitoring and sensitivity analyses also included propensity score and variables that were not well balanced after propensity matching. We converted model coefficients to mean marginal effects to facilitate interpretation. For ED visits and hospitalizations, our expenditure models included only patients who experienced these events. All statistical analyses were performed with SAS, version 9.2 (SAS, Cary, North Carolina).
Results
From January 2009 to December 2011, 400,464 patients were identified with medical claims for follow-up of a CIED. Patients were excluded if their CIED was not newly implanted (n = 341,020), they had <24 months of follow-up (n = 43,841), or did not have consistent monitoring in the baseline and follow-up periods (n = 1,915). This yielded 3,240 patients with ICDs, 1,182 patients with CRT-D, and 9,266 patients with PPMs in our initial sample ( Figure 1 ). From this sample, 1,127; 427; and 1,295 pairs of patients with a similar probability of being remotely monitored were identified.
The demographic and clinical characteristics for the entire population and after propensity matching are listed in Tables 1 (demographics) and 2 (co-morbidities), stratified by device type. Overall, there were few significant differences between patients followed remotely and in-office before matching, with the only common difference across devices being a higher prevalence of rural residence in patients followed with remote monitoring. After propensity matching, the cohorts in each device group were similar across all observed demographic and co-morbid disease characteristics ( Tables 1 and 2 ). Baseline health care utilization in months 0 to 12 were also similar after matching ( Table 3 ).
| Variable | ICD – Before Matching | ICD – After Matching | CRT-D – Before Matching | CRT-D – After Matching | PPM – Before Matching | PPM – After Matching | ||||||
|---|---|---|---|---|---|---|---|---|---|---|---|---|
| Remote | Office | Remote | Office | Remote | Office | Remote | Office | Remote | Office | Remote | Office | |
| Total Patients (N) | 1446 | 1794 | 1127 | 1127 | 542 | 640 | 427 | 427 | 1326 | 7940 | 1295 | 1295 |
| Age (Years) | ||||||||||||
| Mean | 64 | 65 | 64 | 65 | 69 | 68 | 69 | 69 | 74 | 76 | 74 | 74 |
| Standard Deviation | 13 | 14 | 12 | 12 | 11 | 12 | 10 | 10 | 12 | 11 | 11 | 11 |
| Age (Years) | ||||||||||||
| <18 | 0% | 1% | 0% | 0% | 0% | 0% | 0% | 0% | 0% | 0% | 0% | 0% |
| 18-29 | 1% | 1% | 0% | 0% | 0% | 0% | 0% | 0% | 1% | 0% | 0% | 0% |
| 30-39 | 3% | 3% | 2% | 2% | 1% | 1% | 0% | 0% | 1% | 0% | 0% | 0% |
| 40-49 | 8% | 8% | 7% | 8% | 4% | 5% | 3% | 3% | 2% | 2% | 2% | 2% |
| 50-59 | 22% | 22% | 24% | 24% | 16% | 18% | 16% | 15% | 7% | 6% | 7% | 7% |
| 60-69 | 28% | 26% | 29% | 28% | 23% | 26% | 24% | 27% | 17% | 14% | 17% | 17% |
| 70-79 | 28% | 26% | 28% | 27% | 40% | 32% | 41% | 38% | 38% | 33% | 38% | 38% |
| 80+ | 10% | 13% | 10% | 11% | 16% | 18% | 16% | 17% | 35% | 44% | 35% | 35% |
| Gender | ||||||||||||
| Male | 75% | 76% | 79% | 79% | 69% | 69% | 73% | 73% | 55% | 56% | 55% | 55% |
| Female | 25% | 24% | 21% | 21% | 31% | 31% | 27% | 27% | 45% | 44% | 45% | 45% |
| Insurance Coverage | ||||||||||||
| Commercial | 47% | 47% | 48% | 48% | 29% | 37% | 29% | 31% | 18% | 14% | 17% | 17% |
| Medicare | 53% | 53% | 52% | 52% | 71% | 63% | 71% | 69% | 82% | 86% | 83% | 83% |
| Region | ||||||||||||
| Northeast | 17% | 21% | 18% | 19% | 12% | 14% | 11% | 15% | 13% | 20% | 12% | 20% |
| North Central | 38% | 29% | 37% | 29% | 39% | 30% | 39% | 31% | 43% | 29% | 44% | 29% |
| South | 33% | 33% | 33% | 35% | 36% | 36% | 34% | 34% | 29% | 29% | 29% | 32% |
| West | 9% | 15% | 9% | 16% | 9% | 18% | 11% | 18% | 10% | 19% | 10% | 16% |
| Unknown | 3% | 2% | 3% | 2% | 5% | 2% | 5% | 3% | 4% | 3% | 4% | 2% |
| MSA Status | ||||||||||||
| Within a MSA | 77% | 84% | 76% | 83% | 75% | 82% | 76% | 82% | 74% | 83% | 74% | 83% |
| Outside a MSA | 20% | 15% | 21% | 15% | 21% | 15% | 19% | 15% | 21% | 15% | 21% | 15% |
| Missing | 3% | 2% | 3% | 2% | 4% | 2% | 5% | 3% | 4% | 3% | 4% | 2% |
| ICD – Before Matching | ICD – After Matching | CRT-D – Before Matching | CRT-D – After Matching | PPM – Before Matching | PPM – After Matching | |||||||
|---|---|---|---|---|---|---|---|---|---|---|---|---|
| Remote | Office | Remote | Office | Remote | Office | Remote | Office | Remote | Office | Remote | Office | |
| Total (N) | 1,446 | 1,794 | 1,127 | 1,127 | 542 | 640 | 427 | 427 | 1,326 | 7,940 | 1,295 | 1,295 |
| Rheumatoid Arthritis and Related | 2% | 1% | 1% | 1% | 2% | 2% | 2% | 2% | 3% | 2% ∗ | 3% | 2% † |
| Colon, Lung, Bronchus, or Trachea Cancer | 1% | 1% | 1% | 1% | 1% | 2% | 2% | 2% | 2% | 2% | 2% | 2% |
| Gastro esophageal Reflux Disease (GERD) | 10% | 10% | 10% | 9% | 9% | 8% | 9% | 7% | 14% | 13% | 14% | 12% ∗ |
| Depressive Disorders | 8% | 9% | 7% | 8% | 7% | 11% † | 7% | 9% | 8% | 9% | 8% | 10% † |
| Heart Failure | 74% | 77% † | 74% | 76% | 96% | 95% | 96% | 94% | 27% | 32% ‡ | 27% | 24% |
| Myocardial Infarction (MI), any | 32% | 30% | 31% | 28% ∗ | 18% | 20% | 16% | 18% | 10% | 10% | 10% | 8% |
| Angina Pectoris | 12% | 16% ‡ | 11% | 10% | 10% | 13% | 10% | 12% | 11% | 13% ∗ | 11% | 12% |
| Other Coronary Artery Disease | 77% | 79% | 77% | 78% | 77% | 76% | 79% | 74% | 49% | 55% ‡ | 49% | 50% |
| Stroke | 4% | 5% † | 2% | 1% | 4% | 6% ∗ | 3% | 5% | 6% | 7% | 6% | 5% |
| Transient Ischemic Attack (TIA) | 3% | 4% † | 2% | 3% | 3% | 5% ∗ | 3% | 5% | 5% | 7% † | 4% | 4% |
| Cardiac Dysrhythmias | 82% | 84% | 82% | 81% | 73% | 76% | 73% | 75% | 96% | 96% | 96% | 96% |
| Hypertension | 65% | 70% ‡ | 70% | 69% | 64% | 69%* | 64% | 66% | 77% | 78% | 77% | 76% |
| Osteoarthritis | 16% | 16% | 16% | 15% | 17% | 19% | 17% | 19% | 28% | 26% | 28% | 27% |
| Obstructive Chronic Bronchitis or Emphysema | 7% | 9% † | 6% | 7% | 9% | 10% | 7% | 10% | 6% | 7% | 6% | 6% |
| Diabetes | 35% | 38% † | 35% | 38% | 37% | 44% † | 39% | 39% | 29% | 31% | 30% | 32% |
| Hyperlipidemia | 58% | 53% ‡ | 58% | 56% | 50% | 48% | 52% | 46% ∗ | 50% | 49% | 50% | 49% |
| Utilization | Statistic | ICD – Before Matching | ICD – After Matching | CRT-D Before Matching | CRT-D After Matching | PPM – Before Matching | PPM – After Matching | ||||||
|---|---|---|---|---|---|---|---|---|---|---|---|---|---|
| Remote | Office | Remote | Office | Remote | Office | Remote | Office | Remote | Office | Remote | Office | ||
| Total N | 1,446 | 1,794 | 1,127 | 1,127 | 542 | 640 | 427 | 427 | 1,326 | 7,940 | 1,295 | 1,295 | |
| Inpatient Admissions | Visits | 585 | 1,050 | 406 | 434 | 211 | 350 | 148 | 149 | 464 | 3,128 | 436 | 454 |
| Mean | 0.40 | 0.59 | 0.36 | 0.39 | 0.39 | 0.55 | 0.35 | 0.35 | 0.35 | 0.39 | 0.34 | 0.35 | |
| SD | 0.80 | 1.05 | 0.79 | 0.89 | 0.74 | 0.94 | 0.71 | 0.69 | 0.64 | 0.75 | 0.62 | 0.67 | |
| Inpatient Admissions through ED | Visits | 327 | 668 | 231 | 252 | 102 | 195 | 72 | 76 | 274 | 1,793 | 255 | 267 |
| Mean | 0.23 | 0.37 | 0.20 | 0.22 | 0.19 | 0.30 | 0.17 | 0.18 | 0.21 | 0.23 | 0.20 | 0.21 | |
| SD | 0.59 | 0.84 | 0.57 | 0.74 | 0.49 | 0.69 | 0.47 | 0.54 | 0.48 | 0.56 | 0.47 | 0.52 | |
| Outpatient Office Visits | Visits | 18,253 | 23,218 | 13,724 | 13,509 | 7,445 | 9,085 | 5,841 | 5,796 | 17,541 | 113,043 | 17,042 | 17,307 |
| Mean | 12.62 | 12.94 | 12.18 | 11.99 | 13.74 | 14.20 | 13.68 | 13.57 | 13.23 | 14.24 | 13.16 | 13.36 | |
| SD | 8.85 | 9.35 | 8.48 | 8.27 | 9.60 | 10.53 | 9.87 | 9.66 | 9.10 | 9.89 | 9.09 | 8.86 | |
| Outpatient ED Visits | Visits | 1,076 | 2,046 | 772 | 898 | 383 | 610 | 284 | 286 | 1,039 | 7,381 | 1,009 | 1,012 |
| Mean | 0.74 | 1.14 | 0.69 | 0.80 | 0.71 | 0.95 | 0.67 | 0.67 | 0.78 | 0.93 | 0.78 | 0.78 | |
| SD | 1.43 | 2.76 | 1.39 | 2.22 | 1.40 | 1.67 | 1.43 | 1.34 | 1.41 | 1.65 | 1.41 | 1.38 | |
| Expenditure | |||||||||||||
| Inpatient Admissions | Patients | 413 | 664 | 280 | 280 | 158 | 237 | 111 | 111 | 365 | 2,296 | 347 | 347 |
| Mean | $23,749 | $33,761 | $24,784 | $30,886 | $24,496 | $35,605 | $26,559 | $30,186 | $16,643 | $23,559 | $15,806 | $20,453 | |
| SD | $31,064 | $65,123 | $32,058 | $51,592 | $41,706 | $75,163 | $46,876 | $62,603 | $20,645 | $43,922 | $15,703 | $30,384 | |
| Outpatient Office Visits | Patients | 1,432 | 1,773 | 1,118 | 1,113 | 535 | 628 | 422 | 419 | 1,303 | 7,820 | 1,272 | 1,280 |
| Mean | $1,099 | $1,170 | $1,037 | $1,030 | $1,179 | $1,362 | $1,160 | $1,341 | $1,111 | $1,230 | $1,103 | $1,139 | |
| SD | $855 | $1,691 | $755 | $771 | $905 | $2,445 | $911 | $2,854 | $867 | $1,269 | $863 | $871 | |
| Outpatient ED Visits | Patients | 539 | 810 | 390 | 390 | 197 | 281 | 144 | 144 | 547 | 3,534 | 531 | 531 |
| Mean | $1,308 | $1,664 | $1,290 | $1,433 | $1,134 | $1,362 | $1,150 | $1,253 | $1,384 | $1,272 | $1,392 | $1,304 | |
| SD | $1,872 | $4,629 | $1,837 | $2,263 | $1,768 | $2,055 | $1,656 | $2,147 | $2,468 | $2,372 | $2,493 | $2,583 | |
Stay updated, free articles. Join our Telegram channel

Full access? Get Clinical Tree


