Fundamentals of Doppler Echocardiography
BASIC PRINCIPLES OF ULTRASOUND
Sound waves are mechanical vibrations produced by a source that are transmitted through a medium such as air. As sound waves travel through a medium, the particles of the medium are packed (compression), alternating with being spaced apart (rarefaction). Sound waves can be represented graphically as sine waves (Fig. 9.1). The wavelength (λ) is the distance between two similar areas along the wave path and is measured in millimeters. The frequency (f) is the number of wavelengths per unit time. Frequency is expressed in hertz (Hz), which is equivalent to cycles per second. Hence, the velocity of sound in a medium (c) is the product of wavelength and frequency; and wavelength and frequency are inversely related.
c = λf
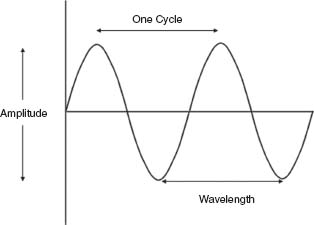
The amplitude of the sound wave (loudness) is measured in decibels (dB), which is in logarithmic scale.
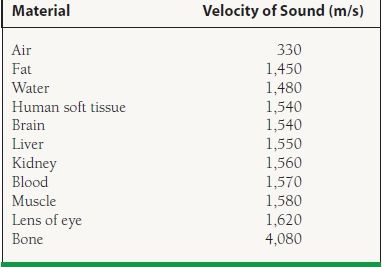
The propagation velocity of sound is determined by the stiffness of the medium and is also related inversely to its density. In human tissue, sound wave propagation velocity is 1,540 m/s (Table 9.1). Humans hear sound waves with frequencies between 20 Hz and 20 kHz; hence, ultrasound is defined as sound with frequencies higher than 20 kHz. Diagnostic medical ultrasound uses transducers with frequencies between 1 and 20 MHz.
TABLE
9.1 Velocity of Sound through Different Media
INTERACTION OF ULTRASOUND WITH TISSUE
Ultrasound beam travels in a straight line in a homogeneous medium; however, when the beam travels through a medium with two or more interfaces or in a heterogeneous medium, the path is altered. The interaction of ultrasound with tissue can be in the form of reflection, scattering, refraction, or attenuation.
When the ultrasound beam encounters a boundary between two different media, part of the ultrasound is reflected back toward the transducer and another part continues into the second medium. The amount of reflection depends on the difference in acoustic impedance between the two media. The amount of ultrasound reflected back is constant, but the amount received back at the transducer varies with the angle of the ultrasound beam to the tissue interface. Because the angles of incidence and reflection are equal, optimal return of the reflected ray occurs when the beam is perpendicular (90 degrees) to the tissue interface.
Scattering occurs when the ultrasound beam strikes smaller structures, less than one wavelength in the lateral dimension. This results in the ultrasound beam being radiated in all directions, with a minimal amount returning to the transducer. Scattering of ultrasound produced from moving red blood cells is the principle behind Doppler echocardiography.
When the speed of sound differs in the two media, the acoustic impedance is different, and the ultrasound waves in the second medium are deflected from their original orientation. This is known as refraction. Because blood and most tissues have similar sound velocities, this is not a prominent effect in echocardiography.
When ultrasound travels through a biologic medium, part of the energy is absorbed and converted into heat. This process whereby ultrasound signal strength reduces is called attenuation. The degree of attenuation depends on the ultrasound frequency and on the differences in acoustic impedances between the two media. Lower ultrasound frequencies have a lower attenuation and penetrate deeper into tissues. Air has high acoustic impedance, which causes significant attenuation if there is any air between the transducer and the body tissue. Applying water-soluble gel on the transducer minimizes contact with air and hence attenuation.
TRANSDUCERS
The ultrasound transducer is the small hand-held probe that transmits acoustic energy and receives the returning echoes. Piezoelectric crystal converts electrical energy into sound energy and vice versa. Piezoelectric elements lack a center of symmetry and are anisotropic. When an electric current is applied, the polarized particles within the crystal are aligned, causing the crystal to expand and produce a mechanical effect. This is known as the direct piezoelectric effect. An alternating current causes the crystal to compress and expand alternately, which produces an ultrasound wave by compressions and rarefactions. Piezoelectric crystals generate an electric current when their shapes are altered while being struck by ultrasound waves. Therefore, the transducer functions both as a transmitter, transmitting a burst of ultrasound, and as a receiver, receiving the ultrasound signals reflected by internal tissue interfaces. A typical pulse lasts for only 1 to 6 µs.
The transducer frequency is determined by the nature and thickness of the piezoelectric element.
Image formation is based on the time interval between the ultrasound transmission and the arrival of its reflected signal. Deeper structures have longer flight times (Fig. 9.2). The time delay between transmission and reception is determined by the depth (d) of a certain structure and the speed of sound in blood:
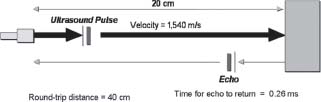
FIGURE 9.2 The time for the ultrasound beam to return to the transducer from a particular structure is a measure of the structure’s distance from the transducer.
d = ct / 2
The factor 2 appears because t includes the time to and from the object. Knowing that the speed of sound in blood is 1,540 m/s,
d = 77t cm (t in ms)
Resolution of the imaging system is defined as the smallest distance between two points that can be distinguished by the system as separate entities. Axial resolution refers to the ability to differentiate between points lying along the path or axis of the ultrasound beam. Lateral resolution refers to the ability to differentiate between points that are lateral to the beam, relative to the beam. Axial resolution is related to the ultrasound’s wavelength, frequency, and the duration of the transmitted pulse. Lateral resolution is dependent on the distance of the specular reflector to the transducer and is a function of the beam width, which is defined as the diameter of the beam at a particular point. In the near field, the beam is maintained as a cylinder with a diameter comparable to the transducer. However, at points farther away from the transducer, the beam diverges and widens into a cone. This area is the far field. Beam width is a function of transducer size, shape, frequency, and focusing. The larger the transducer, the longer the near field is.
The lateral resolution is dependent on the gain of the system. Specular reflectors along the center of the beam produce stronger echoes than those that are at the beam margins. When the gain or sensitivity is set low, echoes from beam margins with lower amplitude may not be recorded, which makes the beam appear narrower. With higher gain, the echoes at the margins are recorded, and the beam width appears greater.
IMAGING MODALITIES
There are several imaging modalities in echocardiography. A and B modes have only historical importance. M mode (motion) displays axial information along a single scan line, displaying depth on the vertical axis and time on the horizontal axis. This provides high temporal resolution and rapid sampling rates, with the ability to visualize wall or valve motion. M-mode measurements have been the standard in echocardiography in quantifying chamber size and endocardial thickening (Fig. 9.3).
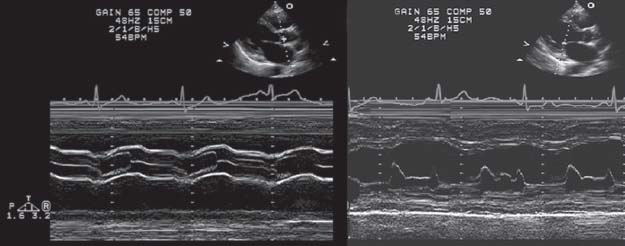
FIGURE 9.3 M-mode display.
Through parallel processing, the data from each scan line are analyzed separately, which increases the frame rate.
Two-dimensional (2-D) echocardiographic imaging is generated by sweeping ultrasound beam through an arc across a particular area of the heart. Electronic sweeping is accomplished by the use of phased array transducers. Transducer arrays are groups of individual transducers or transducer elements. Linear arrays are a group of transducers or transducer elements lined up next to each other in a straight row. The transducers are then pulsed individually or in groups. This requires a large window, which limits their use in cardiac imaging. Phased arrays contain multiple element transducers that sweep the ultrasound beam electronically through an arc. Exciting the transducers in sequence generates an ultrasound wave that propagates at an angle to the transducer and sweeps the beam from side to side.
A focused transducer is used to decrease diversion in the far field of the ultrasound beam. By placing a concave acoustic lens on the transducer surface or by altering the transducer curvature, the ultrasound beam is narrowed at a point away from the transducer. The focal zone is the area where the beam is narrowest and divergence is smallest. Phased array transducers can also focus the beam electronically by altering the shape of the wavefront according to the timing of firing of the individual transducer elements.
Two-dimensional echocardiography displays ultrasound data in a spatial orientation relative to time and localize depth by the reflected wave timing. This limits the amount of data that can be collected in a period of time and hence temporal resolution. The pulse duration (PD) is the time needed for the pulse to travel from the transducer to the tissue and back. This is dependent on the depth of the tissue and the speed of sound in that tissue:
PD = 2d / c
The pulse repetition frequency (PRF) is the rate at which individual pulses are transmitted (per second) and is equal to c/2d. Since the speed of sound in human tissue is 1,540 m/s, this translates to:
PRF = 77/d pulses/ms
The number of lines per sweep depends on the time taken to produce one scan line and the time set for each sweep. The frame rate is the number of images acquired per second. In cardiac applications, the frame rate is typically >30 frames per second. A higher frame rate is preferred to visualize myocardial and valvular motion well. However, increasing the frame rate leads to fewer scan lines per frame, resulting in less data acquired per frame and therefore decreased image quality.
Echoes received by tissues produce vibrations within the piezoelectric crystal that translate into a small voltage. To form a final image, the electrical signal goes through complex signal processing that initially is amplified by a radiofrequency amplifier and compressed logarithmically in order to be displayed in varying shades of gray.
Serial processing occurs when one scan line is produced for each ultrasound pulse. This method limits the frame rate. With phased array transducers, it is possible to send out several scan lines simultaneously in different directions. Through parallel processing, the data from each scan line are analyzed separately, which increases the frame rate.
Dynamic range (expressed in decibels) refers to the amplitude ratio of largest signal displayed to the smallest signal detected above the system noise. Noise is a combination of all signals that reach the transducer from structures outside the ultrasound beam axis. These signal amplitudes are compressed into shades of gray, where the gray scale displays strong and weak echoes in various shades of gray. The dynamic range consists of the number of levels of gray in an image and can be adjusted.
Echo image data are obtained in a polar coordinate system and are converted into a video image by means of a digital scan converter.
Attenuation occurs when deeper structures produce weaker echoes than structures closer to the transducer. Electrical energy produced by these echoes is therefore less. Time gain compensation applies greater amplification for echoes returning at longer intervals from the initial pulse, which corresponds to the depth of the structure. As attenuation varies in individuals, time gain compensation can be adjusted by the user. Near-field gain can be set lower while far-field gain can be gradually increased to achieve better image quality.
HARMONIC IMAGING
When a sound pulse of frequency fo propagates through tissues, nonlinear interactions occur, generating a pulse with frequencies at multiples of the fundamental frequency fo: 2fo (second harmonic), 3fo (Fig. 9.4A,B). This is caused by minor distortions in the tissue, producing a very slight change in the shape of the wave as it propagates.
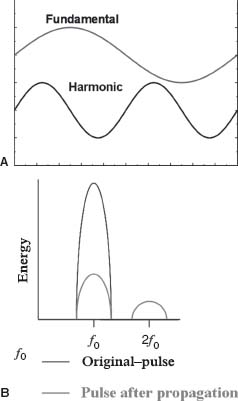
FIGURE 9.4 A: Tissue harmonic imaging utilizes pulse frequencies at multiples of the fundamental frequency f0. B: Harmonic frequencies are of lower energy than the fundamental frequency.
The energy of these harmonic frequencies returning from the tissue is significantly less than the fundamental frequency. In order to benefit from harmonic imaging, the fundamental frequency needs to be filtered out, so that only the harmonic frequencies are passed to the demodulator.
Harmonic generation increases with the distance of propagation and that there is a nonlinear relation between fundamental and harmonic frequency energies. These aspects of harmonic imaging help to understand why it is useful in reducing near-field artifacts (low harmonic energy close to the transducer) and side-lobe artifacts.
Second harmonic tissue imaging is now used routinely in adult echocardiography. The benefits can be striking particularly in patients with difficult images. In general, there is an improved signal-to-noise ratio with brighter tissue and superior endocardial definition. Of note, valvular structures appear thicker when imaged using second harmonics compared to fundamental imaging. In some cases, it may be useful to turn harmonic on and off when evaluating valve leaflets.
Another use of harmonic imaging is contrast echocardiography. New contrast agents have been manufactured with very small (1- to 5-μm) bubbles capable of crossing the pulmonary capillary bed. The contrast effect is produced by microbubbles having different acoustic impedances than blood, causing the reflection and scattering of ultrasound. Ultrasound causes compressions and rarefactions of the microbubbles with a resonant frequency that is inversely related to the diameter of the microbubble. This ultrasoundmicrobubble interaction also generates harmonic frequencies. Compared to soft tissue, the microbubbles are strong reflectors, so tuning the ultrasound receiver to the second harmonic frequency displays the contrast agent preferentially within the image.
The approved indication for contrast imaging is left ventricle opacification. In patients with limited views, contrast significantly improves endocardial definition. Its main application is in suspected wall motion abnormalities at rest and after stress, or in suspected left ventricular (LV) thrombus. The use of contrast agents for myocardial perfusion, although promising, is still investigational. Myocardial perfusion and viability are potential uses of this technique, although they have not been approved for clinical use.
THREE-DIMENSIONAL ECHOCARDIOGRAPHY
Two-dimensional echocardiography is now the standard ultrasound imaging modality, although 3-D imaging is increasingly adopted as it provides a different imaging approach and several distinct advantages over 2-D echocardiography. Initially, 3-D images are constructed and displayed using conventional 2-D imaging with a multiplanar transducer. Tomographic slices of the heart are obtained and constructed into a 3-D image.
Image acquisition relies on matrix array transducer that replaces a single row of elements found in the conventional linear 1-D transducer with a 2-D grid of elements. As in a linear array transducer, the timing of individual transducer elements transmitting and receiving ultrasound energy controls the direction of the ultrasound beam. A matrix array transducer offers steering in both within a slice and elevation of a beam, allowing for interrogating the entire pyramid-shaped volume.
Parallel processing allows the volumetric device to receive multiple lines for any given transmit line to generate the 3-D volume. Real-time 3-D, “Live 3-D,” imaging can be performed at a lower temporal resolution (volume per second). Alternatively, a segmented “full-volume” 3-D dataset is obtained at higher temporal resolution by combining data from several cardiac cycles via ECG gating. The latter has the option of displaying images with color Doppler mapping. In the above 3-D image acquisition modes, datasets can be analyzed offline in either volumerendered or multiplanar reconstruction modes. Offline analysis tools are especially useful for accurately quantifying volume and mass, as well as visualizing complex anatomical abnormalities.
Three-dimensional echo is commercially available for both transthoracic and transesophageal echocardiography. This technique has distinct advantage over 2-D echocardiography including chamber quantification, valvular heart disease especially mitral valve diseases, congenital heart disease, and intraoperative applications.
DOPPLER ECHOCARDIOGRAPHY
Doppler echocardiography utilizes the Doppler principle to determine the direction, velocity, character, and timing of blood flow within the cardiovascular system. The Doppler principle states that the frequency reflected on a moving object is a higher observed frequency than when it moves away from the observer. The Doppler shift ( F) is the difference in frequency between the received frequency (Fr) and the transmitted frequency (Ft):
ΔF = Fr – Ft
Signal backscatter from small moving objects such as red blood cells produces a change in frequency of the signal, creating a Doppler effect. The Doppler shift is related to the velocity of the moving source (V):
ΔF.α.V =ΔF = V / λ
Knowing that λ = c/f, and that the speed of sound tends to remain constant in tissue, change in the transmitted frequency will alter the wavelength. Therefore,
λ = c / Ft = V / ΔF
Rearranging this expression produces:
ΔF = V ·Ft / c
The ultrasound beam may be at an angle to the direction of blood flow. The true velocity is equal to the measured velocity divided by the cosine of the angle θ. Therefore,
ΔF = F t·V·cosθ/c
where V is the true velocity of blood flow. As the sound path consists of the transmitted portion from the transducer to tissue and the reflected portion from the tissue back to the transducer, the equation is multiplied by 2, which produces the final Doppler equation:
ΔF = 2Ft·V· cosθ/c
Since it is the velocity of the moving object that is of interest, rearranging the equation produces:
V = ΔF·c/(2Ft· cosθ)
The angle the ultrasound beam makes with the direction of blood flow is important. When the beam is parallel to the direction of flow, the angle is 0 degrees and cos 0 degrees = 1. When the beam is perpendicular to the direction of flow, the angle is 90 degrees and cos 90 degrees = 0, which means that there is no Doppler shift. Angles <20 degrees result in a <6% change in the recorded velocity. Thus, the effect of the beam angle on Doppler shift becomes more important when the angle is greater. For example, if the angle is 60 degrees, cos 60 degrees = 0.5, which leads to a 50% velocity error. This is important when calculating velocities in areas with abnormal blood flow, as in valvular stenosis.
The difference between transmitted and backscattered signals received by the transducer is determined by comparing the two waveforms. The frequency content is analyzed by fast Fourier transform. The display generated is known as a spectral analysis, with time displayed on the x axis and frequency shift or blood velocity on the y axis. Frequency shifts toward the transducer are displayed above the baseline, whereas frequency shifts away from the transducer are below the baseline. There are multiple frequencies for every given point in time, and each amplitude is displayed corresponding to its brightness (by gray or color scale). Therefore, the spectral display produces information on the direction of blood flow, the velocity (or frequency shift), and the signal amplitude.
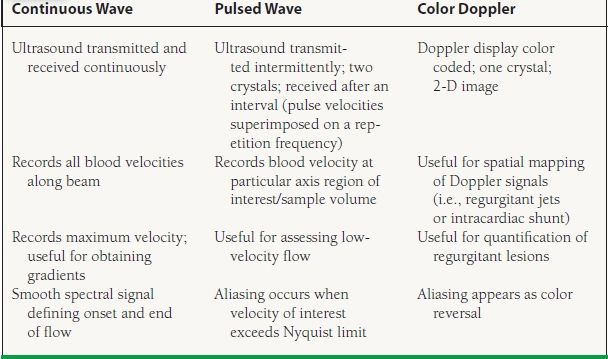
Three different modalities are used in Doppler echocardiography: continuous-wave Doppler, pulsed-wave Doppler, and color Doppler flow mapping. Each modality is processed differently (Table 9.2).
TABLE
9.2 Comparison of Continuous Wave, Pulsed Wave, and Color Doppler