Potent statin therapy has been demonstrated to reduce cardiovascular events. Although statins have been considered to stabilize atherosclerotic plaque, this effect has not been well characterized in vivo. We investigated the relation between potent statin therapy and plaque microstructures imaged by frequency-domain optical coherence tomography. Two hundred ninety nonculprit lipid plaques in 275 patients with stable coronary artery disease receiving atorvastatin or rosuvastatin were analyzed. Patients were stratified into no statin, low-, and high-dose statin groups. Plaques in the high-dose statin group demonstrated a smaller lipid arc (p = 0.02) and a greater fibrous cap thickness (p = 0.01). In patients receiving statin therapy, high-dose statin therapy was associated with a greater fibrous cap thickness in patients with smaller (148.2 ± 30.5 vs 105.3 ± 41.1 μm, p = 0.004) but not larger lipid index (91.1 ± 32.6 vs 78.1 ± 43.3 μm, p = 0.21). In conclusion, potent statin therapy is associated with less vulnerable plaque features on frequency-domain optical coherence tomography imaging. This finding varies according to the size of plaque lipid content, being less effective in lipid-loaded plaques.
Over the past decade, 3-hydroxy-3-methylglutaryl coenzyme A reductase inhibitors or statins have been demonstrated to have a variety of benefits for atherosclerotic diseases. Recent clinical studies have shown further reduction in cardiovascular event rates and plaque reduction under potent statin therapy. Plaque stabilization has been considered as an additional statin-mediated benefit, potentially contributing to the prevention of future acute coronary events. Given that statins modify low-density lipoprotein cholesterol (LDL-C) levels and inflammatory activities related to plaque instability, potent statin therapy may have more enhanced plaque stabilization effects. Frequency-domain optical coherence tomography (FD-OCT) enables to provide detailed plaque microstructural characterization associated with plaque vulnerability. In the present study, we used FD-OCT to elucidate plaque microstructures under potent statin therapy.
Methods
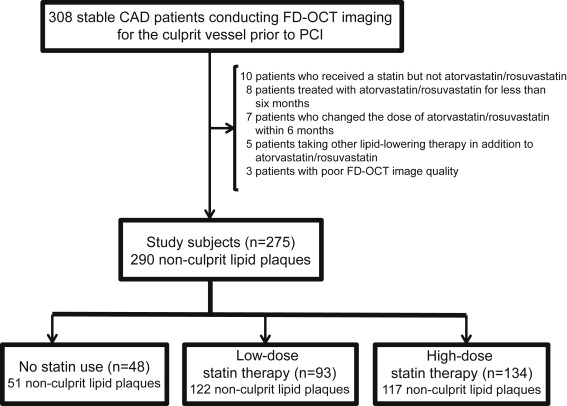
The Cleveland Clinic FD-OCT registry is a single-center prospective registry to enroll clinically stable patients with coronary artery disease conducting FD-OCT imaging for the culprit vessel before the scheduled percutaneous coronary intervention (PCI). All the study subjects had ischemic symptoms or evidences despite taking medical therapies. Evidence of suspected cardiac ischemia was demonstrated by electrocardiography, echocardiography, or stress exercise test. Patients with acute coronary syndrome, cardiogenic shock, chronic total occlusion within target vessel, congestive heart failure, a left main disease, a history of PCI within the culprit vessel, and renal failure are not enrolled. The present study included patients who received a fixed dose of atorvastatin or rosuvastatin for at least 6 months before PCI. Patients who were not treated by any statin were also included ( Figure 1 ). We excluded (1) 10 patients taking a statin but not atorvastatin or rosuvastatin, (2) 8 patients treated with atorvastatin or rosuvastatin for <6 months before PCI, (3) 7 patients who changed the dose or type of statin during the preceding 6 months, (4) 5 patients taking other lipid-lowering therapy in addition to a statin, and (5) 3 patients having poor image quality. Of 308 patients enrolled into this registry, the remaining 275 patients with stable coronary artery disease were analyzed. Study subjects were stratified into 3 groups as follows: no statin (n = 48), low-dose statin (n = 93), and high-dose statin (n = 134). A high-dose statin was defined as the dose of atorvastatin and rosuvastatin ≥40 and 20 mg, respectively. The study was approved by the Institutional Review Board committee at the Cleveland Clinic, and all patients gave written informed consent before enrollment.
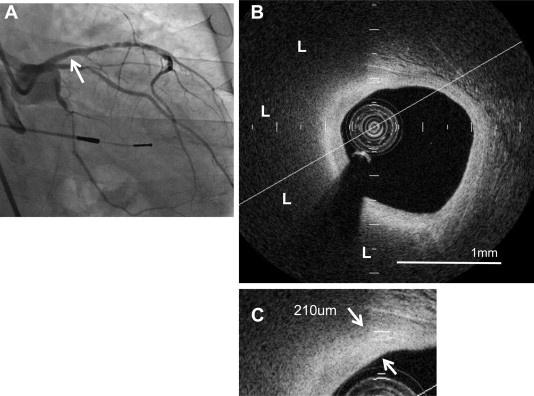
Intravascular FD-OCT imaging of the target vessel was performed before PCI as previously described. Briefly, after intracoronary administration of nitroglycerin (100 to 300 μg), an FD-OCT (C7-XRTM OCT Intravascular Imaging System; St. Jude Medical, St. Paul, Minnesota) was advanced to the distal site of the target artery. The FD-OCT pullback was performed at 20 mm/s during the continuous injection of contrast media through the guiding catheter. Multiple FD-OCT pullbacks were required to image the entire target vessel. Each FD-OCT imaged segment was overlapped using a side branch as a landmark. The raw FD-OCT data were anonymized and transferred to an open-source software, ImageJ (National Institutes of Health, Bethesda, Maryland). All FD-OCT images were analyzed at the Atherosclerosis Imaging Core Laboratory of Cleveland Clinic by 2 experienced investigators who were blinded to the clinical presentations. Any discrepancies between the observers were resolved by consensus. Nonculprit lipid plaques with <70% diameter stenosis by quantitative coronary angiography were analyzed ( Figure 2 ). The nonculprit plaques were defined as any plaque for which PCI was not performed. Each plaque was separated by at least 5 mm from the edge of any other plaque or implanted stent edge. Lipid plaques were defined as a low-signal region with diffuse border. Lipid arc, length, and index, as well as fibrous cap thickness, were measured in every frame through the entire length of lipid-rich plaques as follows. Lipid arc was measured in every cross-sectional frame and then averaged. Lipid length was calculated on the basis of the number of frames containing lipid-rich plaques. Lipid index was defined as the mean lipid arc multiplied by lipid length. The fibrous cap thickness was defined as the minimum distance from the coronary artery lumen to the inner border of lipid. The average of 3 measurements at its thinnest part was used for the analysis. Thin-cap fibroatheroma was defined as a lipid plaque containing lipid arc ≥90° and the thinnest part of fibrous cap thickness ≤65 μm. A microchannel was defined as a no-signal tubuloluminal structure without a connection to the vessel lumen recognized on >3 consecutive cross-sectional OCT frames. Calcification was defined as a signal-poor or heterogeneous region with a sharply delineated border. Intracoronary thrombus was identified as a mass protruding into the vessel lumen from the surface of the vessel wall. The interobserver and intraobserver correlation coefficients were 0.87 and 0.91 for lipid plaque, respectively. Interobserver and intraobserver coefficients and differences for fibrous cap thickness measurements were 0.90 and 0.96, and 18 ± 16 and 13 ± 11 μm, respectively.
Continuous variables are expressed as mean ± SD or median and categorical variables as percentage. The chi-square test was used to test for differences in categorical variables between groups, and continuous data were compared using unpaired t tests or Mann-Whitney log-rank tests when the variable was not normally distributed. A multivariate logistic analysis was used to determine the significant factors related to a fibrous cap thickness of >84 μm. A value of p <0.05 was considered significant. All statistical analyses were performed using SAS software, version 9.1.3 (SAS Institute, Cary, North Carolina).
Results
Baseline clinical characteristics are listed in Table 1 . Patients treated with high-dose statin were more likely to be men (p = 0.04). Greater prevalence of hypertension was observed in patients taking low-dose statin (p = 0.03). There were no significant differences in the use of atorvastatin and rosuvastatin between low-dose and high-dose statin groups (p = 0.51 and 0.50, respectively). The average duration of low- and high-dose statin use was similar in both groups (p = 0.61). The use of other antiatherosclerotic medical therapies was also identical. With regard to risk factor control, lower levels of LDL-C (p = 0.006), total cholesterol (p = 0.01), and triglyceride (p = 0.04) were observed in patients treated with a high-dose statin. The high-density lipoprotein cholesterol level was higher in these patients compared with no statin and low-dose statin groups (p = 0.001). There were no significant differences in other biochemical parameters and blood pressure.
| Variables | No Statin (n = 48) | Statin Dose | p-Value | |
|---|---|---|---|---|
| Low (n = 93) | High (n = 134) | |||
| Age (years) | 61.5 ± 9.3 | 63.1 ± 11.1 | 60.8 ± 9.3 | 0.24 |
| Men | 30 (62%) | 60 (64%) | 107 (79%) | 0.04 |
| Body mass index (kg/m 2 ) | 30.5 ± 6.0 | 31.7 ± 6.5 | 30.9 ± 5.0 | 0.96 |
| Hypertension | 27 (56%) | 74 (79%) | 88 (65%) | 0.03 |
| Hyperlipidemia | 32 (66%) | 71 (76%) | 115 (85%) | 0.08 |
| Diabetes mellitus | 22 (45%) | 33 (35%) | 48 (35%) | 0.09 |
| Current smoker | 7 (14%) | 11 (11%) | 21 (15%) | 0.30 |
| Prior myocardial infarction | 14 (29%) | 31 (33%) | 38 (28%) | 0.38 |
| Peripheral artery disease | 2 (4%) | 6 (6%) | 4 (2%) | 0.61 |
| Medication | ||||
| Atorvastatin | — | 65 (69%) | 86 (61%) | 0.51 ∗ |
| Dose (mg) | — | 25.8 ± 11.9 | 70.5 ± 13.7 | <0.001 ∗ |
| Rosuvastatin | — | 28 (30%) | 51 (38%) | 0.50 ∗ |
| Dose (mg) | — | 7.3 ± 2.8 | 28.1 ± 5.6 | <0.001 ∗ |
| Duration of statin use (days) | — | 519.8 ± 322.5 | 471.6 ± 291.3 | 0.61 ∗ |
| Angiotensin converting enzyme inhibitor | 21 (43%) | 41 (44%) | 69 (51%) | 0.06 |
| Beta blockers | 33 (68%) | 76 (81%) | 95 (70%) | 0.15 |
| Aspirin | 47 (97%) | 92 (98%) | 133 (99%) | 0.90 |
| Calcium channel blocker | 7 (14%) | 19 (20%) | 22 (16%) | 0.52 |
| Risk factor control | ||||
| Total cholesterol (mg/dl) | 181.6 ± 48.4 | 176.2 ± 45.1 | 158.1 ± 35.8 | 0.01 |
| Triglyceride (mg/dl) | 135.0 (79.0, 241.0) | 127.0 (70.0, 223.0) | 114.0 (66.0, 172.0) | 0.04 |
| Low-density lipoprotein cholesterol (mg/dl) | 103.1 ± 37.9 | 96.3 ± 40.7 | 80.5 ± 31.2 | 0.006 |
| High-density lipoprotein cholesterol (mg/dl) | 38.8 ± 10.7 | 40.7 ± 11.1 | 42.8 ± 15.6 | 0.001 |
| Fasting blood glucose (mg/dl) | 125.2 ± 20.1 | 115.5 ± 23.2 | 131.7 ± 12.8 | 0.11 |
| Systolic blood pressure (mm Hg) | 130.8 ± 14.5 | 133.6 ± 11.2 | 135.2 ± 16.1 | 0.88 |
| Diastolic blood pressure (mm Hg) | 81.6 ± 7.1 | 85.2 ± 8.9 | 86.2 ± 8.4 | 0.85 |
∗ Two group comparison (low-dose vs high-dose statin group).
PCI was conducted in all study subjects, and the average number of lesions treated with PCI in no statin, low-, and high-dose statin groups was 1.1 ± 0.3, 1.2 ± 0.4, and 1.1 ± 0.2 per vessel, respectively (p = 0.89). The imaged length in no statin, low-, and high-dose statin groups was 76.3 ± 16.0, 75.1 ± 16.2, and 74.5 ± 18.0 mm, respectively (p = 0.80). Throughout imaged coronary arteries, we identified a total of 290 nonculprit lipid plaques in the present study subjects. FD-OCT measurements are listed in Table 2 . Almost 1/2 of lipid plaques in the study subjects were located in the left descending artery. Lipid plaques in the high-dose statin group exhibited a smaller lipid arc (p = 0.03), a shorter length of lipid plaques (p = 0.006), and a smaller lipid index (p = 0.001). In addition, a greater fibrous cap thickness (p = 0.01) and a lesser frequency of thin-cap fibroatheroma (p <0.001) and microchannel (p = 0.01) were observed in the high-dose statin group. Multivariate logistic regression models demonstrated that high-dose statin use was significantly associated with fibrous cap thickness >84 μm (odds ratio 1.689, 95% confidence interval 1.248 to 1.891, p = 0.009; Table 3 ). Atorvastatin and rosuvastatin uses were not significant predictors for fibrous cap thickness >84 μm ( Table 3 ).
| Variables | No Statin (51 Plaques) | Statin Dose | p-Value | |
|---|---|---|---|---|
| Low (122 Plaques) | High (117 Plaques) | |||
| Coronary plaque location | ||||
| Left anterior descending artery | 27 (52%) | 59 (48%) | 57 (49%) | 0.85 |
| Left circumflex artery | 14 (27%) | 32 (26%) | 30 (25%) | 0.92 |
| Right coronary artery | 10 (19%) | 31 (26%) | 30 (26%) | 0.80 |
| Frequency-domain optical coherence tomographic measures | ||||
| Averaged lipid arc (°) | 238.2 ± 103.5 | 219.1 ± 98.1 | 161.2 ± 88.5 | 0.03 |
| Lipid length (mm) | 8.8 ± 7.5 | 7.5 ± 6.5 | 5.0 ± 4.3 | 0.006 |
| Lipid index (mm°) | 1741.3 ± 1300.5 | 1370.8 ± 1117.8 | 854.7 ± 740.3 | 0.001 |
| Fibrous cap thickness (um) | 74.0 ± 34.1 | 91.0 ± 32.5 | 116.0 ± 35.6 | 0.01 |
| Thin-cap fibroatheroma | 27 (52%) | 24 (20%) | 9 (8%) | <0.001 |
| Microchannel | 35 (68%) | 45 (37%) | 20 (17%) | 0.01 |
| Plaque rupture | 5 (9%) | 17 (13%) | 12 (10%) | 0.82 |
| Thrombus | 1 (1%) | 2 (1%) | 2 (1%) | 0.90 |
| Calcium | 26 (50%) | 64 (52%) | 72 (61%) | 0.20 |
Stay updated, free articles. Join our Telegram channel

Full access? Get Clinical Tree


