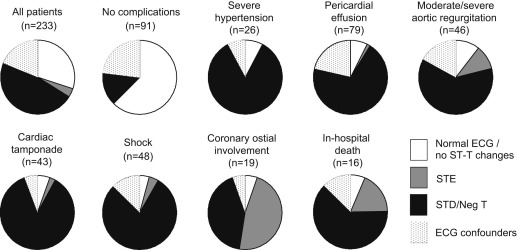
Although patients with Stanford type A acute aortic dissection often show ST-T abnormalities at presentation, the frequency and implication of such findings remain unclear. To clarify these points, admission electrocardiograms from 233 patients admitted ≤6 hours after symptom onset who underwent emergency surgery for type A acute aortic dissection were studied. The prevalence of electrocardiographic (ECG) patterns was 51% for ST-T abnormalities (4% for ST-segment elevation and 47% for ST-segment depression and/or negative T waves), 30% for normal ECG findings or no significant ST-T changes, and 19% for ECG confounders such as bundle branch block or left ventricular hypertrophy. Patients with ST-T abnormalities had higher prevalence of pericardial effusion (48% vs 9% and 38%), cardiac tamponade (28% vs 3% and 18%), moderate or severe aortic regurgitation (28% vs 7% and 18%), shock on admission (34% vs 3% and 13%), coronary ostial involvement (14% vs 1% and 2%), concomitant coronary artery bypass surgery (9% vs 1% and 0%), and in-hospital mortality (11% vs 1% and 4%) compared with patients with normal ECG findings or no significant ST-T changes and those who had ECG confounders (p <0.05 for all). On multivariate analysis, ST-T abnormalities were the only independent predictor of in-hospital mortality (odds ratio 3.87, 95% confidence interval 1.02 to 14.7, p = 0.035). In conclusion, about 50% of patients who underwent emergency surgery for type A acute aortic dissection had ST-T abnormalities, characterized predominantly by ST-segment depression or negative T waves, in the acute phase. ST-T abnormalities were associated with more complicated features and independently predicted in-hospital death.
Stanford type A acute aortic dissection (AAD) is a serious cardiovascular emergency requiring urgent surgery. In patients with type A AAD, acute coronary syndrome (ACS)–like ST-T changes such as ST-segment elevation (STE), ST-segment depression (STD), and negative T waves have been shown to be frequently observed on admission electrocardiography. However, the prevalence of ST-T abnormalities during the acute phase of type A AAD, clinical features associated with such changes, and its prognostic impact remain unclear. To clarify these points, we studied a series of patients who were admitted ≤6 hours after symptom onset and underwent emergency surgery for type A AAD.
Methods
Of patients with diagnoses of spontaneous type A AAD who were admitted to our center from June 2003 to April 2012, 233 patients who fulfilled the following criteria were studied: (1) admission ≤6 hours after symptom onset, (2) no previous myocardial infarction, (3) no treatment with drugs with potential effects on electrocardiographic (ECG) findings, (4) fully assessable electrocardiograms on admission, and (5) emergency surgery for type A AAD. The diagnosis of type A AAD was based on computed tomography in 227 patients, transthoracic echocardiography in 4 patients, and aortography in 2 patients and was confirmed by direct visualization by a cardiac surgeon at the time of surgery. The study was approved by the ethics committee of our institution, and all subjects gave informed consent.
Standard 12-lead electrocardiograms were recorded on admission at a paper speed of 25 mm/s and an amplification of 10 mm/mV. All electrocardiograms were examined by a single investigator who was blinded to all other clinical data. ST-segment shifts were measured at the J point.
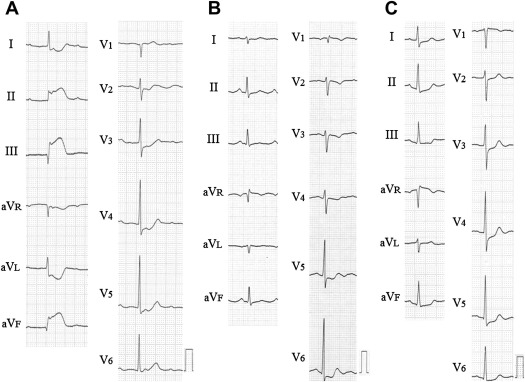
STE was considered present if the deviation in leads V 2 and V 3 was ≥0.2 mV in men aged ≥40 years, ≥0.25 mV in men aged <40 years, and ≥0.15 mV in women and the deviation in ≥2 other contiguous leads was ≥0.10 mV. STD was considered present if the ST segment was horizontal or downsloping and the deviation was ≥0.05 mV in 2 contiguous leads, and negative T waves were considered present if the depth was ≥0.10 mV in 2 contiguous leads. Standard criteria were used to diagnose right bundle branch block and left bundle branch block. Left ventricular hypertrophy was defined using the Sokolow-Lyon voltage definition. Patients were divided into 3 groups according to the following ECG patterns: (1) normal ECG findings or no significant ST-T changes, (2) ECG confounders (bundle branch block or left ventricular hypertrophy), and (3) ST-T abnormalities (STE, STD, or negative T waves). Patients who had ST-T abnormalities were subdivided into those with STE and those with STD and/or negative T waves ( Figures 1 and 2 ).
Blood samples for measurement of hemoglobin and creatinine levels were obtained on admission. Anemia was defined according to the World Health Organization guidelines as a hemoglobin concentration <13.0 g/dl in men and <12.0 g/dl in women. Serum creatinine levels were used to calculate the estimated glomerular filtration rate, calculated using the prediction equation proposed by the Japanese Society of Nephrology. Renal dysfunction was defined as an estimated glomerular filtration rate <60 ml/min/1.73 m 2 . Cardiac-specific troponin T or I and d-dimer were simultaneously measured in 184 and 108 patients, respectively.
Standard definitions were used to define shock and cardiac tamponade. Moderate or severe aortic regurgitation was considered hemodynamically significant. Pericardial effusion was diagnosed on transthoracic echocardiography or computed tomography. Coronary ostial involvement was assessed on direct visualization by a cardiac surgeon at the time of surgery.
Continuous variables are presented as mean ± SD or median (interquartile range), and comparisons between groups were performed using 1-way analyses of variance or Mann-Whitney U or Kruskal-Wallis tests, as appropriate. Categorical data are expressed as percentages and were compared using chi-square tests or Fisher’s exact tests, as appropriate. Differences were considered statistically significant at p <0.05. A multivariate logistic regression analysis was used to identify clinical predictors available on admission of in-hospital mortality among the variables associated (p <0.10) with this outcome on univariate analysis. Odds ratios and 95% confidence intervals were calculated. Data were analyzed using SPSS version 20.0 (SPSS, Inc., Chicago, Illinois).
Results
The clinical characteristics of the subjects are listed in Table 1 . The prevalence of ECG patterns was 30% for normal ECG findings or no significant ST-T changes (n = 70), 19% for ECG confounders (right bundle branch block [n = 17], left bundle branch block [n = 0], or left ventricular hypertrophy [n = 28]), and 51% for ST-T abnormalities (n = 118; 4% for STE [n = 9] and 47% for STD and/or negative T waves [n = 109]).
| Variable | Overall (n = 233) | Normal ECG Findings/No Significant ST-T Changes (n = 70) | ECG Confounders (n = 45) | ST-T Abnormalities | p Value ∗ | ||
|---|---|---|---|---|---|---|---|
| Any ST-T Changes (n = 118) | STE (n = 9) | STD or Negative T Waves (n = 109) | |||||
| Age (yrs) | 64 ± 11 | 63 ± 12 | 67 ± 12 | 63 ± 11 | 61 ± 13 | 63 ± 10 | 0.09 |
| Men | 132 (57%) | 38 (54%) | 29 (64%) | 65 (55%) | 4 (44%) | 61 (56%) | 0.50 |
| History | |||||||
| Hypertension | 149 (64%) | 49 (70%) | 26 (58%) | 74 (63%) | 5 (56%) | 69 (63%) | 0.38 |
| Diabetes mellitus | 11 (5%) | 3 (4%) | 1 (2%) | 7 (6%) | 0 | 7 (6%) | 0.60 |
| Coronary artery disease | 8 (3%) | 4 (6%) | 0 | 4 (3%) | 0 | 4 (4%) | 0.26 |
| Previous stroke | 14 (6%) | 4 (6%) | 3 (7%) | 7 (6%) | 0 | 7 (6%) | 0.98 |
| Marfan syndrome | 4 (2%) | 2 (3%) | 0 | 2 (2%) | 0 | 2 (2%) | 0.52 |
| Time from symptom onset to admission (h) | 2.8 ± 2.1 | 2.9 ± 1.9 | 3.1 ± 2.3 | 2.7 ± 2.2 | 3.7 ± 2.9 | 2.6 ± 2.2 | 0.67 |
| Presenting symptoms | |||||||
| Any pain reported | |||||||
| Abrupt onset | 222 (95%) | 66 (94%) | 43 (96%) | 113 (96%) | 9 (100%) | 104 (95%) | 0.90 |
| Chest pain | 149 (64%) | 43 (61%) | 26 (58%) | 80 (67%) | 8 (89%) | 72 (66%) | 0.43 |
| Back pain | 118 (51%) | 39 (56%) | 25 (56%) | 54 (46%) | 1 (11%) | 53 (49%) | 0.32 |
| Chest and back pain | 68 (29%) | 22 (31%) | 14 (31%) | 32 (27%) | 1 (11%) | 31 (28%) | 0.78 |
| Abdominal pain | 6 (3%) | 1 (1%) | 0 | 5 (4%) | 0 | 5 (5%) | 0.24 |
| Pain at other sites | 37 (16%) | 13 (19%) | 10 (22%) | 14 (12%) | 5 (56%) | 9 (8%) | 0.21 |
| Syncope | 25 (11%) | 5 (7%) | 7 (16%) | 13 (11%) | 0 | 13 (12%) | 0.36 |
| Physical examination findings on admission | |||||||
| Hemodynamics | |||||||
| Systolic blood pressure (mm Hg) | 125 ± 39 | 128 ± 20 | 128 ± 33 | 122 ± 48 | 113 ± 31 | 123 ± 49 | 0.64 |
| Systolic blood pressure ≥180 mm Hg | 26 (11%) | 2 (3%) | 2 (4%) | 22 (19%) | 0 | 22 (20%) | 0.001 |
| Heart rate (beats/min) | 73 ± 19 | 71 ± 14 | 72 ± 19 | 75 ± 21 | 80 ± 18 | 75 ± 21 | 0.31 |
| Shock | 48 (21%) | 2 (3%) | 6 (13%) | 40 (34%) | 2 (22%) | 38 (35%) | <0.001 |
| Blood measurement on admission | |||||||
| Hemoglobin (g/dl) | 13 ± 2 | 13 ± 2 | 13 ± 2 | 13 ± 2 | 12 ± 2 | 13 ± 2 | 0.57 |
| Anemia | 72 (31%) | 16 (23%) | 16 (36%) | 40 (34%) | 3 (33%) | 37 (34%) | 0.22 |
| eGFR (ml/min/1.73 m 2 ) | 59 ± 21 | 67 ± 19 | 56 ± 21 | 56 ± 21 | 53 ± 19 | 57 ± 21 | 0.002 |
| Renal dysfunction (eGFR <60 ml/min/1.73 m 2 ) | 126 (54%) | 26 (37%) | 28 (62%) | 72 (61%) | 5 (56%) | 67 (62%) | 0.003 |
| d-dimer (μg/ml) | 12 (5–44) (n = 108) | 12 (6–34) (n = 36) | 7 (4–12) (n = 15) | 20 (5–52) (n = 57) | 75 (10–178) (n = 4) | 19 (5–48) (n = 53) | 0.18 |
| Positive troponin (≥0.1 ng/ml) | 24/184 (13%) | 2/58 (3%) | 5/34 (15%) | 17/92 (18%) | 4/8 (50%) | 13/84 (15%) | 0.028 |
| Electrocardiographic findings on admission | |||||||
| Sinus rhythm | 222 (95%) | 68 (97%) | 41 (91%) | 113 (96%) | 8 (89%) | 105 (96%) | 0.31 |
| Atrial fibrillation | 10 (4%) | 2 (3%) | 4 (9%) | 4 (3%) | 0 | 4 (4%) | 0.24 |
| Complete atrioventricular block | 1 (1%) | 0 | 0 | 1 (1%) | 1 (11%) | 0 | 0.61 |
| Complications on admission | |||||||
| Pericardial effusion | 79 (34%) | 6 (9%) | 17 (38%) | 56 (48%) | 1 (11%) | 55 (51%) | <0.001 |
| Cardiac tamponade | 43 (19%) | 2 (3%) | 8 (18%) | 33 (28%) | 1 (11%) | 32 (29%) | <0.001 |
| Moderate/severe aortic regurgitation | 46 (20%) | 5 (7%) | 8 (18%) | 33 (28%) | 4 (44%) | 29 (27%) | 0.002 |
| Coronary ostial involvement | 19 (8%) | 1 (1%) | 1 (2%) | 17 (14%) | 9 (100%) | 8 (7%) | 0.002 |
| Concomitant surgical treatment | |||||||
| Coronary artery bypass grafting | 12 (5%) | 1 (1%) | 0 | 11 (9%) | 7 (78%) | 4 (4%) | 0.013 |
| Aortic valve repair/replacement | 13 (6%) | 2 (3%) | 2 (4%) | 9 (8%) | 2 (22%) | 7 (6%) | 0.36 |
| In-hospital mortality | 16 (7%) | 1 (1%) | 2 (4%) | 13 (11%) | 3 (30%) | 10 (9%) | 0.033 |
Stay updated, free articles. Join our Telegram channel

Full access? Get Clinical Tree


