Extracranial Carotid and Vertebral Arteries
Gregory L. Moneta
Erica L. Mitchell
Claudia Rumwell
This chapter provides an overview of extracranial carotid duplex scanning technique and the ultrasound criteria used for grading carotid artery stenosis. The clinical relevance of duplex scanning in the management of symptomatic and asymptomatic carotid artery disease is also discussed. Topics related to intracranial cerebrovascular ultrasound testing are covered in Chapters 9 and 11.
TECHNICAL POINTS
A complete carotid duplex examination, including the vertebral and subclavian arteries, generally requires 15 to 60 minutes to complete. This time is dependent on examiner experience and skill, severity of disease, and patient cooperation. The indication for the examination is recorded along with the appropriate International Classification of Diseases, 9th edition (ICD-9) code. Carotid and subclavian arteries should be auscultated bilaterally to evaluate for bruits. The presence or absence of carotid and radial artery pulses is also recorded, and brachial systolic and diastolic blood pressures are measured bilaterally. The duplex portion of the examination includes the bilateral carotid and vertebral arteries. Flow characteristics in one carotid artery may be influenced significantly by the status of the contralateral carotid artery; therefore, bilateral examinations are indicated in all cases.1
Instrumentation
Any duplex ultrasound system that includes high-resolution B-mode imaging, pulsed Doppler, and spectral waveform analysis is adequate for performing a complete carotid examination. The common carotid artery (CCA) bifurcation is located 2 to 3 cm deep to the skin surface, whereas the most proximal CCA or vertebral artery and the distal internal carotid artery (ICA) may be slightly deeper. Depth is, therefore, not a major issue when selecting a scan head to perform the examination, and transducer frequencies from 5 to 12 MHz are used. High-frequency transducers (7.5 to 12 MHz) provide better B-mode images of the bifurcation region, whereas scan heads with 5-MHz transducer frequencies may be needed for the distal ICA, the origin of the CCA, and the vertebral arteries. Modern scan heads have multiple imaging frequencies and allow the examiner to change frequencies without having to change scan heads.
Pulsed Doppler and B-mode imaging frequencies may be the same or different during the examination. The pulsed Doppler frequency should be between 4.5 and 10 MHz, but most spectral waveform criteria for carotid stenosis were derived using a 5-MHz Doppler frequency, so that frequency should be used whenever possible. If a pulsed Doppler frequency other than 5 MHz is used to generate spectral waveforms for classification of stenosis, some published interpretation criteria may not apply.
Mechanical sector, linear array, or phased array scan head designs can all be utilized. A linear array imaging format is particularly useful for the mid and distal CCA and the bifurcation region, where the vessels are approximately parallel to the skin surface. With a linear array scan head, manipulations with “heel-and-toe maneuvers” may be necessary to obtain perpendicular B-mode imaging angles because the vessel curves away from the transducer. The sector-type imaging formats of a curved array or the smaller footprint phased array may be successfully used in the regions of the distal ICA and for vessels in the supraclavicular region.
Patient Preparation and Positioning
The patient is positioned supine with her or his head resting flat on the bed in a foam donut or with a rolled-up towel under the neck for support. The use of a pillow is discouraged unless the patient has difficulty breathing or cannot lie flat because of preexisting back problems. A pillow may raise the head excessively, which creates less flexibility of movement and shortens the length of the neck, both of which interfere with obtaining the optimal imaging windows. A towel or a tissue is tucked into the patient’s clothing for protection from the ultrasound gel, or a patient gown may be provided.
The technologist is seated at the head of the bed with the scanner to the left, near enough so that the operator may easily reach the most frequently used controls. The technologist should be seated slightly lower than the bed, with the elbow of the scanning arm resting on the bed for support and the last two fingers of the scanning hand resting gently on the patient’s shoulder. This position decreases the stress on the technologist’s back and arm during the examination. A stable scanning position for the arm is essential when trying to make fine adjustments in scan head orientation and obtaining Doppler signals from small vessels. The patient’s chin is slightly hyperextended and turned
toward the contralateral side at about a 45-degree angle from the midline. This head position may be changed as the examination proceeds to access the best imaging windows.
toward the contralateral side at about a 45-degree angle from the midline. This head position may be changed as the examination proceeds to access the best imaging windows.
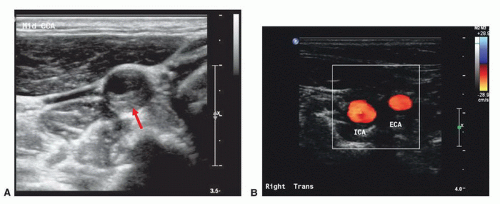 FIGURE 8.1. Transverse or cross-sectional images. A, B-mode image shows an eccentric plaque in the mid common carotid artery (CCA; arrow). B, Color-flow image of the carotid bifurcation shows the internal carotid artery (ICA) is larger in caliber than the external carotid artery (ECA). |
Examination Technique
The carotid duplex examination includes both longitudinal and transverse scans of the vessels. A transverse (or cross-sectional) scan, starting at the most proximal CCA, is helpful to gain orientation when beginning the examination. This view helps the technologist determine the proper position of the scan head relative to the arteries and become familiar with the patient’s anatomy, especially in the area of the bifurcation and the distal ICA where tortuosity is common. Transverse views also often provide the most revealing images of eccentric plaques (Fig. 8.1). Several imaging windows may be necessary to obtain optimal cross-sectional views. The longitudinal view is suboptimal for visualizing plaque. Carotid artery plaque is usually eccentric; therefore, one longitudinal view will show only a portion of the plaque. Rotating the scan head around the long axis of the artery or sliding the scan head side to side with small movements will help to document the complex nature of the plaque. Caliper measurements of the lumen from either longitudinal or transverse views in complex disease are fraught with problems and, in general, should be discouraged as a means of accurately predicting diameter reduction. Velocity waveforms should never be obtained from a transverse view. The Doppler angles in such orientations are either unknown or close to perpendicular to the flow direction, resulting in useless Doppler velocity information. Color Doppler images of vessels in cross section can be deceiving for the same reasons.
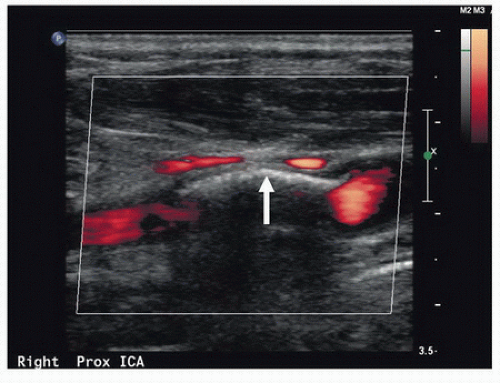 FIGURE 8.2. Calcific plaque in the arterial wall (arrow) precludes penetration of the vessel by ultrasound in this power Doppler image, resulting in acoustic shadowing and a “color void.” In some cases, it may be possible to obtain a Doppler signal by varying the angle of the scan head. Some information on the possible presence of stenosis in the area of a color void can also be obtained by analysis of the Doppler spectral waveforms immediately proximal and distal to the shadowed segment. |
Most of the carotid duplex scan is accomplished using a longitudinal view, which permits the most favorable Doppler angles for recording velocity data and for color Doppler imaging. Using the longitudinal orientation, the pulsed Doppler sample volume is swept continuously throughout the length of the vessels, especially in the area of the bifurcation, searching for areas of increased velocity or flow disturbance. Spot-checking velocity information or sampling sporadically from random locations is poor technique and should be avoided. Neither the B-mode nor the color Doppler image will reliably pinpoint the area of maximal velocity or flow disturbance. Gray-scale and color or power Doppler images alert the examiner to the presence of plaque in the arterial wall that may preclude penetration of the vessel by ultrasound (Fig. 8.2). Color Doppler and B-mode images are helpful primarily for localizing a particular area of interest that needs more specific, in-depth investigation with the pulsed Doppler sample volume (Fig. 8.3).
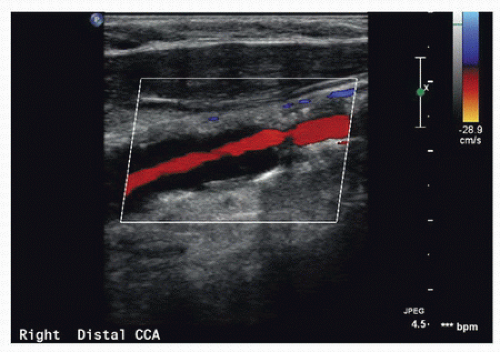 FIGURE 8.3. Color Doppler clearly indicates compromise of the arterial lumen in this common carotid artery (CCA) but is generally not as accurate as spectral waveform analysis in quantifying the degree of stenosis. |
The value of detailed characterization of carotid plaque composition and surface features by gray-scale imaging in routine clinical practice is controversial. It is common for interpreting physicians to comment on the ultrasound characteristics and surface features of a significant carotid plaque. Retrospective analyses suggest that plaques that are predominantly echolucent or irregular are more likely to be associated with neurologic symptoms than predominately echo-dense or smooth plaques.2,3,4,5 However, thus far, this research is largely qualitative, and although advances in imaging technology can now provide very detailed gray-scale images (Figs. 8.4 and 8.5), there are still no definite therapeutic recommendations that can be made based on ultrasound plaque characteristics alone.
Ultrasound beam angles for optimal B-mode images are different from those required for obtaining Doppler spectral waveforms. Maximal ultrasound reflection occurs when the ultrasound beam is perpendicular to the surface being imaged. The optimal B-mode imaging angle is therefore 90 degrees to the surface of the artery. The angle that produces the highest Doppler frequency shift is 0 degrees or parallel to the direction of flow. However, it is difficult to achieve Doppler angles parallel to flow in the cervical cerebrovascular vessels, and angles up to 60 degrees between the vessel axis and the Doppler beam are acceptable. Angles greater than 60 degrees introduce errors into measuring Doppler frequency shifts that may be clinically significant and should be avoided. Therefore, the same view used to obtain an optimal Doppler signal may not yield the highest resolution B-mode image. The physical principles of vascular imaging with ultrasound are discussed in detail in Chapter 7. Most ultrasound instruments have fixed B-mode imaging elements with a steerable Doppler beam, and the operator manipulates the scan head to individually optimize the angles for each modality. Some ultrasound instruments allow the operator to electronically steer the B-mode image and Doppler beam independently, allowing optimization of both modalities simultaneously. Every effort should be made to create the optimal angles for B-mode imaging and Doppler spectral waveform analysis.
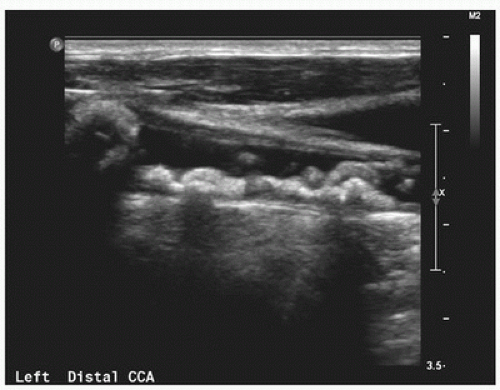 FIGURE 8.4. This gray-scale image demonstrates bulky plaque with irregular surface characteristics in the distal common carotid artery (CCA). |
CAROTID FLOW PATTERNS
Normal Common and Internal Carotid Arteries
Doppler spectral waveforms are obtained from the CCA, ICA, the origin of the external carotid artery (ECA), and the proximal vertebral artery. As previously mentioned, a continuous or “point-to-point” sampling technique should be used to examine the CCA and ICA. Spectral waveforms are also obtained from any site of suspected abnormality suggested by
gray-scale or color Doppler images. Evaluation of the subclavian arteries, as discussed in Chapter 14, is performed as a routine component of the carotid duplex scan in many laboratories but can also be done selectively.
gray-scale or color Doppler images. Evaluation of the subclavian arteries, as discussed in Chapter 14, is performed as a routine component of the carotid duplex scan in many laboratories but can also be done selectively.
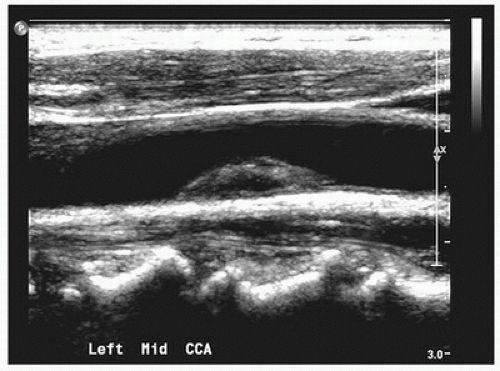 FIGURE 8.5. This gray-scale image shows a heterogeneous plaque in the mid common carotid artery (CCA) with an echolucent center and generally smooth surface. |
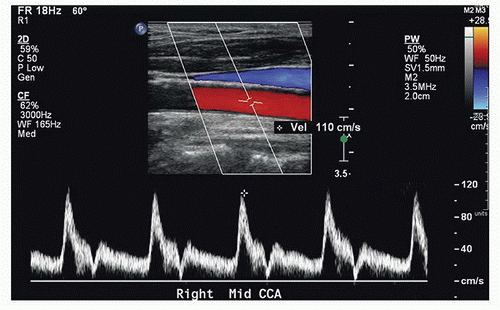 FIGURE 8.6. Normal common carotid artery (CCA) color Doppler image and spectral waveform, with a rapid systolic upstroke and forward flow throughout diastole. There is also a clear “window” under the systolic peak, indicating laminar or non-disturbed flow. The relatively high diastolic flow velocity represents the low resistance of the internal carotid circulation, whereas the transient low-velocity “valley” (near the baseline) in late systole is a feature of the normal external carotid flow pattern. Peak systolic velocity is 110 cm/s. |
 FIGURE 8.7. Normal mid internal carotid artery (ICA) color Doppler image and spectral waveform, with a rapid systolic upstroke, continued forward flow throughout diastole, and relatively high diastolic velocities. As in the normal CCA (see Fig. 8.6), there is a clear “window” under the systolic peak, indicating laminar flow. This is a typical low-resistance arterial flow pattern. Peak systolic velocity (PSV) is 72 cm/s, with end-diastolic velocity (EDV) of 26 cm/s. |
In normal individuals, 70% to 80% of the CCA flow volume enters the low-resistance ICA, and therefore, flow in the CCA typically shows a low-resistance pattern with a rapid systolic upstroke and forward flow throughout diastole (Fig. 8.6). When evaluating the CCA, a spectral waveform should be obtained from the most proximal CCA segment accessible to the scan head. For calculating velocity ratios between the ICA and the CCA (ICA/CCA ratio), the CCA peak systolic velocity (PSV) should be measured in the mid-neck approximately 3 cm proximal to the bifurcation where the vessel is straight and free of significant occlusive disease. Comparison of CCA waveforms from the two sides of the neck should reveal similar PSV and end-diastolic flow velocities.
Spectral waveforms are recorded routinely from the proximal, mid, and distal cervical ICA segments. The normal ICA flow pattern is characteristic of a low-resistance artery, with a rapid systolic upstroke, continued forward flow throughout diastole, and relatively high diastolic velocities (Fig. 8.7). The normal proximal ICA often includes a dilation or “bulb” of variable size that tapers gradually toward the mid and distal segments (Fig. 8.8). The
unidirectional flow pattern described previously is normally found in the carotid bulb along the flow divider of the bifurcation. However, there is transient reversal of flow at peak systole near the center stream and at the outer wall opposite the flow divider. This area of reversed flow is often seen in color Doppler images (Fig. 8.9). As discussed in Chapter 5, this complex flow pattern is referred to as an area of boundary layer separation or flow separation. Flow velocities along the outer wall in the separation zone may drop to zero at the end of diastole (Fig. 8.10). These normal flow patterns are used in conjunction with the absence of visible plaque on the B-mode image to identify a normal carotid bulb. Flow patterns in the carotid bulb may extend to the mid-ICA and can be apparent in waveforms obtained at that level. The distal ICA includes the segment at least 3 cm above the carotid bifurcation. Atherosclerosis usually develops within 2 cm of the bifurcation and rarely is limited to the distal ICA. However, there are a few conditions, such
as fibromuscular dysplasia, in which velocity increases are localized to the distal ICA without the presence of proximal ICA plaque (Fig. 8.11).6
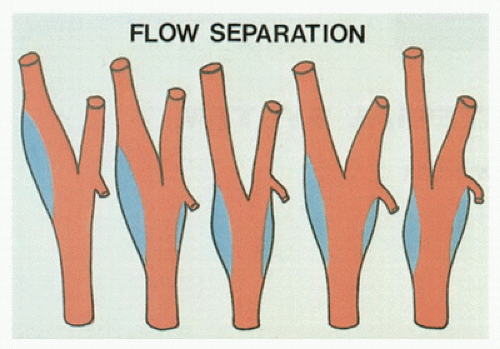 FIGURE 8.8. Illustration of variations in the location and extent of the carotid bulb. The most common configurations are the two at the left of the figure. The blue areas represent regions of flow separation (see text). |
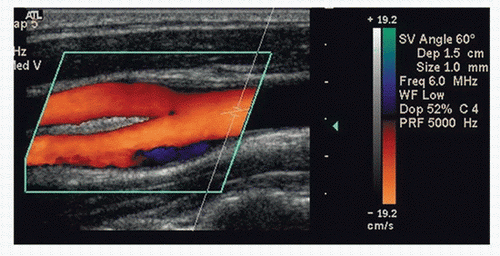 FIGURE 8.9. Color Doppler image of a normal CCA bifurcation. The area of flow reversal (dark blue) along the outer wall of the bulb is a normal finding and indicates an absence of plaque. This is referred to as an area of flow separation (see text). |
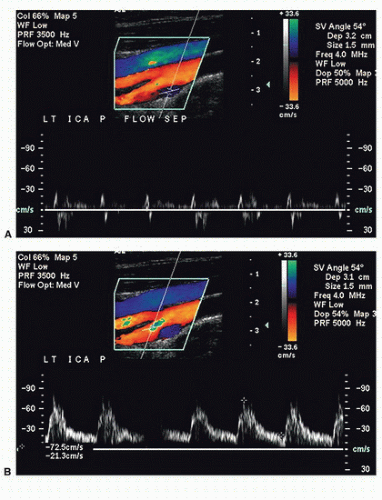 FIGURE 8.10. A, Color Doppler image and spectral waveform of a normal carotid bulb with the sample volume placed near the outer wall in the region of flow separation. The spectral waveform shows relatively low velocities with periods of forward and reverse flow during the cardiac cycle. B, The sample volume has been moved to a location near the inner wall or flow divider where there are higher velocities and a unidirectional flow pattern, typical of a normal internal carotid artery (ICA) (see Fig. 8.7). |
Flow Patterns with Carotid Stenosis
Detecting carotid stenosis with Doppler spectral waveforms focuses on three areas: the prestenotic region, the site of stenosis, and the poststenotic region. Although the most important Doppler findings are observed by sampling at the stenotic site, the pre- and poststenotic regions also provide valuable diagnostic information (Fig. 8.12). Complete characterization of carotid stenosis involves a combination of Doppler spectral waveform analysis, color Doppler, gray-scale (B-mode) imaging, and, in selected cases, power Doppler. However, spectral analysis is the predominant modality for quantification of carotid stenosis. In most cases, color Doppler imaging is not the primary means for assessing the severity of an ICA stenosis. An exception is in distinguishing ICA occlusion from a high-grade stenosis, in which color or power Doppler may identify very low velocity flow in the area of the stenosis that cannot be detected by conventional pulsed Doppler.
The pulsed Doppler spectral waveforms and color Doppler findings should be cross-checked for concordance. If there is disagreement between the impressions obtained with the color and the pulsed Doppler examinations (i.e., color Doppler suggests high-grade stenosis but velocities are only moderately elevated), the findings of both should be reviewed to resolve the discrepancy.
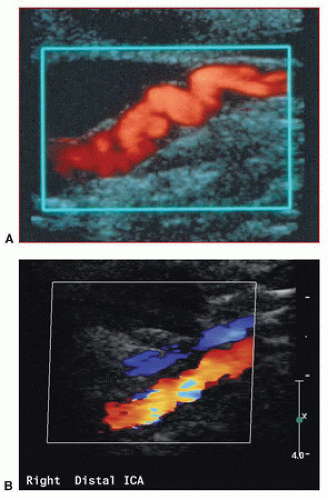 FIGURE 8.11. A, Power Doppler image of the distal cervical ICA in a patient with fibromuscular dysplasia. B, Color Doppler image of the distal cervical internal carotid artery (ICA) in another patient with fibromuscular dysplasia. In both images, there is localized irregularity of the arterial wall, resulting in focal areas of velocity increase. |
Common Carotid Artery
In the majority of cases, carotid stenosis or occlusion occurs in the proximal ICA. Consequently, the CCA exhibits flow patterns typical of a prestenotic region. In the presence of a very high-grade ICA stenosis or occlusion, outflow is primarily through the high-resistance ECA circulation. In this situation, the CCA spectral waveform takes on the high-resistance flow characteristics of the ECA (Fig. 8.13), with flow velocity going to zero (or close to zero) at end-diastole.7 In addition, the PSV and the overall flow velocity may be substantially lower than normal owing to reduced flow volume in the CCA. By observing these changes in the CCA flow pattern, one can often predict the presence of high-grade stenosis or occlusion of the ICA. For this and other reasons, it is good practice to begin the interpretation of carotid ultrasound studies by comparing the CCA Doppler spectral waveforms side to side.
The CCA contralateral to a high-grade ICA stenosis or occlusion may demonstrate an increased flow velocity with particular elevation of the end-diastolic velocity (EDV). These changes represent a compensatory increase in blood flow as the nonobstructed ICA provides collateral flow to the contralateral cerebral hemisphere through the circle of Willis (see Chapter 9). This compensatory increase in flow can be substantial, and flow velocities related to a stenosis may be artificially elevated on the side with high-volume flow.1
In the presence of a significant stenosis at the origin of the CCA or innominate artery, the ipsilateral CCA waveform may be dampened, with low overall PSV and a slower rise to peak systole when compared with the contralateral CCA waveform (Fig. 8.14). In such cases, the cervical CCA represents the poststenotic region, rather than the prestenotic region as occurs with ICA stenosis. It is very important to recognize the CCA flow pattern caused by a proximal stenosis, because it is often the only indication of clinically significant carotid occlusive disease that may be treatable. The CCA waveform changes associated with proximal stenosis are also important diagnostically because the overall reduction in flow velocity may artificially lower velocities in an ipsilateral ICA stenosis, leading to underestimation of the severity of that lesion. In some cases of proximal CCA or innominate artery stenosis, the ipsilateral CCA waveform may exhibit poststenotic turbulence low in the neck, representing disturbed flow distal to the more proximal stenosis.
Stay updated, free articles. Join our Telegram channel

Full access? Get Clinical Tree


