Chapter 15 Exercise


Oxygen Consumption during Exercise
There is a close relationship between the external power that is produced and the oxygen consumption of the subject (Figure 15.1). The oxygen consumption at rest (the basal metabolic rate) is of the order of 200–250 ml.min−1. As work is done, the oxygen consumption increases by approximately 12 ml.min−1 per watt. Exercise intensity is commonly described in terms of metabolic equivalents (METs), which refer to the number of multiples of the normal resting oxygen consumption. For example, walking briskly on the level requires an oxygen consumption of about 1 l.min−1 or 4 METs, whilst running at 12 km per hour (7.5 miles per hour) requires about 3 l.min−1 of oxygen and is rated as 12 METs of activity. Further examples are shown in Figure 15.1.
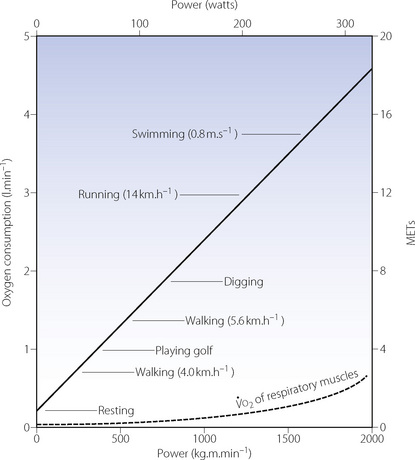
Fig. 15.1 Steady state oxygen consumption with varying degrees of exercise. The continuous straight line denotes whole body oxygen consumption as a function of the level of power developed. The broken curve is an estimate of the oxygen cost of breathing for the increasing hyperventilation of exercise.1 MET, metabolic equivalent, which is the number of multiples of basal oxygen consumption required for different activities.
Time Course of the Increase in Oxygen Consumption1
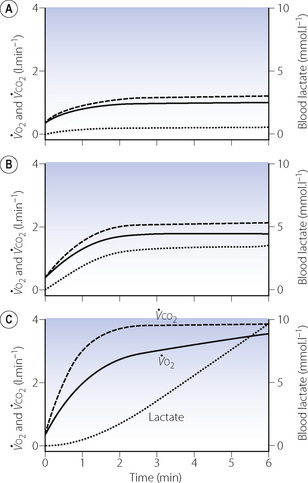
Oxygen consumption rises rapidly at the onset of a period of exercise, with an accompanying increase in carbon dioxide production and a small increase in blood lactate. With moderate exercise (Figure 15.2A) a plateau is quickly reached and the lactate level remains well below the normal maximum resting level (<3.5 mmol.l−1). With heavy exercise  ,
,  and lactate all increase more quickly, again reaching constant levels within a few minutes, the magnitude of which relates to the power generated and the fitness of the subject (Figure 15.2B). If the level of exercise exceeds approximately 60% of the subject’s maximal exercise ability (see below), there is usually a secondary ‘slow component’ to the increase in oxygen consumption, associated with a continuing increase in blood lactate level, which ultimately prevents the exercise from continuing (Figure 15.2C). There have been many explanations proposed for this slow component of
  , including increased temperature, the oxygen cost of breathing, lactic acidosis1 and changes in muscle metabolism secondary to the use of differing fibre types with prolonged exercise.2 The physiological mechanism underlying the linkage between oxygen requirement and its delivery during exercise, and the time course of this response, remain incompletely explained.3
 , solid line), CO2 production (
 , dashed line) and blood lactate (dotted line) with the onset of varying levels of exercise. (A) Light to moderate exercise with little or no increase in lactate; (B) heavy exercise with an increase in lactate to an increased, but steady, level; (C) severe exercise, above the anaerobic threshold when levels continue to rise as exercise proceeds. Note that with severe exercise (C), the increase in oxygen consumption is biphasic with a second ‘slow’ component.
Maximal Oxygen Uptake
Maximal oxygen uptake ( ) refers to the oxygen consumption of a subject when exercising as hard as possible for that subject. A fit and healthy young adult of 70 kg should be able to maintain a
  of about 3 l.min−1, but this decreases with age to about 2 l.min−1 at the age of 70. A sedentary existence without exercise can reduce
  to 50% of the expected value. Conversely,
  can be increased by regular exercise, and athletes commonly achieve values of 5 l.min−1. The highest levels (over 6 l.min−1) are attained in rowers, who utilise a greater muscle mass than other athletes. For example elite oarsmen may attain, for a brief period, a mean oxygen consumption of 6.6 l.min−1 on the treadmill.4 This requires a minute volume of 200 l.min−1 (tidal volume 3.29 litres at a frequency of 62 breaths per minute).
 is commonly used in exercise physiology as a measure of cardiorespiratory fitness. Subjects undertake a period of graduated exercise while
  is measured continuously by a spirometric method (page 211). In all but severe exercise, within a few minutes
  reaches a plateau (Figure 15.2), which is the subject’s
  . At higher levels of exercise, as seen in athletes, defining when maximal oxygen uptake is reached may be difficult because of the slow component of oxygen consumption. Many varying definitions of
  have therefore been used over the years,5 none of which are universally accepted. Elite athletes rarely reach a satisfactory plateau in
  , and secondary criteria such as high plasma lactate levels or a raised respiratory exchange ratio need to be used to define
  .5
.5
At  in trained athletes, approximately 80% of the oxygen consumed is used by locomotor muscles. With the high minute volumes seen during exercise, the oxygen consumption of respiratory muscles also becomes significant, being around 5% of total
  with moderate exercise and 10% at
  (Figure 15.1).6,7
Response of the Oxygen Delivery System
Oxygen delivery. This is the product of cardiac output and arterial oxygen content (page 202). The latter cannot be significantly increased, so an increase in cardiac output is essential. However, the cardiac output does not, and indeed could not, increase in proportion to the oxygen consumption. For example, an oxygen consumption of 4 l.min−1 is a 16-fold increase compared with the resting state. A typical cardiac output at this level of exercise would be only 25 l.min−1 (Figure 15.3), which is only five times the resting value. Therefore, there must also be increased extraction of oxygen from the blood. Figure 15.3 shows that the largest relative increase in cardiac output occurs at mild levels of exercise. At an oxygen consumption of 1 l.min−1 cardiac output is already close to 50% of its maximal value.
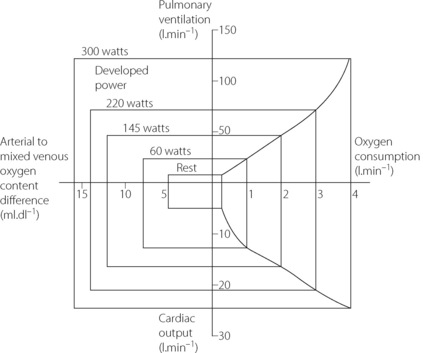
Oxygen extraction. In the resting state, blood returns to the right heart with haemoglobin 70% saturated. This provides a substantial reserve of available oxygen and the arterial/mixed venous oxygen content difference increases progressively as oxygen consumption is increased, particularly in heavy exercise when the mixed venous saturation may be as low as 20% (Figure 15.3). This decrease in mixed venous saturation covers the steep part of the oxygen dissociation curve (Figure 11.9) and therefore the decrease in Po2
Stay updated, free articles. Join our Telegram channel

Full access? Get Clinical Tree


