Cardiac magnetic resonance imaging is an attractive noninvasive metric and has genuine potential to constitute a reliable surrogate end point in ST-elevation myocardial infarction. However, these measures must be demonstrated as a valid proxy to predict clinical outcome. In conclusion, the current review evaluates the utility of cardiac magnetic resonance as a surrogate measurement of myocardial infarct size, left ventricular function, microvascular obstruction, and myocardial salvage in ST-elevation myocardial infarction exploring the temporal relations specific to each assessment.
In the current era of modern evidence-based therapy, morbidity and mortality have decreased in ST-elevation myocardial infarction (STEMI). This has placed new demands on clinical investigative studies evaluating novel therapies. Although mega trials with composite clinical outcomes and extended clinical follow-up have become standard for defining the role of future therapies, the feasibility and costs of this approach threaten their sustainability. Hence, there is an intense interest in the role of surrogate end points as an alternate approach. Cardiac magnetic resonance (CMR) imaging is an attractive noninvasive metric and has genuine potential to constitute a reliable surrogate end point in STEMI. However, these measures must be demonstrated as a valid proxy to predict clinical outcome.
A Useful Surrogate End Point
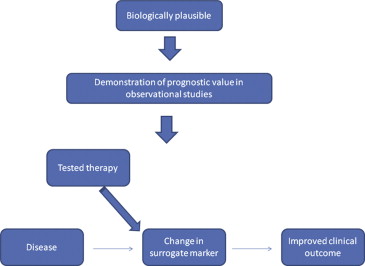
A surrogate end point, defined as a substitute laboratory or physiological measurement for a clinically relevant outcome, facilitates efficient conduct of trials with smaller sample sizes and potentially shorter duration. However, to be a useful and valid proxy, a surrogate marker should be biologically plausible, readily available, precisely measureable, reproducible, and well aligned with the predicted clinical outcome. As highlighted in Figure 1 , an association between a surrogate biomarker and clinical outcome is not enough; a change in the surrogate measure as a result of the intervention should reflect a commensurate change in clinical outcome. Ideally, the surrogate tracks a biologic pathway that when modified aligns with clinical outcome. Selected examples of therapies in cardiovascular research that used surrogate end points that have ultimately proved predictive of clinical outcomes (and some that have failed) are outlined in Table 1 .
| Intervention | CV condition | Surrogate endpoint | Clinical outcome |
|---|---|---|---|
| Successful | |||
| ACE inhibitors | Primary prevention | Improved blood pressure | Reduced MACE |
| Statins | Primary prevention | Improved cholesterol | Reduced MACE |
| N-BNP | Heart failure | Reduction in N-BNP | Reduced MACE |
| Unsuccessful | |||
| Milrinone | Heart Failure | Improved hemodynamic function | Increased mortality |
| Encainide and flecainide | MI | Arrhythmia suppression | Increased mortality |
| Torcetrapib | Primary prevention | Improved plasma lipoprotein levels | Increased MACE |
CMR Imaging in STEMI
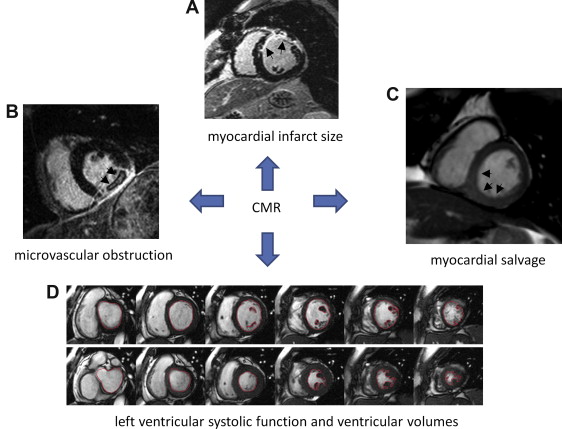
Historically, there have been a variety of proxy measurements in STEMI that have been well aligned with survival ( Table 2 ). However, each of these surrogate markers reflects a single measurement within the spectrum of myocardial infarction and is acquired at different time intervals relative to the index event. As seen in Figure 2 , CMR captures all these various metrics within a single test. Limitations of CMR are mainly because of the need to exclude patients with mechanical medical devices such as a pacemaker or defibrillator and certain mechanical artificial heart valves. With the requirement for gadolinium contrast, moderate-to-severe renal impairment is also a contraindication (glomerular filtration rate ≤30 ml/min) because of the small risk (2% to 3%) of inducing nephrogenic systemic fibrosis.
| Surrogate measurement | Clinical Outcome |
|---|---|
| Left ventricular systolic function | Survival |
| Left ventricular end-systolic volume | Survival |
| Cardiac enzyme estimates of infarct size | Survival |
| ST-segment resolution as an estimate of microvascular function | Survival |
CMR Imaging in STEMI
Historically, there have been a variety of proxy measurements in STEMI that have been well aligned with survival ( Table 2 ). However, each of these surrogate markers reflects a single measurement within the spectrum of myocardial infarction and is acquired at different time intervals relative to the index event. As seen in Figure 2 , CMR captures all these various metrics within a single test. Limitations of CMR are mainly because of the need to exclude patients with mechanical medical devices such as a pacemaker or defibrillator and certain mechanical artificial heart valves. With the requirement for gadolinium contrast, moderate-to-severe renal impairment is also a contraindication (glomerular filtration rate ≤30 ml/min) because of the small risk (2% to 3%) of inducing nephrogenic systemic fibrosis.
| Surrogate measurement | Clinical Outcome |
|---|---|
| Left ventricular systolic function | Survival |
| Left ventricular end-systolic volume | Survival |
| Cardiac enzyme estimates of infarct size | Survival |
| ST-segment resolution as an estimate of microvascular function | Survival |
CMR Measurement of Myocardial Infarct Size
Quantification of myocardial infarct size is obtained using inversion recovery imaging typically performed 10 to 15 minutes after an intravenous injection of 0.1 to 0.2 mmol/kg gadolinium chelate. Correlation between infarct size measured by late gadolinium enhancement CMR and areas of myocardial necrosis seen on histopathology have been demonstrated in the acute setting (first week) (R = 0.99, p <0.001) and chronic phase (8 weeks) (R = 0.97, p <0.001) of myocardial infarction.
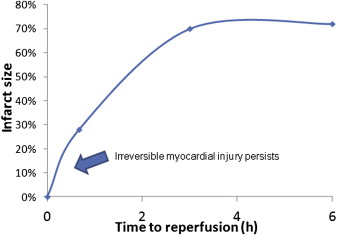
However, the timing of CMR image acquisition in relation to the myocardial infarct is paramount. As described by Reimer and Jennings, the “wave front phenomenon” of myocardial ischemic cell death is a continued transmural progression of myonecrosis in a confined ischemic territory at risk from myocardial infarction. Defined by the corresponding territory of coronary occlusion, the final infarct size depends on the duration of ischemic time experienced in the absence of coronary blood flow. As such, a temporal relation exists between the ischemic time to reperfusion and infarct size during the course of myocardial infarction ( Figure 3 ). Moreover, in the first 3 to 7 days after myocardial infarction, infarct size volume is greatest with marked tissue edema. Subsequently, tissue fibrosis and scar formation occur resulting in contraction of the infarct zone 6 to 12 weeks after myocardial infarction. Clinical studies have reported an overestimation of infarct size in the acute setting that significantly diminishes in the chronic phase of infarction ( Table 3 ). Although CMR measurements obtained in the chronic phase (i.e., 3 months) of STEMI may result in a more stable result, survival bias and recurrent events may confound measurements taken remotely from the index event of interest.
| Clinical study | Number of patients | Acute CMR (post PCI) (days) | Chronic CMR (months) | Decrease in infarct size |
|---|---|---|---|---|
| Ingkanisorn et al (2004) | N=20 | 1.7±0.8 | 2 | 16 ±12% to 11±9% (p < 0.003) |
| Hombach et al (2005) | N=89 | 6.1 ± 2.2 | 6-9 | 11.4±7.2% to 7.8±5.3% (p<0.001) |
| Baks et al (2006) | N=22 | 5 | 5 | 26±14% to 20±11% (p<0.001) |
| Larose et al (2010) | N=103 | <1 | 6 | 22(19-25)% to 16(14-19)% (p<0.01) |
| Patel et al (2010) | N=83 | 3-5 | 3 | 13.7(5.6, 19.1)% to 8.8(4.1, 15.8)% |
The association between infarct size and adverse clinical outcomes has been documented in several observational studies. Recently, Larose et al performed CMR in 103 patients with STEMI who underwent primary percutaneous coronary intervention (PCI). Imaging was obtained within 12 hours after STEMI, and patients were followed for clinical events at 2 years. Late gadolinium enhancement infarct size of ≥23% was highly predictive of adverse clinical events (hazard ratio 10.1; 95% confidence interval [CI] 3.7 to 27.3; p <0.001).
However, contemporary clinical trials of novel therapies have been unable to establish a relation between reduced CMR infarct size and improved clinical outcome. Using CMR infarct size imaging as the primary surrogate end point, Thiele et al tested the utility of intracoronary versus intravenous abciximab in a phase 2 randomized controlled trial of 144 patients with STEMI. Intracoronary abciximab was associated with a reduction in infarct size (15.1% [6.1% to 25.2%] vs 23.4% [13.6% to 33.2%]; p = 0.01).
Based on these findings, the investigators designed a large phase 3 randomized study of 2,065 patients Abciximab Intracoronary versus intravenously Drug Application in STEMI (AIDA STEMI) trial to assess clinical benefit. Surprisingly, no benefit was demonstrated with intracoronary abciximab in reducing death, reinfarction, or congestive heart failure at 90 days (7.0% vs 7.6%; odds ratio [OR] 0.91; 95% CI 0.64 to 1.28; p = 0.58). Of note, an AIDA STEMI CMR substudy showed no difference in infarct size. This apparent disconnect could relate to variability in the timing of image acquisition in the phase 2 study as CMR infarct size was measured acutely anywhere from day 1 to day 4 after reperfusion.
As seen in Table 3 , our review of these modestly sized studies indicate that the timing of image acquisition has been variable when assessing infarct size after reperfusion. Given the dynamic evolution of infarct size modulated by ischemic time, ascertainment in the acute phase and differences across patients and trials, measurements could be jeopardized resulting in variability if standardization of the time interval between infarction and CMR acquisition is not addressed. Hence, it is imperative to provide defined guidelines for timing of image acquisition. Our current recommendation is to perform CMR imaging 5 to 7 days after STEMI in patients with an ischemic time ≤6 hours as this seemingly provides the optimal and stable environment for CMR utilization of infarct size given tissue edema. A recent example from the Effect of METOprolol in CARDioproteCtioN During an Acute Myocardial InfarCtion (METOCARD-CNIC) trial performed CMR at days 5 to 7 in patients with an ischemic time ≤6 hours and found a reduction in infarct size with intravenous metoprolol administered at the time of STEMI. For those whom it is available, subsequent evaluation in the chronic setting should be performed at 3 months.
CMR Measurement of Left Ventricular Systolic Function and Ventricular Volume
As seen in Table 4 , various noninvasive techniques have been used to assess left ventricular function. Two-dimensional echocardiography has become the default imaging technique, yet the precision of these measurements is limited because of geometric assumptions regarding the shape of the left ventricular cavity. In STEMI, wall motion abnormalities and aneurysm formation can alter the ventricular shape and geometry. As well, instrument variability can occur because of improper positioning of the ultrasound probe with 2-dimentional images creating artifact. Three-dimensional echocardiography has improved accuracy and reproducibility but is still limited by poor acoustic windows. Radionucleotide ventriculography and gated single-photon emission computed tomography (SPECT) are more reproducible (with low inter- and intra-observer variability), yet these imaging techniques expose patients to radiation with lower spatial resolution.
| Non-invasive methods for LV assessment | Accurate and Reproducible for LV function | Does not rely on geometric assumptions of LV | Global LV function | Regional LV function | Valvular function | LV wall thickness | Image extreme body weight | No ionizing radiation |
|---|---|---|---|---|---|---|---|---|
| RVG | + | + | + | + | + | |||
| 2-D ECHO | + | + | + | + | + | |||
| 3-D ECHO | + | + | + | + | + | + | + | |
| Gated SPECT | + | + | + | + | + | |||
| Gated PET | + | + | + | + | + | |||
| CT | + | + | + | + | + | |||
| CMR | + | + | + | + | + | + | +/- | + |
Stay updated, free articles. Join our Telegram channel

Full access? Get Clinical Tree


