Amplitude
First author of study
Year of study publication
Limb lead voltage
(R I–S I) + (S III–R III)
>16 mm
Lewis
1914
R I + S III
>25 mm
Gubner
1943
R I
>15 mm
Gubner
1943
R aVL
>11 mm
Sokolow
1949
R aVF
>20 mm
Goldberger
1949
Q or S aVR
>19 mm
Schack
1950
R + S in any limb lead
>19 mm
Romhilt
1968
Precordial lead voltage
S V1
>23 mm
Wilson
1944
S V2
>25 mm
Mazzoleni
1964
S V1 + R V5
>35 mm
Sokolow
1949
S V2 + R V5,6
>45 mm
Romhilt
1969
S V1,2 + R V5,6
>35 mm
Murphy
1984
S V1,2 + R V6
>40 mm
Grant
1957
R + S any precordial lead
>35 mm
Grant
1957
R V5: R V6
>1.0
Holt
1962
R, any precordial lead
>26 mm
McPhie
1958
S V2 + R V4,5
>45 mm
Wolff
1956
R V5
>33 mm
Wilson
1944
R V6
>25 mm
Wilson
1944
Combinations of limb and precordial voltage
RS aVF + V2 + V6 (>30 years)
>59 mm
Manning
1964
RS aVF + V2 + V6 (<30 years)
>93 mm
Manning
1964
S V3 + R aVL (men)
>28 mm
Casale
1985
S V3 + R aVL (women)
>20 mm
Casale
1985
Total 12-lead voltage
>175 mm
Siegel
1982
Combinations of voltage and non-voltage
Voltage-STT-LAA-axis-QRS duration
Point score
Romhilt
1968
(R aVL + S V3) × QRS duration
>2,436 mm/s
Molloy
1992
Total 12-lead voltage × QRS duration
>1,742 mm/s
Molloy
1992
Criteria for use with left anterior fascicular block
S V1 + R V5 + S V5
>25
Bozzi
1976
S V1,2 + R V6 + S V6
>25
Bozzi
1976
S III + max R/S any lead (men)
>30
Gertsch
1988
S III + max R/S any lead (women)
>28
Gertsch
1988
Criteria for use with right bundle-branch block
Max R/S precordial lead (with LAD)
>29 mm
Vandenberg
1991
S V1
>2 mm
Vandenberg
1991
R V5,6
>15 mm
Vandenberg
1991
S III + max R/S precordial (with LAD)
>40 mm
Vandenberg
1991
R I
>11 mm
Vandenberg
1991

Fig. 1.1
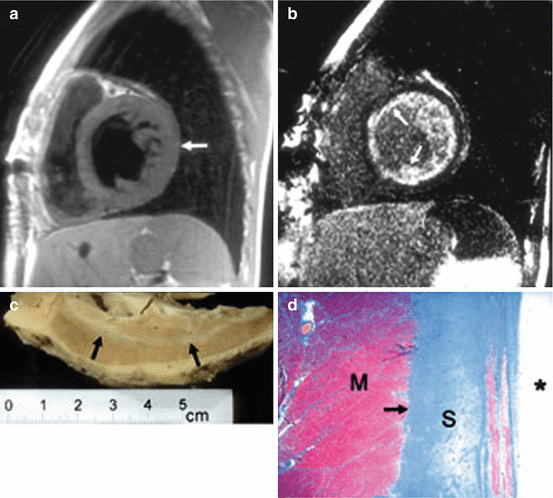
(a) Short-axis T1-weighted image of the mid-left ventricle demonstrating left ventricular hypertrophy with normal myocardial signal (arrow). (b) Corresponding midventricular MRI image with delayed gadolinium enhancement shows extensive subendocardial enhancement consistent with diffuse fibrosis (arrows). (c) Gross examination of the explanted left ventricle fixed in formalin shows extensive subendocardial fibrosis. Note the sharp demarcation from normal tan-colored myocardium (arrows). (d) Masson’s trichrome stain confirms extensive subendocardial fibrosis (S), stained blue with this stain (arrow) and sharply demarcated from normal myocardium (M), staining red (original magnification, ×40). Asterisk denotes endocardial surface (Reproduced with permission from Salvia et al. [23])
1.4 1.4 Electrocardiographic ST/T Abnormalities
Electrocardiographic repolarization abnormalities are often observed in conjunction with electrocardiographic LV hypertrophy. It has been documented that adding electrocardiographic repolarization patterns to electrocardiographic voltage and QRS duration may improve the diagnostic accuracy for detection of anatomic LV hypertrophy [13]. Specifically, the additional presence of LV repolarization abnormalities is believed to be a marker of severe concentric LV hypertrophy [25, 26]. In turn, this may partly explain why the electrocardiographic “strain” pattern of lateral ST depression and T-wave inversion has emerged as an independent risk attribute even when adjusting for the presence of electrocardiographic voltage criteria for LV hypertrophy [27–29]. In the losartan intervention for endpoint reduction (LIFE) study, new development of electrocardiographic strain was a strong predictor of adverse outcome in the setting of electrocardiographic LV hypertrophy regression [30].In conclusion, electrocardiographic strain patterns refine cardiovascular risk prediction and may improve detection of anatomic LV hypertrophy when combined with electrocardiographic LV hypertrophy. The mechanisms underlying regression and development of electrocardiographic strain, at baseline and during antihypertensive therapy, require further study to fully unveil its prognostic potential.
1.5 1.5 QRS Duration
Longer QRS duration is an independent predictor of increased sudden cardiac death in patients with hypertension [31]. Moreover, longitudinal changes in QRS duration during follow-up in hypertensive patients are closely related to risk of incident heart failure [32]. It is less evident if QRS duration should be considered a separate risk marker as compared to electrocardiographic voltage in itself. This is further complicated by the fact that some electrocardiographic criteria for LV hypertrophy include QRS duration in their calculation, whereas others rely entirely on electrocardiographic voltage. Clearly, electrocardiographic voltage and QRS duration will be differently affected by confounding factors such as obesity and age-related calcification of conduction tissue [33]. From a pathophysiological standpoint, there may also be important differences between QRS duration and voltage, as only viable cardiomyocytes can produce electrocardiographic voltage. Conversely, longer QRS duration is in itself associated with cardiac fibrosis and LV dilatation, both of which are regarded as hallmarks of end-stage LV failure [34]. Thus, while greater QRS voltage mirrors hypertrophy of viable cardiomyocytes, longer QRS duration may reflect greater cellular hypertrophy or delayed cardiac activation due to regional or more widespread cardiac fibrosis, which may (reactive interstitial fibrosis) or may not be reversible (replacement fibrosis) [35]. Worsening fibrosis in the setting of increasing LV hypertrophy may in part explain why electrocardiographic voltage is not linearly related to cardiac mass and suggests that the current clinical standard of dichotomizing electrocardiographic criteria for LV hypertrophy may in itself lead to poor diagnostic performance of the electrocardiogram [5]. In conclusion, QRS duration is an independent predictor of heart failure and sudden cardiac death in hypertensive patients. QRS duration and QRS voltage may reflect different stages or components of cardiac maladaptations to increased LV afterload. Further studies are needed to elucidate the differential implications of longer QRS duration as compared increased QRS voltage.
Stay updated, free articles. Join our Telegram channel

Full access? Get Clinical Tree


