There are sparse data on the etiologies and predictors of readmission after transcatheter aortic valve implantation (TAVI). The study cohort was derived from the National Readmission Data 2013, a subset of the Healthcare Cost and Utilization Project sponsored by the Agency for Healthcare Research and Quality. TAVI was identified using appropriate International Classification of Diseases, Ninth Revision, Clinical Modification codes. The coprimary outcomes were 30-day readmissions and in-hospital mortality during primary admission and readmission. Hierarchical 2-level logistic models were used to evaluate study outcomes. Our analysis included 5,702 (weighted n = 12,703) TAVI procedures. About 1,215 patients were readmitted (weighted n = 2,757) within 30 days during the study year. Significant predictors of readmission included transapical access (OR, 95% CI, p value) (1.23, 1.10 to 1.38, <0.01), diabetes (1.18, 1.06 to 1.32, p 0.004), chronic lung disease (1.32, 1.18 to 1.47, <0.01), renal failure (1.43, 1.24 to 1.65, <0.01), patients discharged to facilities (1.28, 1.14 to 1.43, <0.01), and those who had lengthier hospital stays during primary admission (length of stay >10 days: 3.06, 2.22 to 4.22, <0.01). Female gender (1.39, 1.16 to 1.68, <0.01), blood transfusion (1.88, 1.55 to 2.29, <0.01), use of vasopressors (3.63, 2.50 to 5.28, <0.01), hemodynamic support (6.39, 5.20 to 7.85, <0.01) and percutaneous coronary intervention (1.89, 1.30 to 2.74, 0.01) during primary admission were significant predictors of in-hospital mortality. Age and transapical access were significant predictors of in-hospital mortality during readmission. In conclusion, heart failure, pneumonia, and bleeding complications are among important etiologies of readmission in patients after TAVI. Patients who underwent transapical TAVI and those with slower in-hospital recovery and co-morbidities such as chronic lung disease and renal failure are more likely to be readmitted to the hospital.
Transcatheter aortic valve implantation (TAVI) has resulted in a paradigm shift in the treatment of severe aortic valve stenosis. Promising data from multiple trials resulted in approval of TAVI for severe symptomatic aortic stenosis in inoperable or high surgical risk patients. This has resulted in widespread adoption of TAVI across the nation. There are limited data available on short-term readmissions in patients undergoing TAVI especially in the real-world standard practice. Unplanned readmissions over a 30-day period after index hospitalization are known to occur in up to 20% of Medicare beneficiaries accruing significant health care costs along with poor patient outcomes and quality of life. TAVI is usually performed in high-risk patients with a significant burden of co-morbidities making readmissions even more likely in this cohort. The primary objective of our study was to evaluate specific etiologies and predictors of 30-day readmission and mortality in patients undergoing TAVI from the largest publicly available nationwide database.
Methods
The study cohort was derived from the National Readmission Database (NRD) of 2013, a subset of the Healthcare Cost and Utilization Project sponsored by the Agency for Healthcare Research and Quality. The NRD is one of the largest publicly available all-payer inpatient care database in the United States, including data on approximately 14 million discharges in year 2013, estimating roughly 36 million discharges from 21 states with reliable, verified linkage numbers. NRD represents 49.1% of total US hospitalizations. Patients were tracked using variable “NRD_visitlink” and time between 2 admissions was calculated by subtracting variable “NRD_DaysToEvent.” Time to readmission was calculated by subtracting length of stay (LOS) of primary admissions to time between 2 admissions. National estimates are produced using sampling weights provided by the sponsor. The details regarding the NRD data are available online.
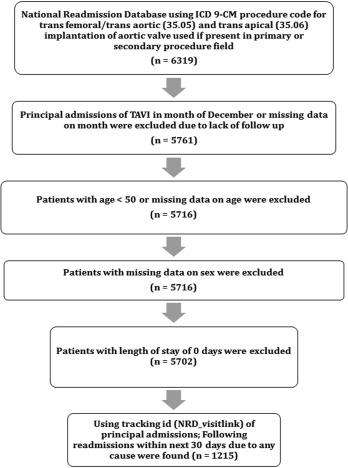
The International Classification of Diseases, Ninth Revision, Clinical Modification (ICD-9-CM) Volume 3 procedure code subcategory 35.0 was expanded effective October 1, 2011, and new codes were added to report TAVI. We queried the NRD database using the ICD-9-CM procedure code of 35.05 for transfemoral/direct aortic and 35.06 for transapical replacement of aortic valve if present in the primary or secondary procedure field. We identified 5,702 procedures after excluding patients with age <50 years, with missing data for age or gender. We also excluded procedures done in the month of December, as we did not have follow-up data for the same, data points with LOS of 0 days were excluded (n = 5,702; Figure 1 ). Patients who were readmitted to the hospital within 30 days within the same calendar year were further evaluated (n = 1,215).
The coprimary study outcomes were 30-day readmissions and in-hospital mortality during primary admission and readmission. Preventable procedural complications were identified by Patient Safety Indicators (PSIs). These indicators are based on ICD-9-CM codes and Medicare severity Diagnosis-Related Groups, and each PSI has specific inclusion and exclusion criteria. PSI individual measure technical specifications, version 4.4, March 2012, was used to identify and define preventable complications. Other procedure-related complications, not part of PSI, were identified using ICD-9-CM codes ( Supplementary Table 1 ) in any secondary diagnosis field. Vascular complications were defined as PSI code for accidental puncture or ICD-9-CM codes for injury to blood vessels, creation of arteriovenous fistula, injury to retroperitoneum, vascular complications requiring surgery, and other vascular complications not elsewhere classified. “Any complications” were defined as occurrence of one or more postprocedure complications listed in Supplementary Table 1 . Similar method has been used before. NRD variables were used to identify patients’ demographic characteristics including age and gender. We defined severity of co-morbid conditions using Deyo modification of Charlson Co-morbidity Index (CCI) ( Supplementary Table 2 ). Annual hospital TAVI volume was determined using the unique hospital identification number to calculate the total number of procedures performed by a particular institution in the study year. Hospital volume was divided into 4 equal quartiles with the following cutoffs: first (<32 TAVIs/year), second (32 to 55 TAVIs/year), third (56 to 93 TAVIs/year), and fourth quartile (>93 TAVIs/year). Of note, these volume cutoffs are applicable to only NRD.
Stata IC 11.0 (StataCorp, College Station, Texas) and SAS 9.4 (SAS Institute Inc, Cary, North Carolina) were used for analyses. Differences between categorical variables were tested using the chi-square test, and differences between continuous variables were tested using the Student t test. Hierarchical 2-level logistic models with hospital ID as random effect were used to evaluate predictors of readmission and in-hospital mortality. In multivariate models for readmission, we included hospital-level variables such as hospital procedure volume; patient-level variables such as age, gender, Deyo modification of CCI, principal admission type (elective vs non elective), and primary payer (private [private including Health Maintenance Organization] vs non private); co-morbidities such as diabetes, heart failure, peripheral vascular disease, chronic lung disease, and renal failure; procedural complications such as transfusion, use of vasopressor, use of hemodynamic support, permanent pacemaker placement, and all other complications; co-procedure like percutaneous coronary intervention (PCI); disposition during principal admission; LOS (<3 as reference, 3 to 6, 7 to 10, >10); and access site (transfemoral/direct aortic vs transapical). Multivariate model for readmission was run only on patients who survived principal admission. In multivariate model of short-term mortality, we did not include disposition during principal admission in model as outcome was mutually exclusive and we also excluded “any complications” from model due to high collinearity with variation inflation factor >20.
Results
Our analysis included 5,702 (weighted n = 12,703) TAVI procedures performed in the United States during the study period. These included 3,999 (weighted n = 8,729) transfemoral/direct aortic and 1,703 (weighted n = 3,974) transapical TAVIs. About 68.73% of the subjects were aged ≥80 years, and 49.6% of the subjects were women ( Table 1 ). A large proportion of the patients (48.27%) had a significant baseline burden of co-morbidities with a CCI score of ≥3. Hypertension (79.35%) was the most common co-morbidity. Most of the procedures were elective (76.69%), performed at large (84.51%) on weekdays (94.64%) and the primary insurance payer was Medicare/Medicaid (92.6%). Overall in-hospital mortality and complication rates during primary admission were 4.67% % and 52.55%, respectively. Table 2 provides a detailed list of individual procedural complication rates during the primary admission.
| Variables | Trans femoral/Direct aortic | Trans apical | Overall | P-value |
|---|---|---|---|---|
| Primary TAVI procedure admission (unweighted) | 3999(70.13%) | 1703(29.87 %) | 5702 | |
| Primary TAVI procedure admission (weighted) | 8729(68.72%) | 3974(21.28 %) | 12703 | |
| Age(Years) | <0.001 | |||
| 50-64 | 3.43 % | 4.51 % | 3.76 % | |
| 65-79 | 26.19 % | 30.39 % | 27.5 % | |
| ≥80 | 70.39 % | 65.1 % | 68.73 % | |
| Gender | <0.001 | |||
| Men | 52.54 % | 45.7 % | 50.4 % | |
| Women | 47.46 % | 54.3 % | 49.6 % | |
| Charlson/Deyo Score | 0.01 | |||
| ≤1 | 30.21 % | 28.96 % | 29.82 % | |
| 2 | 22.44 % | 20.74 % | 21.91 % | |
| ≥3 | 47.35 % | 50.3 % | 48.27 % | |
| Obesity ∗ | 14.31 % | 15.66 % | 14.74 % | 0.05 |
| Hypertension (History) | 79.13 % | 79.82 % | 79.35 % | 0.37 |
| Diabetes Mellitus | 33.95 % | 33.56 % | 33.83 % | 0.66 |
| Chronic pulmonary disease | 32.22 % | 39.59 % | 34.52 % | <0.001 |
| Peripheral vascular disease | 28.38 % | 37.45 % | 31.22 % | <0.001 |
| Renal failure | 35.05 % | 37.7 % | 35.88 % | 0.01 |
| Neurological disorder or paralysis | 8.11 % | 8.06 % | 8.1% | 0.92 |
| Anemia or coagulopathy | 26.34 % | 24.37 % | 25.73 % | 0.02 |
| Hematological or oncological malignancy | 3.64 % | 3.64 % | 3.64 % | 0.99 |
| Weight loss | 5.41 % | 9.36 % | 6.65 % | <0.001 |
| Rheumatoid arthritis or other collagen vascular | 4.34 % | 4.73 % | 4.46 % | 0.33 |
| Depression, psychosis or substance abuse | 8.72 % | 10.48 % | 3.39 % | 0.002 |
| Admission type | 0.11 | |||
| Non elective admission | 23.68 % | 22.4 % | 23.28 % | |
| Elective admission | 76.28 % | 77.6 % | 76.69 % | |
| Median household income category for patient’s zip code (percentile) † | <0.001 | |||
| 1. 0-25th | 20.11 % | 21.17 % | 20.44 % | |
| 2. 26-50th | 23.08 % | 27.59 % | 24.49 % | |
| 3. 51-75th | 25.66 % | 27.25 % | 26.16 % | |
| 4. 76-100th | 30.04 % | 23.08 % | 27.87 % | |
| Primary Payer | 0.96 | |||
| Medicare / Medicaid | 92.5 % | 92.56 % | 92.52 % | |
| Private including HMO ‡ | 5.27 % | 5.35 % | 5.3 % | |
| Self pay/no charge/other | 2.02 % | 2.09 % | 2.05 % | |
| Hospital bed size | <0.001 | |||
| Small | 2.51 % | 4.02 % | 2.98 % | |
| Medium | 12.29 % | 13.01 % | 12.51 % | |
| Large | 85.21 % | 82.97 % | 84.51 % | |
| Admission day | 0.14 | |||
| Weekdays | 94.84 % | 94.2 % | 94.64 % | |
| Weekend | 5.16 % | 5.8 % | 5.36 % | |
| Co-PCI § | 3.43 % | 2.97 % | 3.28 % | 0.18 |
| Disposition | <0.001 | |||
| Home | 68.69 % | 52.12 % | 63.51 % | |
| Facility/others | 27.24 % | 41.74 % | 31.78 % | |
| Hemodynamic support | 7.3 % | 19.73 % | 11.19 % | <0.001 |
| IABP ¶ | 1.58 % | 4.39 % | 2.46 % | <0.001 |
| PVAD ‖ | 0.14 % | 0.21 % | 0.16 % | 0.38 |
| ECMO ∗∗ | 0.93 % | 1.13 % | 0.99 % | 0.31 |
| CBP †† | 5.28 % | 15.78 % | 8.56 % | <0.001 |
| Permanent pacemaker placement ‡‡ | 7.51 % | 6.87 % | 7.31 % | 0.20 |
| Transfusion §§ | 25.34 % | 35.86 % | 28.63 % | <0.001 |
| Cardiac Arrest ¶¶ | 3.09 % | 5.33 % | 3.79 % | <0.001 |
| Ventricular fibrillation ‖‖ | 1.17 % | 1.91 % | 1.4 % | 0.001 |
| Cardiogenic shock ∗∗∗ | 3.55 % | 6.21 % | 4.38 % | <0.001 |
| Use of Vasopressor ††† | 2.84 % | 5.53 % | 3.68 % | <0.001 |
Stay updated, free articles. Join our Telegram channel

Full access? Get Clinical Tree


