Estimates and projections of diagnosed incidence and prevalence of atrial fibrillation (AF) in the United States have been highly inconsistent across published studies. Although it is generally acknowledged that AF incidence and prevalence are increasing due to growing numbers of older people in the U.S. population, estimates of the rate of expected growth have varied widely. Reasons for these variations include differences in study design, covered time period, birth cohort, and temporal effects, as well as improvements in AF diagnosis due to increased use of diagnostic tools and health care awareness. The objective of this study was to estimate and project the incidence and prevalence of diagnosed AF in the United States out to 2030. A large health insurance claims database for the years 2001 to 2008, representing a geographically diverse 5% of the U.S. population, was used in this study. The trend and growth rate in AF incidence and prevalence was projected by a dynamic age-period cohort simulation progression model that included all diagnosed AF cases in future prevalence projections regardless of follow-up treatment, as well as those cases expected to be chronic in nature. Results from the model showed that AF incidence will double, from 1.2 million cases in 2010 to 2.6 million cases in 2030. Given this increase in incidence, AF prevalence is projected to increase from 5.2 million in 2010 to 12.1 million cases in 2030. The effect of uncertainty in model parameters was explored in deterministic and probabilistic sensitivity analyses. Variability in future trends in AF incidence and recurrence rates has the greatest impact on the projected estimates of chronic AF prevalence. It can be concluded that both incidence and prevalence of AF are likely to rise from 2010 to 2030, but there exists a wide range of uncertainty around the magnitude of future trends.
In earlier studies, atrial fibrillation (AF) was estimated to have affected anywhere from 3 to 6 million Americans in 2010. Although such estimates vary, this number is projected to triple in the United States by 2050, with similar increases expected in Europe.
To provide more current and generalizable estimates of AF incidence and prevalence, we analyzed a large U.S. health insurance claims database over the period of 2001 to 2008. The objective of this study was to project the incidence and prevalence of diagnosed AF in the United States out to 2030 using a dynamic age-cohort period progression model.
Methods
We developed a retrospective study using the medical, pharmacy, and enrollment information in the I3/Innovus health insurance claims database from January 1, 2001, through June 30, 2008. This database included more than 14 million individuals who were enrolled in large, commercial, or Medicare Advantage health plans and represented a geographically diverse 5% of the U.S. population.
Annual incidence is defined as the rate of acquiring a new AF diagnosis in the health claims data within a 1-year time period. To qualify as an incident case, an AF diagnosis must have occurred between January 1, 2002, and June 30, 2007 (index date being the first date of diagnosis within this observation period) and met the following inclusion criteria: (1) an AF diagnosis ( International Classification of Diseases, Ninth Revision, Clinical Modification [ICD-9-CM] code 427.31) on ≥2 outpatient visits on different dates, and/or (2) an AF diagnosis (ICD-9-CM code 427.31) on 1 outpatient visit, with the presence of electrocardiogram testing on the same date or within 30 days before the visit, and/or (3) an AF diagnosis for an emergency department visit or hospitalization. In addition, all subjects must have been ≥20 years of age at the index date, have no diagnosis of AF during the preindex baseline period of 2 years, have been enrolled a minimum of 1 year after the index date for follow-up, and had not filled a prescription for warfarin during the preindex baseline period unless the subject had a diagnosis of atrial flutter (ICD-9-CM of 427.32) during that time. Subjects were also excluded if they had cardiac surgery during the 30 days before the index AF diagnosis or the presence of hyperthyroidism, rheumatic heart disease, or alcohol/substance abuse diagnoses in the 12 months before the index AF diagnosis ( Supplementary Table 1 , online).
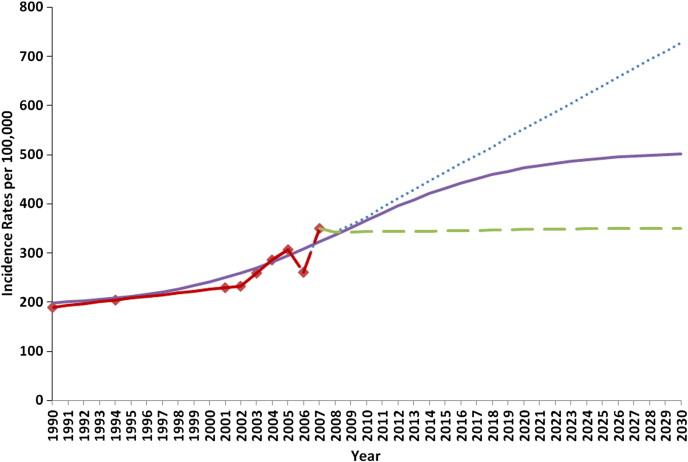
The annual incidence of new-onset AF cases and annual mortality rates due to AF were estimated by a longitudinal method used by Miyasaka et al. Age-specific incidence rates from Miyasaka study (using 2 data points from 1990s) and the I3/Innovus administrative health claims data (7 data points from 2001 to 2007) were then used to fit 3 models, each projecting a different scenario for the incidence trend over time past 2007. First, a flat incidence rate was used that assumed no increase in growth for incidence rates after 2007; second, a logarithmic curve was fit to the incidence data for the observed time period and projected an increasing trend in incidence which eventually hits an asymptote by 2030; and third, a linear trend was used that simply extended the increasing growth rate evident from observed data points ( Figure 1 ). The first 2 scenarios of incidence trends were used in the natural history progression model to estimate corresponding AF prevalence. For both models, age-specific AF incidence rates from 1990 were used to populate a pool of prevalent AF cases to substantiate the model before the observation period. AF-related (stroke) mortality and other-cause mortality rates by age and gender were held constant over time in the model.
The age-specific annual incidence rates from 1950 to 2030 were input into the natural history progression model to estimate and project AF prevalence out to 2030, accounting for the projected demographic changes in the age and gender structure of the U.S. population based on U.S. Census 2000 projections. A diagram describing the progression of cases in the natural history model (NHM) is provided in Supplementary Figure 1 (online). The NHM approach identifies age-specific cohorts of individuals and cycles them through stages of AF progression until death through a state transition matrix over time. The NHM uses a modified Markov model to simulate the number of new incidence AF cases and continuing prevalent AF cases expected each year, which are summed and projected out to 2030. Not all newly detected cases recur; based on a 3-year longitudinal analysis of newly detected AF cases and their recurrence, a proportion of each year’s incident cases do not enter the pool of chronic prevalent AF cases the following year. Adding the results for all cycles for a given year yields the prevalence AF for that year.
A series of deterministic sensitivity analyses were conducted to assess the impact of variation in assumptions on overall prevalence estimates in our model. Parameters that were varied in these analyses included population growth rates, AF incidence rates, AF recurrence rates, and mortality rates. The magnitude of change on input parameters was based on a range of estimates for these parameters reported in other studies. In addition, a probabilistic sensitivity analysis was conducted on the base case scenario to simulate a range of uncertainty around the 2030 prevalence. A Monte Carlo simulation was performed using @RISK Professional Edition, version 6, from Palisade Corporation, Ithaca, New York. Probabilities were generated to provide a range of uncertainty around impact of simultaneous changes of model parameter assumption ranges on projected prevalence estimates.
Results
In 2007, 8,749 incident AF cases met our diagnostic criteria for newly diagnosed AF cases in this health insurance claims database. The age- and gender-adjusted AF incidence rate, standardized to the general U.S. population, grew from approximately 220 per 100,000 in 2002 to about 350 per 100,000 in 2007 ( Figure 1 ), corresponding to a 9.2% annual growth rate. Accordingly, when these incidence rates are applied to the 2000 U.S. census population estimates, approximately 660,000 incident cases of AF would have been expected to be newly diagnosed in the United States in 2002, increasing to 1.07 million newly diagnosed cases in 2007. If there was no increase in AF incidence rates after 2007, then approximately 1.13 million newly diagnosed cases of AF would be estimated for 2010, which would increase to 1.8 million for 2030. The increase in newly diagnosed cases would be due to the increasing numbers of elderly individuals in the U.S. population. For the scenario that fits a logarithmic growth rate for incidence after 2007, the number of newly diagnosed AF cases was estimated to be 1.2 million in 2010 and projected to be 2.6 million in 2030, corresponding to a growth rate of 4.6%.
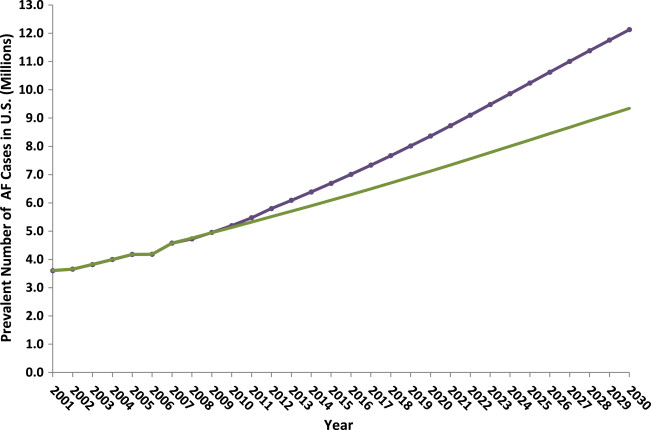
The low case in our deterministic sensitivity analysis assumes no additional growth in AF incidence rate after 2007. Using this assumption in our model, the prevalence of AF in 2010 was estimated at 5.1 million and projected to be 9.3 million in 2030, corresponding to an annual increase of 3.6%. In the base case model with a projected logarithmic incidence growth rate, the annual prevalence of AF in the U.S. population was estimated at 5.2 million in 2010 and projected to increase to 12.1 million by 2030, corresponding to a growth rate of 4.3% ( Figure 2 ).
Stay updated, free articles. Join our Telegram channel

Full access? Get Clinical Tree


