This study sought to elucidate the relation between epicardial adipose tissue (EAT) thickness measured by multidetector computed tomography and presence of coronary artery atherosclerosis. Recent studies have suggested that fat disposition in visceral organs and epicardial tissue could serve as a predictor of coronary artery disease (CAD). The sample included 190 asymptomatic subjects with ≥1 cardiovascular risk factor who were referred for cardiac computed tomographic angiography. Body mass index, blood pressure, fasting glucose level, and lipid profile were measured. Multidetector computed tomographic results were analyzed for atherosclerosis burden, calcium Agatston score, and EAT thickness: mean EAT values were 3.54 ± 1.59 mm in patients with atherosclerosis and 1.85 ± 1.28 mm in patients without atherosclerosis (p <0.001). On receiver operating characteristic analysis, an EAT value ≥2.4 mm predicted the presence of significant (>50% diameter) coronary artery stenosis. There was a significant difference in EAT values between patients with and without metabolic syndrome (2.58 ± 1.63 vs 2.04 ± 1.46 mm, p <0.05) and between patients with a calcium score >400 and <400 (3.38 ± 1.58 vs 2.02 ± 1.42 mm, p <0.0001). In conclusion, asymptomatic patients with CAD have significantly more EAT than patients without CAD. An EAT thickness of 2.4 mm is the optimal cutoff for prediction of presence of significant CAD.
The aim of the present study was to investigate the association of epicardial adipose tissue (EAT) measured by multidetector computed tomography (MDCT) to severity of coronary artery atherosclerosis in asymptomatic subjects. We also sought to establish reliable methods for quantifying EAT.
Methods
A retrospective single-center study design was used. The study sample consisted of 190 consecutive subjects referred by their primary physician or self-referred for cardiac computed tomographic angiography from November 2007 through January 2009. All patients were asymptomatic before examination. Exclusion criteria were allergy to contrast medium, irregular heart rate, and impaired renal function (creatinine level >1.2 mg). Patients signed an informed consent form on enrollment to the study, after receiving a full explanation of the procedure. All imaging studies were conducted at the Mor Institute, a diagnostic hospital-affiliated facility. The study was approved by our institute ethics committee.
Before cardiac computed tomographic angiography, a detailed medical investigation was performed by an internist, and clinical and laboratory data were recorded. Arterial hypertension was defined as current use of antihypertensive medications or known but untreated blood pressure >140/90 mm Hg. Dyslipidemia was defined as currently receiving cholesterol-lowering medications or known but untreated total cholesterol level. Diabetes was defined as currently receiving insulin or oral hypoglycemic agents. A positive family history of premature coronary artery disease (CAD) was defined as the occurrence of CAD in a first- or second-degree relative before 55 years of age. Metabolic syndrome was defined according to the National Cholesterol Education Program Adult Treatment Panel III: increased triglycerides ≥150 mg/dl, decreased high-density lipoprotein <40 mg/dl (men) and <50 mg/dl (women), increased blood pressure >130/85 mm Hg or use of medication for hypertension, increased fasting glucose >100 mg/dl, and body mass index (BMI) >30 kg/m 2 .
Oral β blockers (metoprolol 50 mg or propranolol 20 mg) were administered 3 hours before the test to patients who were not already taking them to maintain heart rates at <70 beats/min and thus improve image resolution. To facilitate adequate breath-hold, patients were connected to an oxygen mask and asked to hyperventilate. Cardiac computed tomographic angiogram was obtained with a 64-slice Brilliance computed tomographic scanner (Philips, Cleveland, Ohio) with dedicated cardiac reconstruction software and electrocardiographic triggering. Patients were scanned in the supine position 2 times; the first time was without contrast medium to calculate the calcium score. Nonionic contrast agent (Ultraviat 370, Schering Ag, Berlin, Germany) 85 to 100 ml was injected into the antecubital vein at a rate of 4 to 5 ml/s followed by a saline flush using a dual-head automatic injector (Stellant, Medrad, Pennsylvania). Scan volume was determined from the tracheal bifurcation to the diaphragmatic surface of the heart. Scan parameters were 140 kV, 400 mA, 0.4-second rotation speed, 64- × 0.625-mm detector array, and 1-mm single-slice collimation with 50% overlap. Pitch, which was dependent on heart rate, averaged 0.3. Images were reconstructed in different phases of the cardiac cycle using a retrospective electrocardiogram-gated algorithm with 1-mm-thick sections and 0.4-mm intervals.
All images were transferred to a workstation with dedicated cardiac reconstruction software (Extended Brilliance Workspace 4.2, Philips Medical System, Best, the Netherlands) and reviewed in a blinded manner by 2 experienced computed tomographic radiologists by consensus. The initial retrospective electrocardiogram-gated reconstruction was generated with a reconstruction window starting at the end-diastolic phase (i.e., 75% of peak R interval). When data were insufficient because of motion artifacts, additional reconstruction data were obtained in increments and decrements of 10%. All segments ≥2 mm in diameter belonging to the left main, left anterior descending, left circumflex, and right coronary arteries were included according to the modified classification of the American College of Cardiology/American Heart Association. Images were evaluated by axial scans, curved multiplanar reformations through the lumen of the coronary vessels, and 3-dimensional volume-rendered visualization.
Noncontrast scans, at a slice thickness of 3 mm and intervals of 1.5 mm, were performed during a single breath-hold. The calcium score was determined using the method of Agatston et al using dedicated software (Extended Brilliance Workspace 4.2).
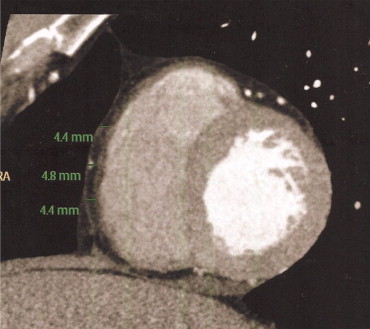
Epicardial fat was defined as the adipose tissue between the surface of the heart and the visceral epicardium surrounding the 3 main coronary arteries. To determine EAT values, epicardial fat thickness was measured on the right ventricular anterior free wall at the base of the ventricles in short-axis view. Three measurements were made: at the 25%, 50%, and 75% levels of the wall, from the visceral epicardium to the outside of the myocardium, and perpendicular to the surface of the heart ( Figure 1 ). The mean of the 3 measurements was used for analysis.
Continuous data are expressed as mean ± SD. Risk factors were compared between patients with and without coronary atherosclerotic disease. Descriptive data are presented as absolute and relative frequencies (percentage). Student’s t test for independent groups was used to compare continuous variables, and chi-square test was used for categorical variables. Pearson bivariate correlation was used to test the strength of associations between EAT and other variables. The relation between multiple cardiovascular risk factors and presence of CAD was assessed with stepwise logistic regression analysis. Risk factors with a significant relation to CAD on univariate analysis were entered into the model. To determine the optimal EAT value that was predictive of the presence of significant (>50% diameter) coronary artery stenosis, the area under the receiver operating characteristic (ROC) curve was calculated for each potential cutoff, and the SE and 95% confidence interval (CI) were calculated. All statistical analyses were performed using SPSS 16.0 for Windows (SPSS, Inc., Chicago, Illinois). A 2-tailed p value <0.05 was considered statistically significant.
Results
The 190 consecutive subjects consisted of 162 men (85.3%) and 38 women 38 to 74 years old (mean ± SD, 56.48 ± 9.2). All patients had ≥1 risk factor for CAD (type 2 diabetes mellitus 48.9%, hypertension 46.8%, and family history of symptomatic coronary artery atherosclerosis 48.9%) in addition to dyslipidemia, smoking history, and peripheral vascular disease.
Sixty patients were found to have significant CAD on cardiac computed tomographic angiogram: 34 (56.5%) with 1-vessel disease, 22 (36.7%) with 2-vessel disease, and 4 (6.7%) with 3-vessel disease. Their findings were compared to the remaining 130 patients without significant CAD. Baseline characteristics of the 2 groups are listed in Table 1 . Results of univariate and multivariate linear regression analyses of the association of risk factors to presence of CAD are presented in Tables 2 and 3 . Mean EAT thickness measured by MDCT for the entire study sample was 2.39 ± 1.59 mm (range 0.1 to 7.5; Figure 2 ). Values were significantly higher in patients with CAD than in patients without CAD (3.54 ± 1.59 vs 1.85 ± 1.28 mm, p <0.001; Figure 3 ). On ROC curve analysis, EAT thickness ≥2.4 mm predicted the presence of significant coronary stenosis, with sensitivity 80%, specificity 73%, positive predictive value 57%, and negative predictive value 88% ( Figure 4 ). The odds ratio (OR) for a patient with an EAT value >2.4 mm having CAD was 10.8 (CI 4.9 to 24.8). This relation remained significant after adjusting for CAD risk factors. Within the group of patients with significant CAD, there was no significant difference in EAT values in those with 1-, 2-, or 3-vessel disease.
| Variable | CAD | p Value | |
|---|---|---|---|
| Yes (n = 60) | No (n = 130) | ||
| Age (years), mean ± SD | 59.05 ± 8.96 | 55.25 ± 9.11 | 0.008 |
| Men | 93.3% | 81.5% | 0.033 |
| Diabetes mellitus | 25.0% | 9.2% | 0.004 |
| Hypertension | 63.3% | 39.2% | 0.002 |
| Dyslipidemia | 70.0% | 56.9% | 0.086 |
| Smoke | 63.3% | 37.7% | 0.001 |
| Body mass index (kg/m 2 ), mean ± SD | 28.59 ± 4.42 | 29.24 ± 4.57 | 0.375 |
| Risk Factors | B | p Value |
|---|---|---|
| Age | −0.31 | 0.26 |
| Diabetes mellitus | −0.67 | 0.32 |
| Hypertension | −0.85 | 0.13 |
| Dyslipidemia | 0.51 | 0.33 |
| Body mass index | −0.11 | 0.044 |
| Calcium score | 0.002 | 0.0013 |
| Epicardial adipose tissue >2.4 mm | 0.62 | 0.0003 |
| Risk factors | OR | 95% CI | p Value |
|---|---|---|---|
| Diabetes mellitus | 3.35 | 1.45–7.72 | 0.03 |
| Hypertension | 2.52 | 1.34–4.75 | 0.04 |
| Dyslipidemia | 1.67 | 0.87–3.21 | 0.12 |
| Epicardial adipose tissue >2.4 mm | 9.48 | 4.53–14.83 | 0.0001 |


