Electrophysiologic Testing, including His Bundle and Other Intracardiac Electrograms
This chapter aims to summarize the components of a comprehensive electrophysiology (EP) study. However, the components of a diagnostic EP study are usually selected based upon the indications for the study. Readers who are primarily aiming for a board certification exam should primarily direct their attention to components listed in the Summary to this chapter and to the Review questions.
INDICATIONS FOR ELECTROPHYSIOLOGIC TESTING
Indications for performance of an EP study have evolved somewhat in recent years with the indications for implantable cardioverter–defibrillators (ICDs) expanding to defined populations without the need for a “positive” EP study. Thus, the use of EP studies for risk stratification of patients at possible high risk for sudden cardiac death has become more limited. Based on recent multicenter trials, ICDs are being indicated for primary prevention of sudden cardiac death in patients with:
 Prior myocardial infarction (MI), at least 40 days before and left ventricular ejection fraction (LVEF) ≤35% with New York Heart Association (NYHA) functional class II or III; or LVEF <30% with NYHA functional class I
 Nonischemic cardiomyopathy, LVEF ≤35%, and NYHA functional class II or III
These patients do not require EP studies to qualify for ICD implantation. However, ICD implantation is also indicated in patients who have LVEF <40%, prior MI, nonsustained ventricular tachycardia (NSVT), and inducible sustained ventricular tachycardia (VT) or ventricular fibrillation (VF) at EP study. Thus, EP studies can be indicated for risk stratification in patients who do not yet have indications for an ICD. These patients include patients with coronary artery disease (CAD), prior MI, LVEF ≤40%, and NSVT. Clinical guidelines regarding the use of EP studies in the risk stratification of patients prior to device implantation may be obtained from the American College of Cardiology/American Heart Association/Heart Rhythm Society (ACC/AHA/HRS) 2008 guidelines for device implantation.1
An EP study is also helpful in the diagnosis of patients presenting with syncope of undetermined etiology and in the diagnosis of wide complex tachycardia. EP studies may also be used to assess for bradyarrhythmias, including sinus node or atrioventricular (AV) conduction system disease, particularly in patients with possible infra-Hisian conduction system disease.
The most common application for EP studies, however, is for the diagnosis and mapping of tachyarrhythmias as part of a catheter mapping and ablation procedure. The diagnosis of supraventricular tachycardia (SVT) type and localization of ablatable supraventricular and ventricular substrates are integral parts of ablation procedures (see ACC/AHA/ESC guidelines for management of patients with supraventricular arrhythmias2).
Clinical competency guidelines are reported in the ACC/AHA clinical competence statement on invasive EP studies, catheter ablation, and cardioversion.3
THE BASICS OF ELECTROPHYSIOLOGY STUDIES
During an EP study, multipolar catheters are positioned, typically in the right ventricular apex (RVA) and/or right ventricular outflow tract, the His bundle, the coronary sinus (CS), and/or the right atrium (RA) (Fig. 26.1). Programmed electrical stimulation (PES) is performed via bipolar electrodes by pacing at various rates and by introduction of premature extrastimuli. Typical baseline recordings include the surface electrocardiograms (ECGs), particularly leads I, AVF, V1, and V6, as well as intracardiac electrograms (EGMs) from the high right atrium (HRA), His bundle (His, or HBE), RVA, and CS. The electrodes are by convention numbered consecutively with the most distal electrode being number 1.
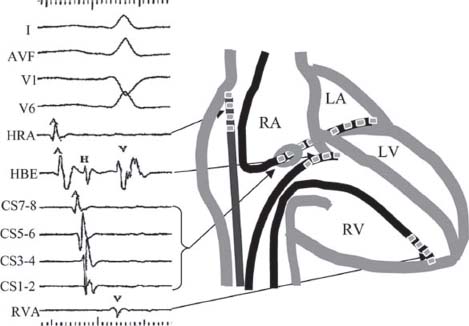
FIGURE 26.1 Typical catheter positions and recordings during EP studies. RA, right atrium; LA, left atrium; LV, left ventricle, RV, right ventricle.
Intracardiac Electrograms
When approaching the interpretation of intracardiac EGMs, it is useful to understand the differences between the surface ECG and intracardiac EGMs. The surface ECG is recorded on the body surface and reflects the electrical activity of the whole heart. The intracardiac EGM is recorded within the heart and is usually filtered differently from surface ECGs to remove high-frequency noise and low-frequency interference (e.g., from respiration). The intracardiac EGM reflects local electrical activity in the heart near the recording electrodes. The display or paper speed is generally faster than the conventional 25 mm/s surface 12-lead ECG speed. Time markers are generally present at the top or bottom of EGM tracings.
When interpreting intracardiac EGMs, the reader should orient himself/herself to the tracings, using the labels, which are usually displayed along the left margin. The atrial and ventricular activity can be identified by correlation with the surface ECG recordings. EGMs reflect local depolarization. EGMs from atrial or ventricular catheters show local atrial or ventricular depolarization, respectively. EGMs recorded at either the mitral or tricuspid annulus show both atrial and ventricular depolarization. Thus, EGMs from the CS show both atrial and ventricular EGMs. In the CS, the atrial EGMs are typically large in amplitude and the ventricular EGMs smaller, unless the catheter is advanced into a ventricular branch. His bundle EGMs are recorded at the tricuspid annulus and will typically display atrial, His, and ventricular EGMs with the size of the atrial or ventricular component dependent on whether the recording electrodes are situated more proximally in the atrium or distally in the ventricle.
Cycle Lengths versus Rates
During an EP study, intervals are more commonly measured than rates. The “cycle length” of pacing drives or rhythms is measured. The conversion between cycle length and rates are as follows: Cycle length (milliseconds) = 60,000 per rate (bpm). Conversely, rate (bpm) = 60,000 per cycle length (milliseconds). Thus, a rate of 60 bpm corresponds to a cycle length of 1,000 milliseconds, 100 bpm corresponds to 600 milliseconds, 120 bpm corresponds to 500 milliseconds, 150 bpm to 400 milliseconds, and 200 bpm to 300 milliseconds.
Baseline Intervals
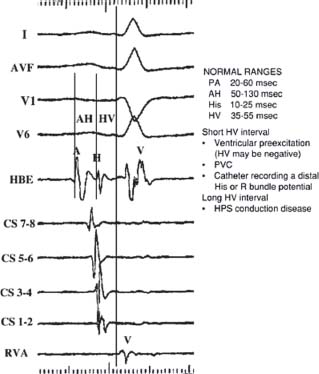
Typical baseline intervals reported in EP studies include the sinus cycle length (SCL), defined as the interval between sinus atrial EGMs (A-A interval or P-P interval), the surface PR, QRS, and QT intervals. The AH and HV intervals are the most commonly measured intervals (Fig. 26.2). The AH interval is measured on the His bundle catheter (HBE) as the time interval from the first major deflection at its baseline crossing to the onset of the His bundle EGM. The AH interval estimates conduction time across the AV node (AVN). The AH interval is highly variable and dependent upon vagal tone, medications, and preceding atrial rates, but typically ranges from 50 to 130 milliseconds. The HV interval is also measured on the HBE. The HV interval is the interval from the onset of the His deflection to the earliest onset of ventricular activation on any surface lead or intracardiac EGM. The normal HV interval ranges from 35 to 55 milliseconds. Other baseline intervals are less commonly measured unless markedly abnormal. These include the PA interval, defined as the earliest onset of surface P wave to the earliest intra-cardiac atrial EGM (normal 20 to 60 milliseconds). The His width from the beginning to end of the His deflection generally ranges from 10 to 25 milliseconds. The RB-V interval measures the interval from the onset of the right bundle potential to the earliest ventricular activation on any surface lead or intracardiac EGM.
Normal Activation Sequences
Anterograde Atrial and Ventricular Activation Sequence. Normal atrial activation during sinus rhythm is from the HRA to low RA and then concentrically from proximally to distally along the CS. Normal ventricular activation is from the RV apex and concentrically from proximal to distal along the CS (Fig. 26.3 left panel).
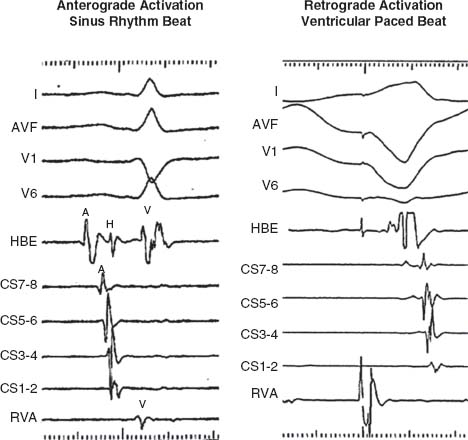
Retrograde Atrial Activation Sequence. The sequence of atrial activation during ventricular pacing is from the septum proximally to distally along the CS and from low RA in the midline to high RA (Fig. 26.3 right panel).
PES. During an EP study, pacing at various cycle lengths (or rates) or various intracardiac sites is performed. The length of this pacing train can be programmed. Common paced cycle lengths (PCLs) are at 600 milliseconds (100 bpm), 500 milliseconds (120 bpm), and 400 milliseconds (150 bpm). The stimuli during the fixed drive train are termed S1. Premature extrastimuli may be introduced in intrinsic rhythm or after a fixed paced drive train (Fig. 26.4). The first extrastimulus is termed S2. The second extrastimulus, when introducing double extrastimuli, is termed S3. The third extrastimulus, when introducing triple extrastimuli, is termed S4, and so on. The common terminology of the paced stimuli, their subsequent intracardiac EGMs and intervals, is summarized below:
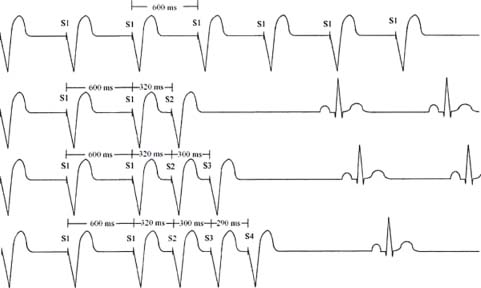
FIGURE 26.4 Programmed ventricular stimulation.
Pacing Drive Trains and Extrastimuli
S1 = drive train pacing stimulus
 Continuous overdrive burst, or
 During programmed extrastimuli, typically eight pacing stimuli at a fixed PCL
PCL = paced cycle length (e.g., PCL 600 milliseconds = S1S1 interval, pacing rate 100 bpm)
S2 = first extrastimulus (S1-S2 = coupling interval between S2 and S1)
S3 = second extrastimulus (S2-S3 = coupling interval between S2 and S3)
S4 = third extrastimulus (S3-S4 = coupling interval between S3 and S4)
A1 = atrial EGM associated with S1 drive or spontaneous atrial rhythm
A2 = atrial EGM associated with S2 or the first spontaneous atrial EGM after A1
A3 = atrial EGM associated with S3 or the second spontaneous atrial EGM after A1
H1 = His bundle EGM associated with S1 drive or spontaneous rhythm
H2 = His bundle EGM associated with S2 or after second spontaneous depolarization
V1 = ventricular EGM associated with S1 drive or spontaneous ventricular rhythm
V2 = ventricular EGM associated with S2 or the first spontaneous ventricular EGM after A1
V3 = ventricular EGM associated with S3 or the second spontaneous ventricular EGM after A
Refractory Periods
The effective refractory period (ERP) is defined as the longest interval after onset of depolarization that fails to propagate. The ERP is usually determined during PES with the delivery of single extrastimuli after paced drive trains. With each successive drive train, the coupling interval is progressively shortened, until the extrastimulus fails to capture the stimulated tissue. This coupling interval identifies the ERP (Fig. 26.5). This interval represents the longest coupling interval that fails to capture the conduction system or myocardium distal to the stimulus (e.g., in the ventricle, S1-S2 interval that produces a V1 but no V2) The relative refractory period (RRP) is the longest S1-S2 interval resulting in conduction delay distal to the stimulus, for example, when the output interval (V1-V2) is longer than the S1-S2 interval (e.g., when “latency” of ventricular activation is observed). The functional refractory period (FRP) is the minimum interval between two consecutively conducted impulses, that is, the shortest output possible (e.g., the shortest V1-V2 interval). A summary and the normal ranges of ERPs are as follows:
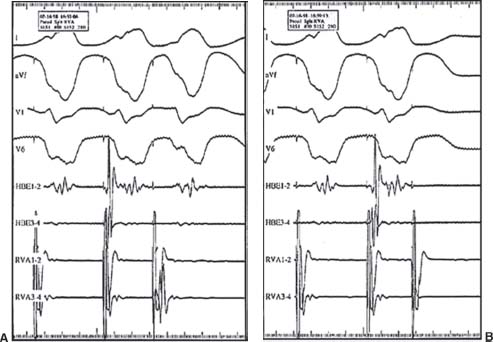
FIGURE 26.5 VERP. A: PCL 400 milliseconds, CI 280 milliseconds. B: PCL 400 milliseconds, CI 260 milliseconds (VERP).
 ERP—longest interval (e.g., S1-S2 interval) that fails to propagate.
S1-S2 = V1—no V2 (input measurement)
 RRP—Longest S1-S2 interval resulting in conduction delay
S1-S2 ≠ V1-V2 (input ≠ output)
 FRP—minimum interval between two consecutively conducted impulses. Shortest V1-V2 (shortest output possible)
Normal Effective Refractory Periods
| Atrial ERP | 170–300 ms |
| AVN ERP | 230–430 ms |
| His ERP | 330–450 ms |
| Ventricular ERP | 170–290 ms |
BRADYARRHYTHMIA EVALUATION BY EPS
EP study to assess bradyarrhythmias is not indicated if symptomatic bradycardia has already been documented or if patients already have a clear indication for a permanent pacemaker. However, EP study may be helpful in patients with sinus node or AV conduction disease and symptoms but for whom noninvasive monitoring has failed to document correlation of the bradyarrhythmia with symptoms; patients in whom symptoms might also be due to another arrhythmia (e.g., atrial, supraventricular, VT); or patients with a permanent pacemaker who continue to have symptoms.
SINUS NODE FUNCTION
The sinus cycle length (SCL) is defined as the A-A interval during sinus rhythm. Assessment of sinus node function may include assessment of the sinus node recovery times (SNRTs) and/or the sinoatrial conduction time (SACT).
SNRT. Atrial overdrive pacing is performed at a rate faster than the sinus rate for approximately 30 seconds, usually at multiple PCLs (e.g., PCL 700, 600, 500, 400 milliseconds). The SNRT is the interval from the last paced atrial EGM to the return sinus atrial EGM (Fig. 26.6). SNRT usually lengthens as PCL shortens until retrograde sinus node entrance block occurs at which point the sinus node is no longer being overdriven as quickly. Then, as PCL shortens further, SNRT typically shortens. Maximal SNRT is the longest SNRT measured after pacing at different PCLs and is reported with the PCL that produces the longest SNRT.
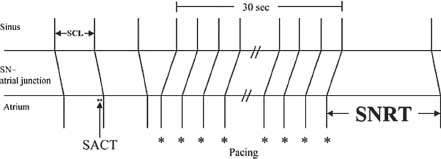
FIGURE 26.6 Determination of SNRT.
Corrected Sinus Node Recovery Time (CSNRT). The CSNRT is the difference between the maximal SNRT and the SCL. Normal CSNRT is <550 milliseconds. The CSNRT corrects for the variation of SNRT with baseline SCL.
Total Sinus Node Recovery Time. After overdrive atrial pacing, the time from the last paced atrial EGM until the SCL returns to prepaced rate represents the total SNRT. Normal is <5 seconds.
Secondary Pauses. The presence of secondary pauses should be noted after testing for SNRT. A secondary pause represents an interval longer than the initial SNRT interval occurring after the initial sinus recovery beat after overdrive atrial pacing.
SACT. The SACT is a measure of conduction time from sinus activation to local atrial activation in the region surrounding the sinus node. SACT can be estimated by pacing and recording close to the sinus node and measuring the time to the first spontaneous atrial beat after a single premature beat or slow overdrive train of atrial pacing. (Normal 50 to 125 milliseconds.)
Indirect SACT—Narula Method (Fig. 26.7).From a catheter placed in the HRA in the region of the sinus node, a drive train (commonly eight beats) of atrial overdrive pacing is delivered at a PCL approximately 50 milliseconds (50 to 150 milliseconds) faster than the sinus rate. This rate is assumed to be fast enough such that the last beat will capture the sinus node but slow enough to avoid significant prolongation of SNRT. The interval from the last paced stimulus to the first return sinus activation recorded by the atrial EGM on the pacing catheter is measured. The estimated SACT = (Escape interval – SCL)/2. This assumes that the conduction times into and out of the sinus node are equal.
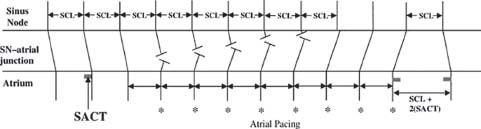
FIGURE 26.7 Estimation of SACT, Narula method.
Indirect SACT—Strauss Method (Fig. 26.8). During sinus rhythm (A1), single premature atrial beats (A2) are delivered, starting with a long coupling interval and decrementing by 10 milliseconds. The atrial EGM of the sinus return beat (A3) is recorded. The sinus return intervals after the premature beats (A2-A3) are plotted against A1-A2 intervals (Fig. 26. 8E). Four zones can be described:
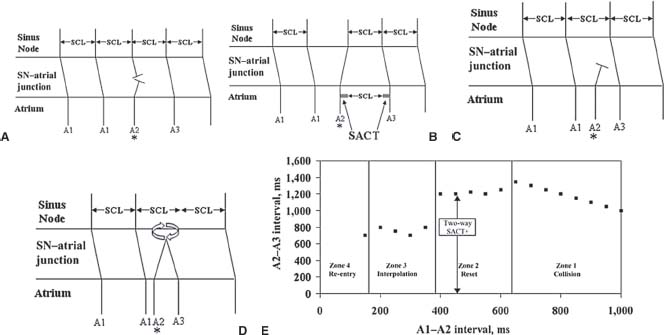
FIGURE 26.8 Estimation of SACT, Strauss method. A: Zone 1,zone of collision. B: Zone 2, zone of reset. C: Zone 3, zone of interpolation. D: Zone 4, zone of re-entry. E: A1–A2 versus A2–A3.
Zone of Collision or Nonreset (Zone 1, Fig. 26. 8A). Very late-coupled premature atrial beats (A2) collide with the preceding sinus node outgoing activation (At) and do not penetrate into the sinus node. Thus, the sinus node is unaffected, and the next sinus activation (A3) occurs on time (i.e., the sinus node timing is not reset). In this A1-A2 zone of collision, as A1-A2 coupling interval shortens, A2-A3 prolongs by the same amount. Thus, (A1-A2) + (A2-A3) = 2 × (A1-A1).
Zone of Reset (Zone 2, Fig. 26. 8B): In this zone, the premature atrial extrastimuli (A2) penetrate the sinus node and reset the timing of the sinus node, resulting in an advancement in the time of the next sinus activation (A3). During this zone, A2-A3 interval stays relatively constant, representing a plateau in the A1-A2 versus A2-A3 plot. This A2-A3 interval consists of the escape interval of the sinus node and the two-way SACT (A2-A3 = A1-A1 + 2-way SACT). The two-way SACT is estimated as the difference between the plateau A2-A3 and the SCL (A1-A1). Thus, two-way SACT = A2A3-A1-A1
Zone of Interpolation (Zone 3, Fig. 26. 8C): As the premature atrial extrastimulus (A2) coupling interval (A1-A2) shortens further, entrance block may occur in the tissue surrounding the sinus node. In this zone, the premature atrial impulse may not penetrate the sinus node. The escape or return sinus interval (A2-A3) shortens, because A2 does not reset the node. The A1-A3 interval may be the same as the A1-A1 interval (SCL). In other words, (A1-A2) + (A2-S3) = (A1-A1). However, if A2 conducts to the perinodal tissue, causing the return or escape sinus beat to conduct slower on its way out of the sinus node, A2-A3 may be slightly prolonged, so the sum of (A1-A2) + (A2-S3) may be slightly longer than A1-A1 during some parts of this zone.
Zone of Reentry (Zone 4, Fig. 26. 8D): In some patients, a reentrant beat is induced by a short-coupled atrial extrastimulus. In this zone, A1-A3 is shorter than the SCL A1-A1.
The SACT by Strauss method may be estimated in a shorter protocol by introducing atrial premature beats (A2) at approximately 40% to 60% of the SCL and measuring A2-A3 at several A1-A2 coupling intervals. If the A2-A3 intervals are relatively constant (variation <50 milliseconds), then it is assumed these have been delivered during the plateau phase (Zone 2) and the SACT can be calculated. However, if a stable A2-A3 is not achieved, then the Strauss SACT should not be reported.
Sinus Node Effective Refractory Period (SNERP): Sinus node depolarization may be recorded directly, but is technically difficult. Recording may not be successful even with use of high gains and filtering to allow low-frequency signals. SNERP may be indirectly estimated as the A-A2 interval at which Zone 3 interpolation begins in the Strauss SACT method. At this A-A2 interval, neither sinus node reset nor activation occurs.
Intrinsic Heart Rate (IHR): The intrinsic sinus rate is inferred as the sinus rate after application of autonomic blockade, using both atropine and propranolol to block vagal and sympathetic inputs, respectively IHR varies with age and can be estimated by the formula: IHR = 118.1 – 0.57 (age)
The sensitivity for sinus node dysfunction causing symptoms is approximately 54% for CSNRT, approximately 51% for SACT, approximately 64% for combined CSNRT + SACT with specificity approximately 88%. The low sensitivity and specificity of EP study for detection of sinus node dysfunction limits its value in prediction of future events in asymptomatic patients.
Response to Carotid Sinus Massage: Right and left carotid sinus massage may be performed in patients with syncope of undetermined etiology and no evidence of carotid vascular disease. A sinus pause or AV block >3 seconds with reproduction of clinical symptoms is considered a positive response to carotid sinus massage. A cardioinhibitory response occurs in >70% of patients with a positive response, a vasodepressor response (BP drop <50 mm Hg) in approximately 15%, and both in others.
ASSESSMENT OF AV CONDUCTION
The AVN and His-Purkinje system (HPS) function are tested using atrial pacing, atrial extrastimuli, and pharmacologic challenge techniques. The AH interval estimates conduction time through the AVN. The HV interval assesses infra-Hisian conduction and estimates conduction time from the His bundle to the first onset of ventricular activation. Retrograde conduction is tested by ventricular pacing and ventricular extrastimuli.
Baseline AV Conduction
AH Interval. The AH interval (Fig. 26.2), an estimation of the conduction time through the AVN, is measured on the HBE from the first major deflection as it crosses baseline to the onset of the His bundle EGM. Normal range is greatly variable based on autonomic tone and medications. The input to the AVN is estimated by the atrial EGM and the output of the AVN by the His deflection on the HBE tracing.
HV Interval. The HV interval (Fig. 26.2) is measured on the HBE from the onset of the His deflection to the earliest onset of ventricular activation seen on any surface lead or intracardiac EGM. The normal range for HV intervals is 35 to 55 milliseconds. A short HV interval may be seen in ventricular preexcitation syndromes, where HV may be negative when ventricular activation is preexcited by anterograde conduction through an accessory pathway that beats out ventricular activation by the AVN to HPS. A short HV may also be measured if a premature ventricular depolarization occurs prior to ventricular activation, and also if the HBE is placed distally and is recording a distal His or right bundle potential. A long HV interval suggests HPS conduction disease.
RB-V Interval. This interval measures the onset of the right bundle potential to the earliest ventricular activation on any surface lead or intracardiac EGM.
Incremental Atrial Pacing
Anterograde AV conduction can be studied during incremental atrial pacing, which refers to atrial pacing at shorter and shorter PCLs. The presence of decremental AV conduction, typical of AVN conduction, and the pattern of ventricular activation are determined to help distinguish whether anterograde conduction occurs via the AVN or via an accessory pathway.
AH Decrement. The AH interval normally prolongs as atrial pacing rate increases (as PCL is shortened). This is termed “decremental conduction,” which is a property of AV nodal tissue. Failure to decrement AV conduction (AH may decrement but AV interval may stay constant with shortening of the HV interval) suggests the presence of an accessory pathway. Conduction through a typical accessory pathway is usually nondecremental.
Pattern of Ventricular Activation. Conduction through the AVN and HPS inscribes a narrow QRS in the absence of aberrancy, or block in a component of the HPS. Conduction through a typical accessory pathway usually does not decrement. However, as atrial PCL shortens (at faster paced rates), conduction through the AVN will decrement. In the presence of an accessory pathway, slower conduction through the AVN may allow a larger contribution of ventricular activation to occur via the accessory pathway. This may be manifest as a wider QRS with more and more preexcitation becoming evident at faster PCLs.
PCL of AV Block. The longest atrial PCL associated with a failure of AV conduction is considered the PCL of AV block. This PCL is sometimes termed the “Wenckebach PCL” when conduction block occurs in a second-degree AV block Mobitz I pattern, which is the normal response of the AVN to atrial pacing at shorter PCLs. A typical accessory pathway generally blocks in a 2:1 fashion rather than in a Wenckebach pattern.
PCL of HV Block. This interval is the longest atrial PCL at which block occurs below the His bundle (His deflection without following ventricular activation). This represents an abnormal finding if infra-Hisian block or HV prolongation occurs at atrial PCLs longer than 400 milliseconds.
AV BLOCK: AV NODE VERSUS INFRA-HISIAN BLOCK
EP studies can be useful in determining the level of AV block. Block in the AVN is usually associated with a narrow QRS. On intracardiac EGMs recorded at the HBE, an atrial EGM that blocks with no His deflection indicates block occurred in the AVN (Fig. 26.9 left panel). Infra-Hisian block is usually associated with a wider QRS. At the HBE, an atrial EGM and His deflection is inscribed, but with no succeeding ventricular activation. Thus, activation proceeded from the atrium, through the AVN, to the His bundle, with subsequent block occurring below the His bundle (Fig. 26.9 right panel).
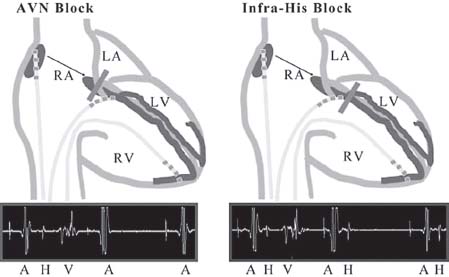
FIGURE 26.9 Level of AV block.


