Electrophysiologic Investigation: General Concepts
The electrophysiologic study should consist of a systematic analysis of dysrhythmias by recording and measuring a variety of electrophysiologic events with the patient in the basal state and by evaluating the patient’s response to programmed electrical stimulation. To perform and interpret the study correctly, one must understand certain concepts and methods, including the different types of electrogram recordings, measurement of atrioventricular (A-V) conduction intervals, activation mapping, and response to programmed electrical stimulation. Knowledge of the significance of the various responses, particularly to aggressive stimulation protocols, is mandatory before employing such responses to make clinical judgments. Although each electrophysiologic study should be tailored to answer a specific question for the individual patient, understanding the spontaneous electrophysiologic events and responses to programmed stimulation is necessary to make sound conclusions.
Electrogram Recordings
As discussed in Chapter 1, electrograms can be recorded as unfiltered or filtered unipolar signal or bipolar signals. Unipolar signals provide precise activation and give directional information. When unfiltered, significant far field activity is recorded that can make it difficult to see small local unipolar signals without increasing the size of the signal so much it swamps the amplifier. Respiratory drift is another problem. Filtering the unipolar signal gives precise localization and removes far field activity but often results in a very small signal, particularly in infarcted tissue. A bipolar signal approximates the timing recorded by the filtered unipolar signal, particularly with narrow interelectrode distances (≤2 mm) and removes far field signals, but does not give the directional information of the unfiltered unipolar signal. For ablation, particularly for the WPW syndrome and idiopathic VPCs/VT (see Chapter 14), it is important to record both simultaneously to assure the earliest components of the bipolar signal are derived from the distal pole, which is used for ablation, and not the proximal pole. Use of notch filters can add artifactual complexity to the signal and should not be used routinely. If there is severe 60-Hz interference, eliminating such noise is preferable.
Measurement of Conduction Intervals
The accuracy of measuring an intracardiac interval is related to the recording mode (unipolar or bipolar; see Chapter 1) and the computer screen or paper speed at which the recordings are made. Since most electrophysiologists use filtered bipolar recordings as the default mode the discussion of such measurements will be limited to results using these recordings. The range of speeds generally used is 100 to 400 mm/sec. The accuracy of measurements made at 100 mm/sec is approximately ±5 msec, and the accuracy of measurements made at 400 mm/sec is increased to ±1 msec. To evaluate sinus node function, for which one is dealing with larger intervals (i.e., hundreds of milliseconds), a recording speed of 100 mm/sec is adequate. Routine refractory period studies require slightly faster speeds (150 to 200 mm/sec), especially if the effects of pharmacologic and/or physiologic maneuvers are being evaluated. For detailed mapping of endocardial activation, paper speeds of ≥200 mm/sec or more should be used.
His Bundle Electrogram
The His bundle electrogram is the most widely used intracardiac recording to assess A-V conduction because more than 90% of A-V conduction defects can be defined within the His bundle electrogram.1,2,3,4,5,6 Before measuring the conduction intervals, however, one must validate the His bundle deflection because all measurements are based on the premise that depolarization of the His bundle is being recorded. As noted in Chapter 1, using a 5- to 10-mm bipolar recording, the His bundle deflection appears as a rapid biphasic or triphasic spike, 15 to 25 msec in duration, interposed between local atrial and ventricular electrograms. To evaluate intra-His bundle conduction delays, one must be sure that the spike represents activation of the most proximal His bundle and not the distal His bundle or the right bundle branch (RBB) potential. Validation of the His bundle potential can be accomplished by several methods, described below.
Assessment of “H”-V Interval
The interval from the apparent His bundle deflection to the onset of ventricular depolarization should be no less than 35 msec in adults. Intraoperative measurements of the H-V interval have demonstrated that, in the absence of pre-excitation, the time from depolarization of the proximal His bundle to the onset of ventricular depolarization ranges from 35 to 55 msec.7,8 Furthermore, the RBB deflection invariably occurs 30 msec or less before ventricular activation. Thus, during sinus rhythm an apparent His deflection with an H-V interval of less than 30 msec either reflects recording of a bundle branch potential or the presence of pre-excitation.
Establishing Relationship of the His Bundle Deflection to other Electrograms: Role of Catheter Position
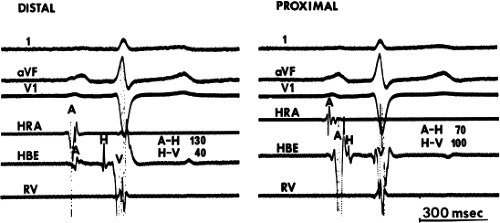
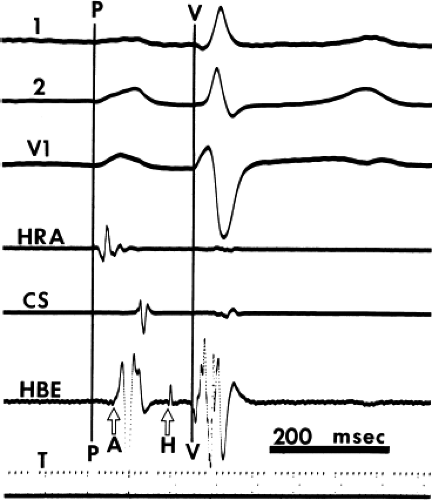
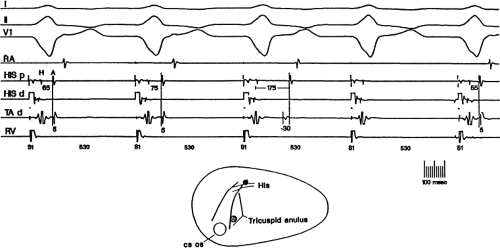
Because, anatomically, the proximal portion of the His bundle begins on the atrial side of the tricuspid valve, the most proximal His bundle deflection is that associated with the largest atrial electrogram. Thus, even if a large His bundle deflection is recorded in association with a small atrial electrogram, the catheter must be withdrawn to obtain a His bundle deflection associated with a larger atrial electrogram. This maneuver can on occasion markedly affect the measured H-V interval and can elucidate otherwise inapparent intra-His blocks (Fig. 2-1).9 Thus, when a multipolar (≥3) electrode catheter is used, it is often helpful to simultaneously record from the proximal and distal pair of electrodes to ensure that the His bundle deflection present in the distal pair of electrodes is the most proximal His bundle deflection. Use of a quadripolar catheter with a 5-mm interelectrode distance has facilitated recording proximal and distal His deflections without catheter manipulation, enabling one to record three bipolar electrograms over a 1.5 cm distance. Use of more closely spaced electrodes (1 to 2 mm) does not add a more accurate recording of the proximal His potential, since a His potential can be recorded up to 8 mm from the tip. However, use of a decapolar catheter with 1- to 2-mm interelectrode distance can record proximal, mid, and distal recordings of the His bundle as well as the RBB potential. Occasionally a “His bundle” spike can be recorded more posteriorly in the triangle of Koch. Abnormal sites of His bundle recordings may be noted in congenital heart disease, that is, septum primum atrial septal defect. Another method to validate a proximal His bundle deflection is to record pressure simultaneously with a luminal electrode catheter. The proximal His bundle deflection is the His bundle electrogram recorded with simultaneous atrial pressure. Atrial pacing may be necessary to distinguish a true His deflection from a multicomponent atrial electrogram. If the deflection is a true His deflection, the A-H should increase as the paced atrial rate increases.
Simultaneous Left-sided and Right-sided Recordings
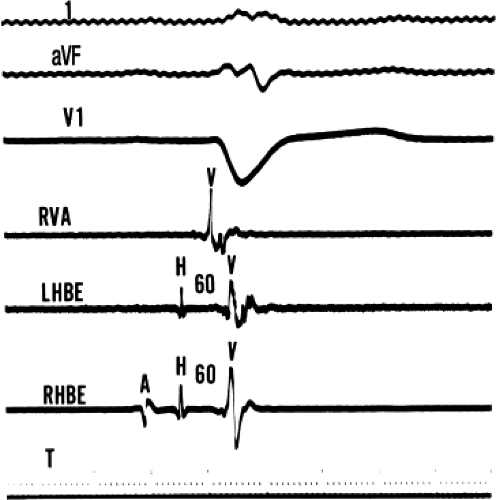
As noted in Chapter 1, a His bundle deflection can be recorded in the aorta from the junction of the noncoronary and right coronary cusp or from just inside the ventricle under the aortic valve. Because these sites are at the level of the central fibrous body, the proximal penetrating portion of the His bundle is recorded and can be used to time the His bundle deflection recorded via the standard venous route. Simultaneous left-sided and right-sided depolarization is being recorded. An example of this technique is demonstrated in Figure 2-2, in which the standard His bundle deflection by the venous route is recorded simultaneously with the His bundle deflection obtained from the noncoronary cusp in the left-sided His bundle recording. Advancement of the left-sided catheter into the left ventricle often results in the recording of a left bundle
branch (LBB) potential; therefore, care must be exercised in using a left-sided potential for timing. Thus, recording from the noncoronary cusp is preferred because only a true His bundle deflection can be recorded from this site. Because the LBBs and RBBs are depolarized virtually simultaneously,10 the LBB potential can be used to distinguish a true His bundle potential from an RBB potential; earlier inscription of the venous His bundle deflection suggests that it is a valid His bundle potential.
branch (LBB) potential; therefore, care must be exercised in using a left-sided potential for timing. Thus, recording from the noncoronary cusp is preferred because only a true His bundle deflection can be recorded from this site. Because the LBBs and RBBs are depolarized virtually simultaneously,10 the LBB potential can be used to distinguish a true His bundle potential from an RBB potential; earlier inscription of the venous His bundle deflection suggests that it is a valid His bundle potential.
His Bundle Pacing
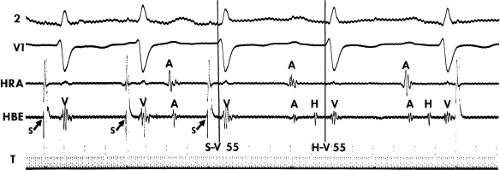
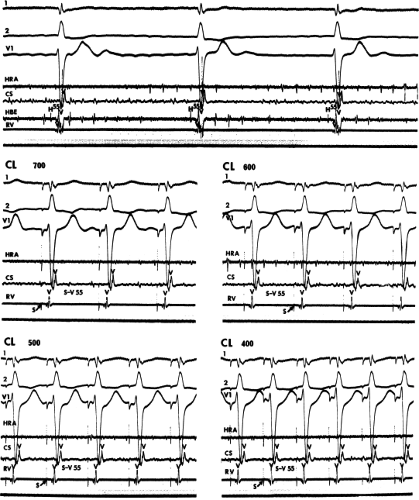
The ability to pace the His bundle through the recording electrodes and obtain (a) QRS and T waves identical to those during sinus rhythm in multiple leads and (b) a stimulus-to-V interval identical to the H-V interval measured during sinus rhythm perhaps provides the strongest criteria validating the His bundle potential.11,12,13,14,15 Although the stimulus-to-V criterion is frequently met, multiple-surface ECG lead recordings are needed to ensure that no changes in the QRS or T waves appear during His bundle pacing. Sometimes simultaneous atrial pacing can distort the QRS, making it difficult to ensure true His bundle pacing. Although continuous His bundle pacing is difficult, the demonstration of His bundle pacing for two or three consecutive beats may suffice for validation (Fig. 2-3). Occasionally, one can pace the His reliably over a wide range of cycle lengths (Fig. 2-4). This allows one to obtain a 12-lead ECG to ensure His bundle pacing.
The major criticism of this technique is the inconsistency with which His bundle pacing can be accomplished, especially at low current output (mA).16,17,18 Higher mA may result in nonselective His bundle pacing, particularly if a catheter with an interelectrode distance of 1 cm is used. In experienced hands, however, His bundle pacing can usually be accomplished safely at relatively low mA (i.e., 1.5 to 4 mA). The use of more closely spaced electrodes and the reversal of current polarity, i.e., anodal stimulation, may facilitate the pacing of the His bundle.19 Because intraoperative pacing of the distal His bundle usually results in ventricular pacing (in 94% of patients) over a wide range of mA, one might record a true His bundle (distal) deflection but be incapable of selectively pacing the His bundle. His bundle pacing can frequently be performed from the proximal His bundle. Pacing from that site provides the strongest evidence that a true His bundle deflection has been recorded. The failure to selectively pace a His bundle, however, does not necessarily imply that the deflection recorded is a bundle branch potential.
In summary, measurement of conduction intervals within the His bundle electrogram requires validation that the proximal His bundle is being recorded because the proximal His bundle is the fulcrum of the A-V conduction system (AVCS). The extent to which one attempts to validate the His bundle potential in a given patient depends on one’s experience, but some form of validation is imperative.
A-H Interval
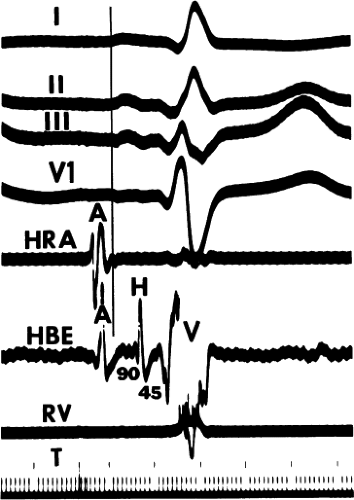
The A-H interval represents conduction time from the low-right atrium at the interatrial septum through the A-V node to the His bundle. Thus, the A-H interval is at best only an approximation of A-V nodal conduction time. The measurement should therefore be taken from the earliest reproducible rapid deflection of the atrial electrogram in the His bundle recording to the onset of the His deflection defined by the earliest reproducible deflection from baseline (Fig. 2-5). This is not the activation time at the site (see Chapter 1). Because the exact point in time within the atrial electrogram when the impulse encounters the A-V node is not known, and the atrial component of the HBE often has multiple components, the most important criterion for measurement is reproducibility. One must make these measurements at the same gain because the first visible rapid deflection of the atrial electrogram may differ, depending on the gain. Furthermore, the A-H interval can be markedly affected by the patient’s autonomic state. The interval may vary 20 to 50 msec during a single study merely because of a change in the patient’s sympathetic and/or parasympathetic tone.20 Thus, it is important to realize that one should not consider that the absolute value of the A-H interval represents a definitive assessment of A-V nodal function; extranodal influences may make an A-H interval short (when sympathetic tone is enhanced) or long (when vagal tone is enhanced) in the absence of any abnormality of A-V nodal function. Moreover, some investigators have demonstrated that the A-H interval may vary according to the site of the atrial pacemaker.21,22 This is commonly observed when atrial activation is initiated in the left atrium or near the os of the coronary sinus. In both instances, the impulses may either enter the A-V node at a different site that bypasses part of the A-V node, or they may just enter the A-V node earlier with respect to the atrial deflection in the His bundle electrogram. Both mechanisms can give rise to a “shorter” A-H interval than during sinus rhythm but one could not tell whether A-V nodal conduction was the same or shorter than that during
sinus rhythm by this single measurement. Normal values for A-H intervals in adults during sinus rhythm range from 45 to 140 msec (Table 2-1)1,2,3,4,5,6,9,14,18,23,24,25,26,27,28; the values in children are lower.7,8,29 Variations in reported normal intervals are due to differences in (a) the method of measurement and/or (b) the basal state of the patient at the time of the electrophysiologic study. The response of the A-H interval to pacing or drugs (e.g., atropine) often provides more meaningful information about the functional state of the A-V node than an isolated measurement of the A-H interval. Autonomic blockade with atropine (0.04 mg/kg) and propranolol (0.02 mg/kg) can be used to give a better idea of A-V nodal function in the absence of autonomic influences. Not enough data, however, are available to define normal responses under these circumstances. Even in the presence of autonomic blockade the varying site of origin of the “sinus” impulse in different patients would limit the definition of normal values.
sinus rhythm by this single measurement. Normal values for A-H intervals in adults during sinus rhythm range from 45 to 140 msec (Table 2-1)1,2,3,4,5,6,9,14,18,23,24,25,26,27,28; the values in children are lower.7,8,29 Variations in reported normal intervals are due to differences in (a) the method of measurement and/or (b) the basal state of the patient at the time of the electrophysiologic study. The response of the A-H interval to pacing or drugs (e.g., atropine) often provides more meaningful information about the functional state of the A-V node than an isolated measurement of the A-H interval. Autonomic blockade with atropine (0.04 mg/kg) and propranolol (0.02 mg/kg) can be used to give a better idea of A-V nodal function in the absence of autonomic influences. Not enough data, however, are available to define normal responses under these circumstances. Even in the presence of autonomic blockade the varying site of origin of the “sinus” impulse in different patients would limit the definition of normal values.
TABLE 2-1 Normal Conduction Intervals in Adults | |||||||||||||||||||||||||||||||||||||||||||||
|---|---|---|---|---|---|---|---|---|---|---|---|---|---|---|---|---|---|---|---|---|---|---|---|---|---|---|---|---|---|---|---|---|---|---|---|---|---|---|---|---|---|---|---|---|---|
|
H-V Interval
The H-V interval represents conduction time from the proximal His bundle to the ventricular myocardium. The measurement of the interval is taken from the beginning of the His bundle deflection (the earliest deflection from baseline) to the earliest onset of ventricular activation recorded from multiple-surface ECG leads or the ventricular electrogram in the His bundle recording (Fig. 2-5). Reported normal values in adults range from 25 to 55 msec (Table 2-1); they are shorter in children.7,8 Unlike the A-H interval, the H-V interval is not significantly affected by variations in autonomic tone. The H-V interval remains constant throughout any given study, and it is reproducible during subsequent studies in the absence of pharmacologic or physiologic interventions. The stability of H-V measurements provides the basis for prospective longitudinal studies in conduction system disease. The discrepancies in normal values reported from various laboratories may be due to the following:
His bundle validation was not always performed, resulting in the inclusion of inappropriately short H-V intervals in the range of normal. Thus, reported normal intervals in adults of 30 msec or less (and in my opinion, less than 35 msec) probably represent recordings from an RBB or a distal His bundle potential. This view is supported by direct intraoperative recordings.7,8
The peak or first high-frequency component of the His bundle deflection was taken as the onset of His bundle depolarization. Since the width of the His bundle potential
has been demonstrated to correlate with intra-His conduction time,30 the onset of His bundle activation should be taken as the initial movement, slow or fast, from baseline. Exclusion of initial low amplitude and/or slow components in H-V measurements may yield a short H-V interval. This is of particular importance in the presence of intra-His conduction defects, when improper measurements can result in the failure to identify a clinically significant conduction disturbance.
Multiple ECG leads were not used in conjunction with the intracardiac ventricular electrogram in the His bundle tracing to delineate the earliest ventricular activity, and thus, falsely long H-V intervals were produced. This situation is most likely to occur when a single standard ECG lead is used to analyze earliest ventricular activation, as graphically demonstrated in Figure 2-5, in which the H-V interval shown would be falsely lengthened by 20 msec if the onset of ventricular activation were taken as the onset of the R wave in the lead 2 surface electrogram. If only one ECG channel is available, a V1 or V2 lead should be used because the earliest ventricular activity is usually recorded in one of these leads in the presence of a narrow QRS.31 Data from our laboratory have shown that ventricular activation can, and often does, occur before the onset of the QRS. This is particularly true when infarction of the septum and/or intraventricular conduction defects are present. Thus, even if V1 is used, the H-V interval can be falsely long (Fig. 2-6). New values for normal are probably not necessary, but the significance of a long H-V must be interpreted in light of these findings (see Chapter 4).
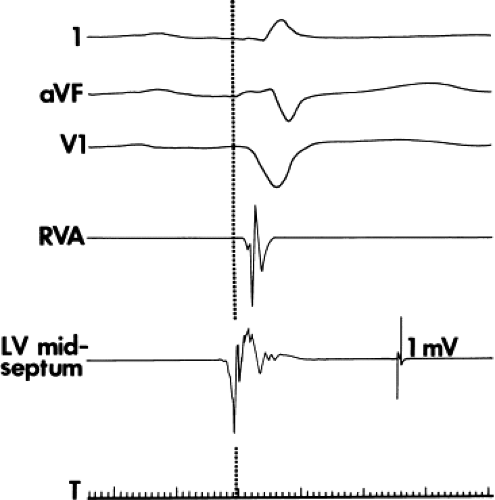 FIGURE 2-6 Presystolic electrogram at the left ventricular septum. Leads 1, aVF, and V1 are shown with electrograms from the right ventricular apex (RVA) and left ventricular (LV) midseptum. An electrogram recorded at the midleft ventricular septum precedes the onset of the QRS by 20 msec. The recognition that presystolic activity exists may play a role in determining the risk of A-V block in patients with conduction disturbances (see Chapter 5). |
Intra-atrial Conduction
The normal sequence of atrial activation and intra-atrial conduction times has not been extensively studied. Many investigators have used the P-A interval (from the onset of the P wave to the onset of atrial activation in the His bundle electrogram) as a measure of intra-atrial conduction (Table 2-1).1,2,3,4,5,6,9,14,18,23,24,25,26,27,28 Several factors, however, render the P-A interval an unsuitable measure of intra-atrial conduction:
A more distal position of the His bundle catheter can result in a longer P-A interval.33
There is no a priori reason that the P-A interval should be a measure of intra-atrial conduction. At best, the P-A interval may reflect intra–right-atrial conduction, but studies have demonstrated that even this assumption is not universally true.32
The onset of atrial activation appears to vary depending on the rate. In sinus tachycardia, the P waves in the inferior leads appear more upright and the onset of atrial activation is most often recorded high in the right atrium. During relatively slow rates, 50 to 60, the P waves become flat in these leads and the earliest onset of atrial activation is often recorded at the midlateral atrial sites.
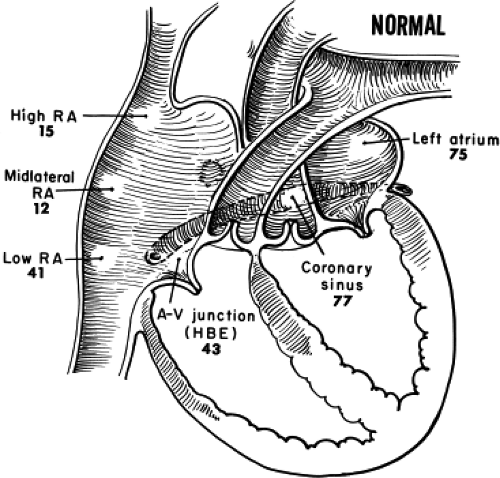
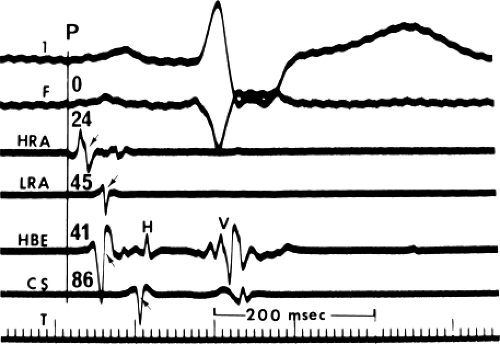
To assess atrial conduction more accurately, we have used endocardial mapping of the atria in our laboratory for several years. A general assessment of intra-atrial conduction can be made using catheter recordings obtained from the high- and low-right atrium at the junctions with the venae cavae, midlateral right atrium, A-V junction (in the His bundle electrogram), proximal, mid- and distal coronary sinus, and/or left atrium. The normal activation times at those sites are shown in Figure 2-8. Detailed mapping of the left atrium requires a transseptal approach or use of a patent foramen ovale. Although the retrograde approach can be used, it is far more difficult to reproducibly map the entire left atrium. Entry to the pulmonary veins by the transseptal approach is readily achievable. When mapping is performed, conduction times should be determined using the point at which the largest rapid deflection crosses the baseline or the peak of the largest deflection (both should be nearly the same in normal tissue). These measurements correlate to the intrinsicoid deflection of the local unipolar electrogram, which in turn has been shown to correlate with local conduction (phase 0) using simultaneously recorded microelectrodes.34 Since the peak may be “clipped” by the amplifier, the point at which the largest rapid deflection crosses the baseline is often used. I prefer to reduce the gain of the signal so that clipping is unnecessary. The peak and its crossing of the baseline are then easy to measure and are more accurate. This differs from the technique of measuring the onset of the His bundle deflection, in which the onset of depolarization of the entire His bundle rather than local activation is desired. Although close (1- to 2-mm) bipolar electrodes record local activity most discriminately, we have obtained comparable data using catheters with a standard (0.5- and/or 1-cm) interelectrode distance. How to best measure activation times of a multicomponent atrial electrogram has not been established. In my opinion, all rapid deflections can be considered relatively local activations (i.e., within a few millimeters). Unipolar signals can help determine the component which is closest to any recording electrode (see Chapter 1). Such electrograms may be caused by a specific anatomic substrate producing nonuniform anisotropy leading to asynchronous activation in the region from which the electrogram is recorded (see Chapter 11). As such, fragmented electrograms are a manifestation of nonuniform anisotropy. A normal atrial endocardial map is shown in Figure 2-9.
Our data have shown that normal atrial activation can begin in either the high or the midlateral right atrium, spread from there to the low atrium and A-V junction, and then spread to the left atrium. As noted previously, in our experience, earlier activation of the high-right atrium is more likely to occur at faster rates (i.e., more than 100 beats per minute [bpm]), and early activation of the midright atrium is more common at rates less than 60 bpm. The mechanism of these findings is uncertain. Two possibilities exist, which are (a) the right atrium has a multitude of pacemaker complexes, the dominance of which is determined by autonomic tone, or (b) these different activation patterns may reflect different routes of exit from a single sinus node.
In one-third of patients whose P waves appeared normal on the surface ECG, the low-right atrium is activated slightly later than the atrium recorded at the A-V junction. Thus, the P-A interval is at best an indirect measure of right atrial conduction. Furthermore, the P-A interval also correlates poorly with P-wave duration in patients with ECG left atrial “enlargement” (LAE).32,33,35 In patients with LAE, the P-to-coronary sinus activation time is prolonged with little change in right-sided activation (Chapter 4).36
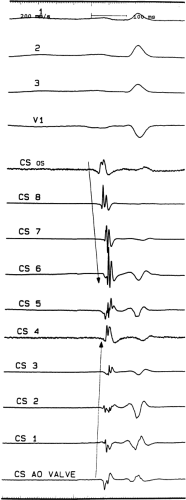
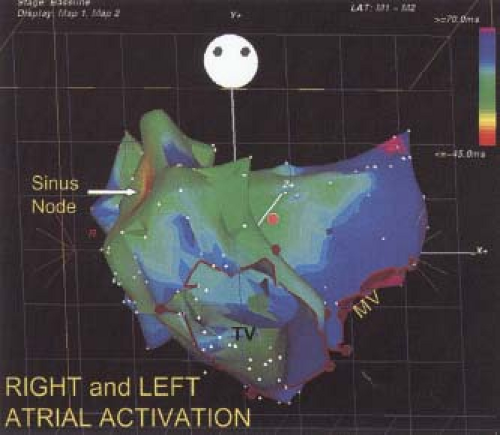
Activation of the left atrium is complicated. Three routes of intra-atrial conduction are possible: (a) superiorly through Bachmann bundle, (b) through the midatrial septum at the fossa ovalis, and (c) at the region of the central fibrous trigone at the apex of the triangle of Koch. The latter provides the most consistent amount of left atrial activation. Activation of the left atrium over Bachmann bundle can be observed in 50% to 70% of patients using the CS, but in nearly all patients with normal atria using transseptal access to the left atrium. It can be demonstrated by distal (superior and lateral) coronary sinus activation preceding midcoronary sinus activation but following proximal (os) coronary sinus activation (Fig. 2-10). The Carto system allows for accurate display of right and left atrial activation, since one can record several hundred sites in both atria. A detailed map of both atria using
this technology is shown in Figure 2-11. Left-to-right atrial activation during distal coronary sinus pacing rarely appears to use Bachmann bundle but primarily crosses at the fossa and low septum. This is particularly true when the recording from the “HRA” is from a catheter in the right atrial appendage, which, not unexpectedly, fails to demonstrate early high-right atrial activation in response to such pacing. If the superior septum is carefully mapped during distal CS pacing, an early breakthrough is usually seen, suggesting propagation over Bachmann Bundle.
this technology is shown in Figure 2-11. Left-to-right atrial activation during distal coronary sinus pacing rarely appears to use Bachmann bundle but primarily crosses at the fossa and low septum. This is particularly true when the recording from the “HRA” is from a catheter in the right atrial appendage, which, not unexpectedly, fails to demonstrate early high-right atrial activation in response to such pacing. If the superior septum is carefully mapped during distal CS pacing, an early breakthrough is usually seen, suggesting propagation over Bachmann Bundle.
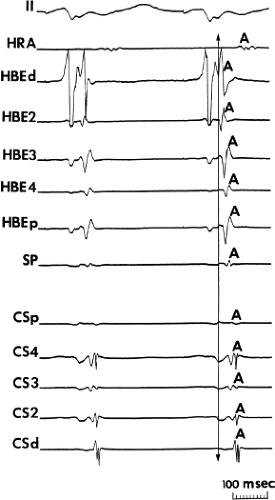
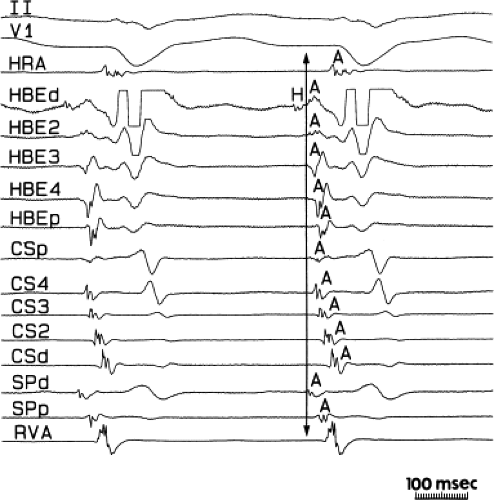
Information about the antegrade and retrograde atrial activation sequences is critical to the accurate diagnosis of supraventricular arrhythmias (Chapter 8).32,37,38,39,40 Normal retrograde activation proceeds over the A-V node. Early observations using His bundle, coronary sinus, and high-right atrial recordings using quadripolar catheters suggested that retrograde atrial activation in response to ventricular premature beats or His bundle rhythms normally begins at the A-V junction, with apparent simultaneous radial spread to the right and left atria.32,41 Thus, the earliest retrograde atrial depolarization is recorded in the His bundle electrogram, then in the adjacent right atrium and coronary sinus, and finally, in the high-right and high-left atria (Fig. 2-12). Recently more detailed atrial mapping during ventricular pacing has demonstrated a complex pattern (see Chapter 8). Basically, at long-paced cycle lengths or coupling intervals atrial activation along a close-spaced (2-mm) decapolar catheter recording a His deflection at the tip is earliest. Secondary breakthrough sites in the coronary sinus catheter and/or posterior triangle of Koch occur in ∼50% of patients (Fig. 2-13). The early left atrial breakthrough probably reflects activation over the left atrial extension of the A-V node. At shorter coupling intervals, particularly during pacing-induced Wenckebach cycles, retrograde activation changes and earliest activation is typically found at the posterior triangle of Koch, the os of the coronary sinus, or within the coronary sinus itself (Fig. 2-14).
Intraventricular Conduction
Intracardiac analysis of intraventricular conduction has not been a routine procedure in most electrophysiologic laboratories. We, however, believe both right and left ventricular mapping are useful in analyzing intraventricular conduction defects, dispersion of ventricular activation and recovery of excitability, and localizing the site of origin of ventricular tachycardias. Specific areas in which left and/or right ventricular mapping has been particularly useful are (a) the finding of presystolic electrical activity on the left ventricular septum causing a “pseudo” H-V prolongation; (b) the finding of abnormal dispersion of activation, refractoriness, and total recovery (sum of local activation and refractoriness) in arrhythmogenic conditions; (c) to distinguish between proximal and distal RBB block; (d) to distinguish LBB block from left ventricular intraventricular conduction defects; (e) to define the site of origin of ventricular tachycardia; (f) to localize the ventricular site of pre-excitation; (g) to evaluate the degree of inter- and intraventricular dysynchrony as a predictor of resynchronization therapy and optimal LV lead placement, and (h) to define a pathophysiologic substrate of arrhythmogenesis that may help to distinguish patients predisposed to lethal arrhythmias.42,43,44,45,46,47,48,49
Although recording electrograms from the right ventricular apex has been used during the past 40 years to distinguish proximal from distal RBB block,44,50,51 the potential role for right ventricular mapping to distinguish tachycardias related to arrhythmogenic right ventricular dysplasia (fractionated electrograms on the free wall of the right ventricle) from right ventricular outflow tract tachycardias that arise on the free wall or “septal” side of the outflow tract in patients without ventricular disease has been recognized (see Chapter 11). In the presence of a normal QRS, the normal activation times from the onset of ventricular depolarization to the electrogram recorded from the catheter placed near the
right ventricular apex range from 5 to 30 msec.50,51 The RV free wall at the insertion of the moderator band into the anterior papillary muscle (apical third of the RV free wall) is typically the earliest site of RV activation and precedes the apical septum by 5 to 15 msec. This is dependent on if there is continuation of the RBB toward the apical septum (<25%) or the apical septum is activated from Purkinje fibers coming off the RBB in the moderator band (see Chapter 5). Differences in this timing relate to catheter placement more toward right ventricular apex or more toward the free wall at the base of insertion of the papillary muscle or after the takeoff of the moderator band. In addition, most investigators record from the proximal poles of a quadripolar catheter. Multiple levels of block in the right-sided conduction system can be assessed.44 Patients with proximal RBB block (long V to RV apex activation time) and long H-V intervals found postoperatively after repair of tetralogy of Fallot may be at high risk for heart block and subsequent sudden cardiac death caused by ventricular arrhythmias. Use of simultaneous recordings from a multipolar catheter positioned along the RBB can facilitate determining the site of RBB block/delay or establish whether a tachycardia mechanism requires the RBB (e.g., bundle branch reentry).
right ventricular apex range from 5 to 30 msec.50,51 The RV free wall at the insertion of the moderator band into the anterior papillary muscle (apical third of the RV free wall) is typically the earliest site of RV activation and precedes the apical septum by 5 to 15 msec. This is dependent on if there is continuation of the RBB toward the apical septum (<25%) or the apical septum is activated from Purkinje fibers coming off the RBB in the moderator band (see Chapter 5). Differences in this timing relate to catheter placement more toward right ventricular apex or more toward the free wall at the base of insertion of the papillary muscle or after the takeoff of the moderator band. In addition, most investigators record from the proximal poles of a quadripolar catheter. Multiple levels of block in the right-sided conduction system can be assessed.44 Patients with proximal RBB block (long V to RV apex activation time) and long H-V intervals found postoperatively after repair of tetralogy of Fallot may be at high risk for heart block and subsequent sudden cardiac death caused by ventricular arrhythmias. Use of simultaneous recordings from a multipolar catheter positioned along the RBB can facilitate determining the site of RBB block/delay or establish whether a tachycardia mechanism requires the RBB (e.g., bundle branch reentry).
We have actively pursued detailed evaluation of endocardial activation of the left ventricle during sinus rhythm in our laboratory.42,43,45,48,49 We believed it was imperative to establish normal electrogram characteristics as well as activation patterns and recovery times to evaluate conduction defects related to the specialized conducting system or myocardial infarction or electrophysiologic abnormalities associated with a propensity to ventricular arrhythmias. We performed characterization of electrograms, both qualitatively and quantitatively, and particularly, activation patterns in 15 patients with no evidence of cardiac disease. In all cases, we performed left ventricular mapping using a Josephson quadripolar catheter (0.5-cm interelectrode distance). We inserted the catheter percutaneously into the femoral artery and advanced it to the left ventricle under fluoroscopic guidance. We inserted one to two quadripolar catheters percutaneously in the right femoral vein and advanced to the right ventricular apex and
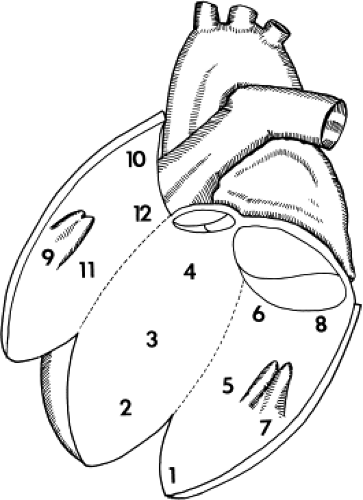
outflow tract as reference electrodes. We used the left ventricular mapping schema representing 12 segmental areas of the left ventricle (Fig. 2-15). We recorded 10 to 22 electrograms in each patient with the catheter sites verified by multiplane fluoroscopy. We ensured stability by recording from each site for a minimum of 5 to 30 seconds. We made all electrogram measurements using 1-cm interelectrode distance, using the distal electrode paired with the third electrode of the catheter. We filtered all electrograms at 30 to 500 Hz. We noted no difference in activation time or electrogram characteristics when a 5-mm recording interelectrode distance was used on the same catheter. We also recorded the intracardiac electrograms at a variable gain to achieve the best electrographic definition and accompanied it by a 1-mV calibration signal. A 10-mm bipolar fixed-gain signal was recorded at 1-cm/mV amplification at each site.
outflow tract as reference electrodes. We used the left ventricular mapping schema representing 12 segmental areas of the left ventricle (Fig. 2-15). We recorded 10 to 22 electrograms in each patient with the catheter sites verified by multiplane fluoroscopy. We ensured stability by recording from each site for a minimum of 5 to 30 seconds. We made all electrogram measurements using 1-cm interelectrode distance, using the distal electrode paired with the third electrode of the catheter. We filtered all electrograms at 30 to 500 Hz. We noted no difference in activation time or electrogram characteristics when a 5-mm recording interelectrode distance was used on the same catheter. We also recorded the intracardiac electrograms at a variable gain to achieve the best electrographic definition and accompanied it by a 1-mV calibration signal. A 10-mm bipolar fixed-gain signal was recorded at 1-cm/mV amplification at each site.
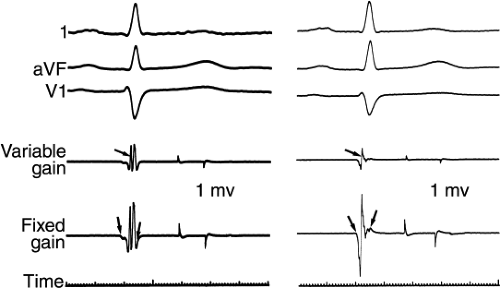
We defined electrographic amplitude (in mV) as the maximum upward to maximum downward deflection. We defined electrogram duration (in msec) as the time from the earliest electrical activity to the onset of the decay artifact as measured in the fixed-gain bipolar electrogram. We combined the amplitude and duration measurements to give an amplitude/duration ratio to allow equal emphasis to be placed on each of these values. We defined local activation time at any given site as the time from the onset of the surface QRS to the time when the largest rapid deflection crossed the baseline in the 10-mm variable-gain electrogram. Examples of these techniques are shown in Figure 2-16.
We defined normal electrogram amplitude and duration as those within 95% confidence limits for all electrograms for those measurements. We defined electrograms as basal (sites 4, 6, 8, 10, and 12) or nonbasal (sites 1, 2, 3, 5, 7, 9, and 11). Newer technologies for mapping (e.g., Carto System, Biosense, Inc.) require new standards for normals since different electrode size, interelectrode distance, and configuration (unipolar vs. bipolar) as well as different filtering are used. The Biosense Webster system can measure absolute unipolar
or bipolar voltage and automatically chooses an activation time which can be adjusted by the operator. In early versions it was possible to create off-line late potential and electrogram duration maps. This will probably be reintroduced in newer models. Integration with laboratory systems is possible, and has already been accomplished in the Prucka system. With the Carto system, which uses a 4-mm tip and 2-mm interelectrode distance, the Penn group52,53 found normal bipolar LV electrograms to have an mean amplitude of 1.62 mV and the RV an amplitude of 1.47 mV. These signals were filtered at 30 to 150 Hz. We have noted similar values of ∼1.5 mV in the LV and 1.40 mV in the RV, with higher values in the LV in the presence of LVH. Callans et al.54 defined scar in an porcine model of infarction of ∼0.5 mV using both echo and pathology. Similar values in humans have been proposed by Marchlinski et al.52 using nuclear scan as a correlate. We have found dense transmural scar to have amplitudes of <0.1 mV in our initial mapping studies,49 and similar values using Carto with MRI defined scar as a correlate. These findings are critical for substrate mapping (see Chapter 14). The Penn group55,56 has suggested that unipolar recordings may be useful in detecting subepicardial or intramural disease. Normal LV values are >8.3 mV; lower values are said to represent loss of cells and fibrosis/scar. They even suggest it might be able to distinguish nonreversible cardiomyopathy.55,56 I believe this requires validation. We have seen patients, particularly those with hypertrophy, have extensive scar detected by diffuse delayed gadolinium enhancement on MRI but who have normal bipolar and unipolar recordings. The degree of filtering effects recordings. Filtered bipolar recordings are a reflection of rapid conduction, while unfiltered (0.05 to 500 Hz) recordings reflect volume of tissue and direction of propagation. Hence they measure different things.
or bipolar voltage and automatically chooses an activation time which can be adjusted by the operator. In early versions it was possible to create off-line late potential and electrogram duration maps. This will probably be reintroduced in newer models. Integration with laboratory systems is possible, and has already been accomplished in the Prucka system. With the Carto system, which uses a 4-mm tip and 2-mm interelectrode distance, the Penn group52,53 found normal bipolar LV electrograms to have an mean amplitude of 1.62 mV and the RV an amplitude of 1.47 mV. These signals were filtered at 30 to 150 Hz. We have noted similar values of ∼1.5 mV in the LV and 1.40 mV in the RV, with higher values in the LV in the presence of LVH. Callans et al.54 defined scar in an porcine model of infarction of ∼0.5 mV using both echo and pathology. Similar values in humans have been proposed by Marchlinski et al.52 using nuclear scan as a correlate. We have found dense transmural scar to have amplitudes of <0.1 mV in our initial mapping studies,49 and similar values using Carto with MRI defined scar as a correlate. These findings are critical for substrate mapping (see Chapter 14). The Penn group55,56 has suggested that unipolar recordings may be useful in detecting subepicardial or intramural disease. Normal LV values are >8.3 mV; lower values are said to represent loss of cells and fibrosis/scar. They even suggest it might be able to distinguish nonreversible cardiomyopathy.55,56 I believe this requires validation. We have seen patients, particularly those with hypertrophy, have extensive scar detected by diffuse delayed gadolinium enhancement on MRI but who have normal bipolar and unipolar recordings. The degree of filtering effects recordings. Filtered bipolar recordings are a reflection of rapid conduction, while unfiltered (0.05 to 500 Hz) recordings reflect volume of tissue and direction of propagation. Hence they measure different things.
Any time catheters with different sized electrodes are used, new normal values need to be established. It is important to recognize the fact that our initial studies used both amplitude and duration to define electrograms. This requires a fixed gain at which the electrograms are recorded, something newer technology currently does not have available.
Description of Electrograms
In our initial studies we obtained 156 electrograms (both variable and fixed gain) in 10 patients for quantitative analysis of characteristics of amplitude and duration. The use of mean values for multiple electrograms recorded from the same defined site left 112 electrograms for analysis. We obtained 215 electrograms (variable gain only) in 15 patients for analysis of left ventricular endocardial activation time. When only 1 electrogram per site was used, 169 electrograms were analyzed for activation time. We found no significant difference in activation times or electrographic characteristics when analyzing the total number of electrograms or the per-site mean average of electrograms. We have therefore reported our results using the per-site mean average.
Descriptive Characteristics
Electrograms from normal left ventricles had rapid deflections and distinct components. We recorded low-amplitude slow activity of only a few milliseconds’ (range, 2 to 15 msec) duration at the beginning of all electrograms. We observed no split, fractionated, or late electrograms (e.g., after the QRS) (see Chapter 11).48,49
Quantitative Characteristics
Results of the quantitative analysis of normal electrographic characteristics are listed in Table 2-1. Mean electrographic amplitude was 6.7 ± 3.4 mV, and 95% of the electrograms were of an amplitude of 3 mV or greater. Mean electrogram duration was 54 ± 13 msec; 95% of the electrograms were of 70 msec or less duration. Mean electrogram/duration ratio was 0.133 ± 0.073 mV/sec, and the ratio for 95% of the electrograms was 0.045 mV/msec or greater. Quantitative descriptions of all electrograms recorded are listed in Tables 2-2 and 2-3 Basal electrograms tended to be of lower amplitude (6.5 vs. 6.9 mV; p = NS), of greater duration (60 vs. 50 msec; p < 0.001), and to have a lower amplitude/duration ratio (0.166 vs. 0.144 mV/msec; p < 0.05) (Table 2-2). As noted earlier normal RV and LV voltage have been determined using the Navistar (Biosense Webster) 4-mm tip catheter. No other catheters have been used to obtain normal values. As such, normal values for voltage need to be determined when other tip size or interelectrode distance is used.
Left Ventricular Endocardial Activation
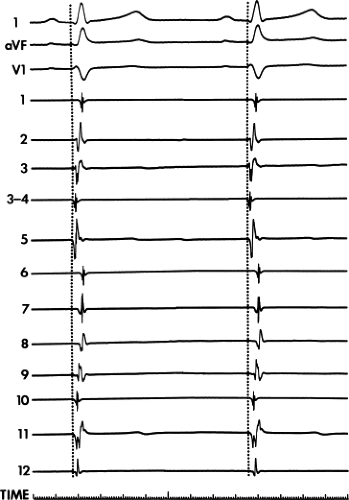
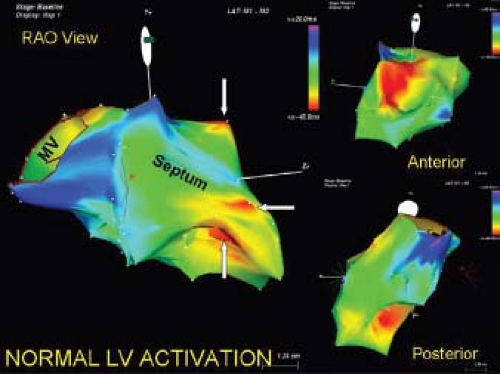
Left ventricular endocardial activation began at 0 to 15 msec (mean, 6 msec) after the onset of the QRS. Left ventricular endocardial activation was completed at 29 to 52 msec (mean, 43 msec). The duration of left ventricular endocardial activation ranged from 28 to 50 msec (mean 36). This comprised 41% of the total surface QRS complex (mean QRS duration, 87 msec; range, 80 to 100 msec). An analog map is shown in Figure 2-17.
We observed a definite pattern of left ventricular endocardial activation, although some patient-to-patient variability existed. The midseptum and the inferior wall adjacent to the midseptum was the earliest area of left ventricular endocardial activation, while the superior-basal aspect of the free wall was a third endocardial breakthrough site. Sometimes the earliest septal and inferior sites were close to one another, but in the majority (10/15, 67%) earliest sites of endocardial breakthrough were nonadjacent. Activation then appeared to spread radially from these breakthrough sites, so that the apex was activated relatively late, whereas the base at the inferior-posterior wall was consistently the last area to be activated. Analog records of ventricular activation are shown in Figure 2-17.
Using our mapping techniques (5-mm bipolar recordings filtered at 30 to 500 Hz), we were able to discern a distinct third endocardial breakthrough site, in the vast majority of patients analogous to that noted by Durrer et al.57 The inability to see
this universally was most likely due to the limitation of defining discrete activation sites, particularly at the midseptum and adjacent inferior wall using nonsteerable catheters. Using the Carto system (Biosense, Inc.) we have been more consistently able to define separate septal and inferior wall breakthrough sites comparable to those described by Durrer et al.57
this universally was most likely due to the limitation of defining discrete activation sites, particularly at the midseptum and adjacent inferior wall using nonsteerable catheters. Using the Carto system (Biosense, Inc.) we have been more consistently able to define separate septal and inferior wall breakthrough sites comparable to those described by Durrer et al.57
TABLE 2-2 Summary of Electrogram Characteristics in Normal Left Ventricles | ||||||||||||||||||||||||||||||||||||||||||||||||||||||||||||||||||||||
|---|---|---|---|---|---|---|---|---|---|---|---|---|---|---|---|---|---|---|---|---|---|---|---|---|---|---|---|---|---|---|---|---|---|---|---|---|---|---|---|---|---|---|---|---|---|---|---|---|---|---|---|---|---|---|---|---|---|---|---|---|---|---|---|---|---|---|---|---|---|---|
|
TABLE 2-3 Electrogram Amplitude and Duration Characteristics in Normal Left Ventricles by Left Ventricular Sitea Number | ||||||||||||||||||||||||||||||||||||||||||||||||||||||||||||||||||||||||||||||||||||||||||||||||||||||||||||||||||||||||||||||||||||||||||||||||||||||||||||
|---|---|---|---|---|---|---|---|---|---|---|---|---|---|---|---|---|---|---|---|---|---|---|---|---|---|---|---|---|---|---|---|---|---|---|---|---|---|---|---|---|---|---|---|---|---|---|---|---|---|---|---|---|---|---|---|---|---|---|---|---|---|---|---|---|---|---|---|---|---|---|---|---|---|---|---|---|---|---|---|---|---|---|---|---|---|---|---|---|---|---|---|---|---|---|---|---|---|---|---|---|---|---|---|---|---|---|---|---|---|---|---|---|---|---|---|---|---|---|---|---|---|---|---|---|---|---|---|---|---|---|---|---|---|---|---|---|---|---|---|---|---|---|---|---|---|---|---|---|---|---|---|---|---|---|---|---|
| ||||||||||||||||||||||||||||||||||||||||||||||||||||||||||||||||||||||||||||||||||||||||||||||||||||||||||||||||||||||||||||||||||||||||||||||||||||||||||||
Our data had limitations. One was the use of a 1-cm interelectrode distance for recording our electrograms. We compared 5- and 10-mm interelectrode distances and found no difference in activation times. Thus, the use of a 5-mm interelectrode distance would not change the data. However, tighter (i.e., 1- to 2-mm) bipolar pairs might alter the results. Certainly, use of a 1-mm interelectrode distance between poles, each of which, having a small surface area, has demonstrated electrograms of different duration. However, local activation appears similar using the largest rapid deflection for measurement. A negative feature of using such tight electrodes is that reproducible placement at the same recording site is more difficult. Whether or not 1-mm recordings will provide more clinically useful information is not yet established. As noted above, use of different catheters and recording techniques will necessitate establishing new “normal” values for each technique. For the last decade we have used the electrical–anatomic mapping system (Carto System, Biosense,
Inc.) and have been able to routinely acquire 100 to 200 activation points in the left ventricle (Fig. 2-18) which are also spatially depicted and stored in three dimensions. The data were similar to our original findings but could distinguish in greater detail breakthrough sites and conduction abnormalities. The “normal” standards are available for this system (see preceding paragraphs), although this is more relevant to evaluation of electrogram amplitude, width, and configuration, not activation.
Inc.) and have been able to routinely acquire 100 to 200 activation points in the left ventricle (Fig. 2-18) which are also spatially depicted and stored in three dimensions. The data were similar to our original findings but could distinguish in greater detail breakthrough sites and conduction abnormalities. The “normal” standards are available for this system (see preceding paragraphs), although this is more relevant to evaluation of electrogram amplitude, width, and configuration, not activation.
Programmed Stimulation
Incremental pacing and the introduction of programmed single or multiple extrastimuli during sinus or paced rhythms are the tools of dynamic electrophysiology. The normal heart responds in a predictable fashion to those perturbations, which may be used to achieve the following:
Characterize the physiologic properties of the AVCS, atria, and ventricles.
Induce and analyze mechanisms of arrhythmias.
Evaluate both the effects of drug and electrical interventions on the function of the AVCS, atria, and ventricles and their efficacy in the treatment of arrhythmias.
Like hemodynamic catheterizations, electrophysiologic studies must be tailored to the individual patient.
Stimulation is usually carried out with the use of an isolated constant current source that delivers a rectangular impulse at a current strength that is twice-diastolic threshold. We chose this current strength because of its reproducibility and safety. Some investigators advocate the use of stimuli delivered at 5 and 10 mA, but the safety of this current strength, particularly when used with multiple extrastimuli, remains to be determined. This will be discussed subsequently in this chapter in the section entitled Safety of Ventricular Stimulation. Regardless of what current strength is used, the stimulation system must allow the precise determination of the current strength delivered. The amount of current used is crucial in evaluating sensitivity and specificity of induction of arrhythmias and, in particular, in evaluating pharmacologic effects and therapy. Threshold, the lowest current required for consistent capture, is determined in late diastole, and must be redetermined after the administration of any drug to assess the effect of that drug on excitability.
Stay updated, free articles. Join our Telegram channel

Full access? Get Clinical Tree


