, Philip J. Podrid2, Philip J. Podrid3 and Philip J. Podrid4
(1)
Harvard Medical School Cardiology Division, Department of Medicine, Massachusetts General Hospital, Boston, MA, USA
(2)
Boston University School of Medicine, Boston, USA
(3)
Harvard Medical School, Boston, MA, USA
(4)
Department of Medicine, VA Boston Healthcare System, West Roxbury Division, West Roxbury, MA, USA
Abstract
Two most frequent complaints of test takers for the electrocardiography (ECG) section of the board exam were that they did not have enough time and that they did not know the answer options (and therefore they ended up wasting a lot of time looking for the answers that they wanted on the answer options page!). Even if you get everything else on the board exam right, if you fail the ECG section, you still fail the boards. This is the most important part of your board exam. If you don’t know the answers, then move on and come back to it. You must KNOW how to diagnose the answers on the answer options list. We recommend that you practice coding a set of ECG’s in a timed session using the ABIM answer options list (There are typically 37 ECG’s in one 2-h session, that’s an average of 3.2 min/ECG). Pay special attention to the brief description of the patient. They contain invaluable clues to diagnoses.
You can find the answer option lists on the American Board of Internal Medicine (ABIM) official website, http://www.abim.org/, under the tab, “take the exam your complete guide,” then under the “Prepare for the Exam: Take the Tutorial” section, near the bottom is a pdf file called “Sample Cases – Electrocardiograms and Imaging Studies (pdf).” Pay extra attention to the last few pages, which explains the scoring of sample cases.
Abbreviations
AIVR
Accelerated idioventricular rhythm
AV
Atrioventricular
AVNRT
Atrioventricular nodal reentrant tachycardia
AVRT
Atrioventricular reentrant tachycardia
CNS
Central nervous system
ECG
Electrocardiogram
IVCD
Intraventricular conduction delay
LA
Left atrial
LAFB
Left anterior fascicular block
LBBB
Left bundle branch block
LGL
Lown-Ganong-Levine
LPFB
Left posterior fascicular block
LV
Left ventricle
LVH
Left ventricular hypertrophy
MI
Myocardial infarction
PVB
Premature ventricular beats
PVC
Premature ventricular complexes
RA
Right atrium
RBBB
Right bundle branch block
RV
Right ventricle
RVH
Right ventricular hypertrophy
VA
Ventriculoatrial
VPB
Ventricular premature beats
VPC
Ventricular premature complexes
VT
Ventricular tachycardia
WPW
Wolff-Parkinson-White
Introduction
Two most frequent complaints of test takers for the electrocardiography (ECG) section of the board exam were that they did not have enough time and that they did not know the answer options (and therefore they ended up wasting a lot of time looking for the answers that they wanted on the answer options page!). Even if you get everything else on the board exam right, if you fail the ECG section, you still fail the boards. This is the most important part of your board exam. If you don’t know the answers, then move on and come back to it. You must KNOW how to diagnose the answers on the answer options list. We recommend that you practice coding a set of ECG’s in a timed session using the ABIM answer options list (There are typically 37 ECG’s in one 2-h session, that’s an average of 3.2 min/ECG). Pay special attention to the brief description of the patient. They contain invaluable clues to diagnoses.
You can find the answer option lists on the American Board of Internal Medicine (ABIM) official website, http://www.abim.org/, under the tab, “take the exam your complete guide,” then under the “Prepare for the Exam: Take the Tutorial” section, near the bottom is a pdf file called “Sample Cases – Electrocardiograms and Imaging Studies (pdf).” Pay extra attention to the last few pages, which explains the scoring of sample cases.
Key feature descriptions as listed on the answer options list are in italic.
ECG’s Quick List
1.
Normal ECG
2.
LAFB and LPFB
3.
Low voltage
4.
QT interval
5.
Juvenile T waves
6.
Hyper and hypokalemia
7.
Acute subarachnoid bleed
8.
ST segment depression
9.
Pacemakers: normal atrial and ventricular pacing
10.
Pacemakers: normal biventricular pacing
11.
Pacemaker malfunction
12.
Left atrial abnormality
13.
Right atrial abnormality
14.
LVH
15.
RVH
16.
Biventricular hypertrophy
17.
Stages of acute MI
18.
Inferior and posterior acute MI
19.
Chronic MI
20.
Acute pericarditis
21.
Sinus node exit block and sinus pause
22.
First degree AV block
23.
Wenckebach block
24.
Mobitz type II block
25.
2:1 AV block
26.
Complete heart block with escape rhythms
27.
IVCD
28.
RBBB
29.
LBBB
30.
WPW and LGL
31.
Atrial fibrillation with WPW
32.
Sinus bradycardia, tachycardia and arrhythmia
33.
Premature atrial complexes
34.
Premature junctional complexes and bigenimy
35.
Atrial rhythm and atrial tachycardia
36.
Wandering atrial pacemaker and multifocal atrial tachycardia
37.
Atrial flutter
38.
Atrial fibrillation
39.
Junctional rhythms
40.
AVNRT
41.
Orthodromic AVRT
42.
Antidromic AVRT
43.
Premature ventricular complexes and ventricular parasystole
44.
AIVR
45.
Nonsustained monomorphic and polymorphic VT
46.
Sustained monomorphic VT
47.
Torsades de Pointes
48.
Ventricular fibrillation
49.
Rate-related aberrancy and Ashman’s Phenomenon
50.
Class I antiarrhythmic drug effect
51.
Digoxin effect and toxicity
52.
Ostium Primum Atrial Septal Defect
53.
Dextrocardia
54.
Acute Pulmonary Embolism
55.
Pericardial Tamponade
56.
Hypertrophic Cardiomyopathy
57.
Hypothermia
58.
Sick Sinus Syndrome
59.
Brugada Syndrome
Basics
A.
Normal electrocardiogram (ECG) is shown in Fig. 36-1
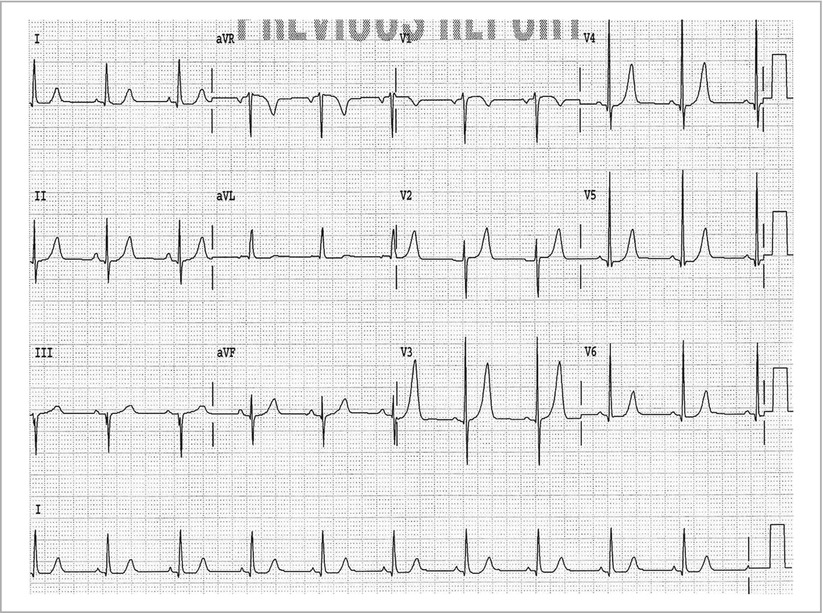
Figure 36-1
Normal ECG. Even if you have the correct diagnosis, do not forget to code the underlying rhythm such as sinus rhythm
P wave– Normal duration is ≤0.12 s; Amplitude is ≤0.25 mv (2.5 little boxes); Normal P wave (from sinus node) is upright (positive) in leads 1, 2, aVF, V4–V6; P wave is negative in aVR; P wave is often biphasic (positive–negative) in V1.
PR interval – Interval measured from beginning of P wave to first wave of QRS complex (Q or R wave); Includes P wave (atrial depolarization) and PR segment (conduction through atrioventricular [AV] node and His-Purkinje system); Normal is ≥0.14 s and ≤0.20 s. PR segment changes with rate- shortens with sinus tachycardia, lengthens with sinus bradycardia.
QRS complex – Duration is measured from beginning of QRS complex (Q or R wave) to end of QRS complex (J point); Normal QRS complex duration is between 0.06 and 0.10 s; QRS complex does not change with rate; Normal QRS complex is positive in leads 1, 2, aVF, and V4–V6 and negative in aVR; Small septal Q waves often seen in limb leads and lateral precordial leads.
ST segment – ST segment begins at J point and ends at onset of T wave; ST segment is slightly concave; J point and ST segment are usually isoelectric, which is established by the T-P segment.
QT interval – Interval measured from beginning of QRS complex (Q or R wave) to end of T wave; As QT interval includes QRS complex, need to correct for increased QRS complex duration; QT interval must also be corrected for rate (QTc), using Bazett’s formula; Normal QTc < 0.44 s.
T wave– Axis (direction) usually same as QRS complex; T wave is asymmetric (regardless of amplitude), upstroke slower than downstroke; Upstroke and downstroke of T waves are smooth.
U wave – Follows T wave; is not included in the QT interval measurement; U wave is normally seen in right precordial leads (V1-V3).
B.
QRS axis in frontal plane
Normal axis is 0° to +90° (QRS positive in 1, 2, aVF)
Physiologic left axis is 0° to −30° (QRS positive in 1, 2 and negative in aVF)
Pathologic left axis is −30° to −90° (QRS positive in 1 and negative in 2 and aVF with an rS complex and not Qr which is an inferior wall myocardial infarction [MI]); Called left anterior fascicular block (LAFB) (Fig. 36-2a)
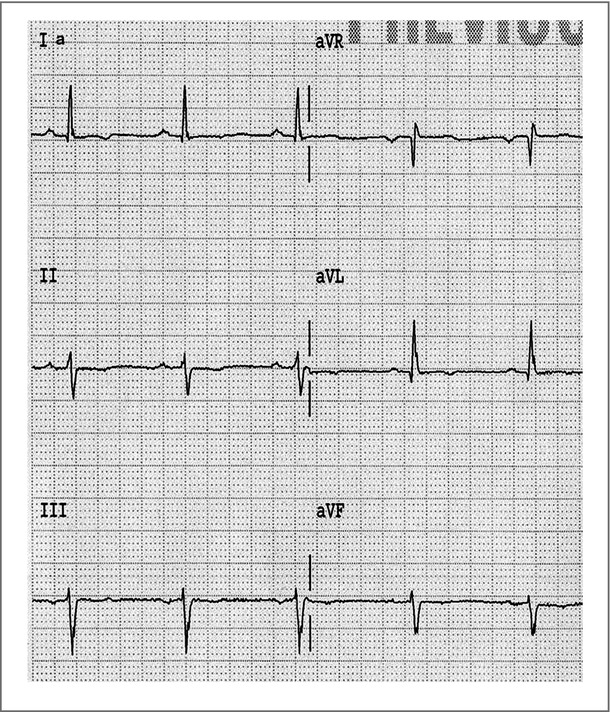
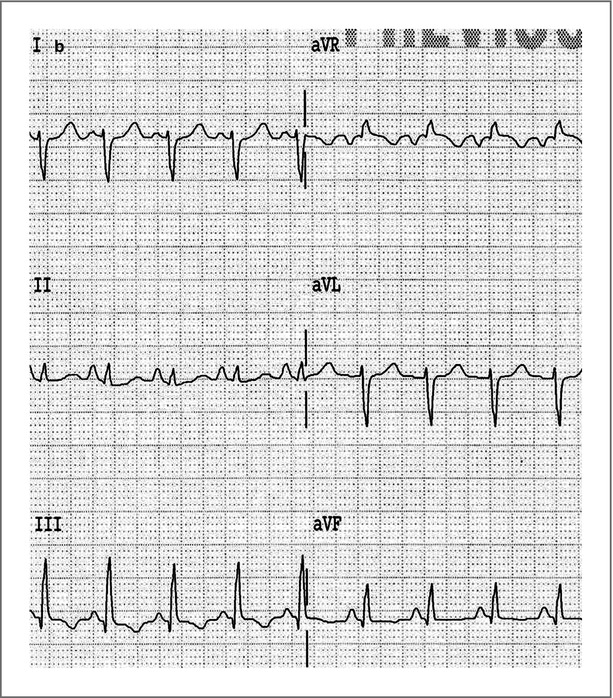
Figure 36-2
(a) Left anterior fascicular block, (b) Left posterior fascicular block
Right axis is ≥+90° (QRS negative in 1 and positive in aVF); is called a left posterior fascicular block (LPFB; Fig. 36-2b) when no other reason for right axis (lateral MI with Qr in leads I and aVL, RVH with tall R wave in V1, R → L arm lead switch with negative P wave and T wave in leads I and aVL, dextrocardia which resembles R → L arm lead switch and also includes reverse R wave progression V1–V6, Wolff-Parkinson-White with short PR interval and wide QRS complex due to delta wave).
C.
QRS complex
QRS duration does not change with rate.
QRS ≥ 0.10 s called intraventricular conduction delay (IVCD); if ≥0.12 s may be a bundle branch block (if specific bundle branch block pattern present). Nonspecific QRS complex widening >0.18 and <0.22 s seen with dilated cardiomyopathy. QRS complex width ≥0.24 s is diagnostic of hyperkalemia.
QRS complex duration may be prolonged if there is rate related aberration or Ashman’s phenomenon (see section “Aberration”).
Low QRS voltage or amplitude (recorded at normal standardization, i.e. 1 mV = 10 mm or small boxes in amplitude) is defined as QRS amplitude ≤5 mm in each limb lead and/or <10 mm in each precordial lead. It reflects reduced electrical activity recorded at the surface of the body (Fig. 36-3).
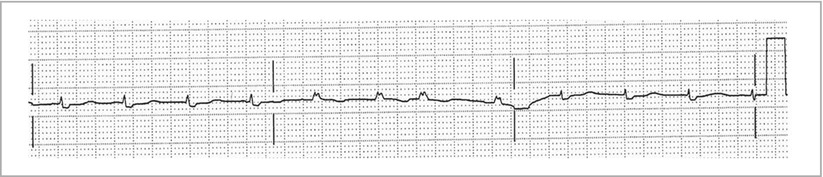
Figure 36-3
Low voltage will need to specify limb leads or precordial leads. Note the standardization indicator on the right
D.
QT interval
Prolonged QT interval (Fig. 36-4) may be due to:
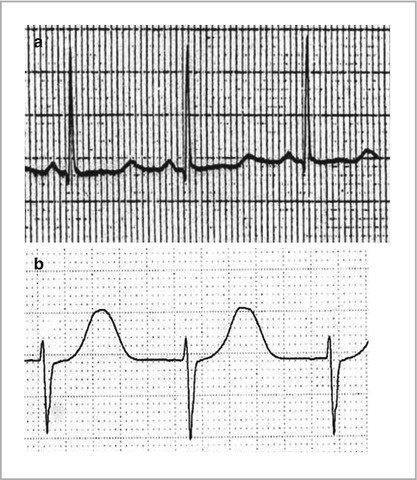
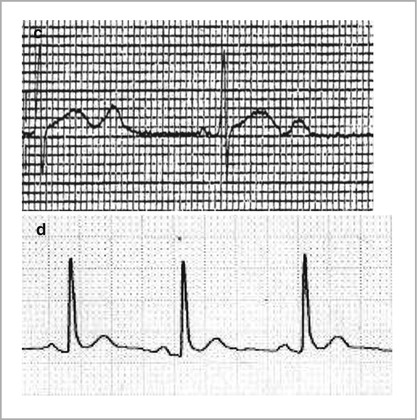
Figure 36-4
(a) Prolonged QT interval with long ST segment (ST and/or T wave abnormalities suggesting electrolyte disturbances) seen with Hypocalcemia, (b) Prolonged QT interval from medications, (c) Prolonged QT interval due to congenital long QT with QTu waves, (d) Short QT interval, in Hypercalcemia, the short QT interval is mainly due to a shortened ST-segment duration (ST and/or T wave abnormalities suggesting electrolyte disturbances)
Delayed repolarization, i.e. the ST segment is long while the T wave duration is normal. Seen with metabolic abnormalities, particularly low calcium (hypocalcemia) or low magnesium.
Prolonged repolarization, i.e. the ST segment is normal in duration but the T wave is broad. This is due to drugs (acquired QT prolongation) or a genetic abnormality producing a channelopathy (congenital long QT syndrome). Congenital QT prolongation may have a prominent U wave interrupting the T wave (QT-U wave).
Short QT interval (Fig. 36-4d) is due to metabolic abnormality (hypercalcemia, or high magnesium) or a congenital short QT syndrome
E.
T waves
Normal T waves are asymmetric (upstroke slower than downstroke) and smooth in upstroke and downstroke.
Young patients may have T wave inversions in leads V1–V3, which are normal and are termed juvenile T waves (Fig. 36-5).
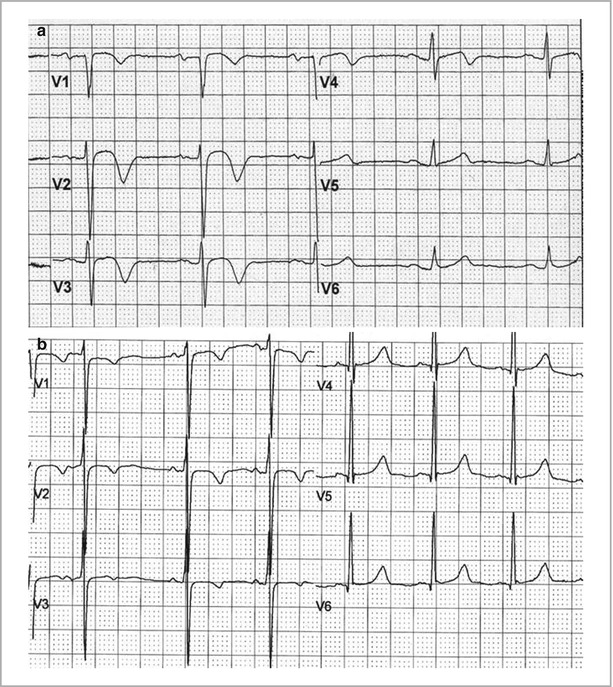
Figure 36-5
Normal variant, juvenile T waves. Two examples of Juvenile T wave patterns with T wave inversions in leads V1–V3
Tall, peaked and symmetric T waves (hyperacute T waves, see Fig. 36-17a) may be seen with acute MI or hyperkalemia. Hyperkalemic changes may also result in prolonged QRS (any QRS duration greater than 0.24 s is pathonomonic for hyperkalemia), atrial asystole (with sino-ventricular rhythm, Fig. 36-6). Hypokalemia changes are characterized by prominent U waves (Fig. 36-6c).
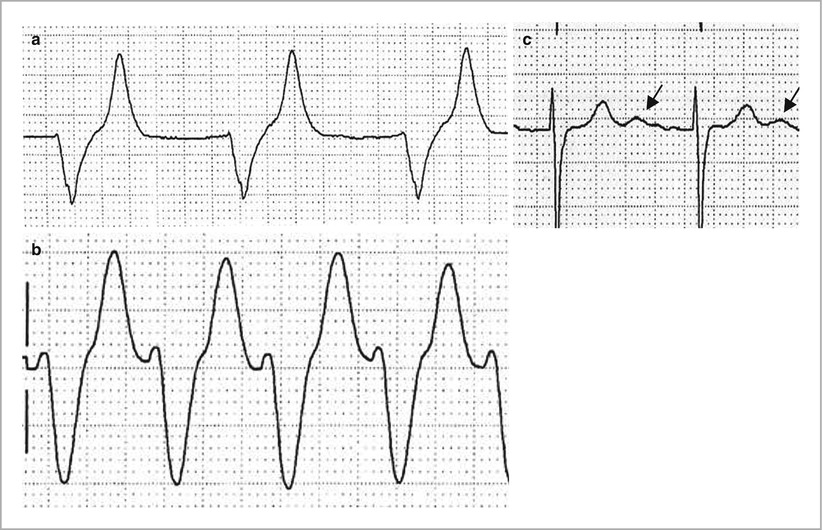
Figure 36-6
(a) Tall symmetric peaked T waves (ST and/or T wave abnormalities suggesting electrolyte disturbances) with prolonged QRS from Hyperkalemia, (b) QRS duration >0.24 s and ST and/or T wave abnormalities suggesting electrolyte disturbances (sinusoidal wave forms) diagnostic of Hyperkalemia, (c) Prominent U waves (arrows) of Hypokalemia
Deeply inverted asymmetric T waves (along with prolonged QT interval) may be seen with a central nervous system (CNS) disorder, such as subarachnoid hemorrhage or mass lesion (are termed cerebral T waves) (Fig. 36-7).
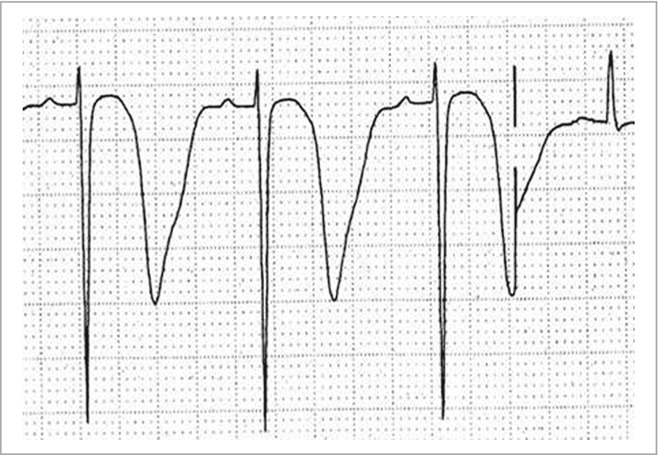
Figure 36-7
Deeply inverted T waves from an acute Central nervous system disorder, a subarachnoid bleed in this case
F.
ST segment changes
J point and ST segment elevation seen with early repolarization (normal or with left ventricular hypertrophy [LVH]), transmural ischemia, MI, or pericarditis (see section “Myocardial Infarction”).
J point and ST depression upsloping with tachycardia (due to alteration of J point by T wave of P wave, i.e. atrial repolarization, Fig. 36-8a) or horizontal or downsloping seen with subendocardial ischemia (LVH or coronary disease, Fig. 36-8b, c).
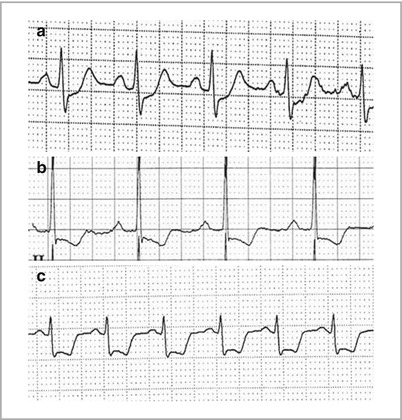
Figure 36-8
(a) Upsloping ST depressions of Sinus tachycardia and Nonspecific ST and/or T wave abnormalities (b) Downsloping and (c) Horizontal ST depressions (ST and T wave abnormalities suggesting myocardial ischemia)
Pacemakers
Single chamber (right atrium [RA] or right ventricle [RV]) or dual chamber pacemaker (RA and RV), see Fig. 36-9.
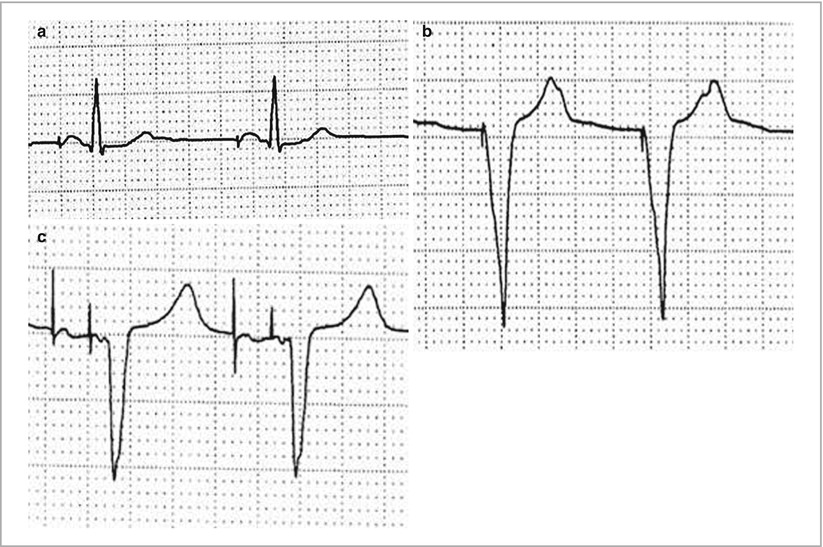
Figure 36-9
(a) Atrial pacing (Atrial or coronary sinus pacing), (b) Ventricular pacing (Ventricular demand pacemaker (VVI), normally functioning). Don’t forget to code the underlying rhythm, regardless of pacemaker status. (c) A-V sequential pacing (Dual-chamber pacemaker (DDD), normally functioning)
RV paced QRS complex has LBBB morphology (broad R wave in leads 1, V5, V6 and QS in lead V1)
Biventricular (RA, RV and left ventricle [LV]). Biventricular paced QRS is RBB-like (QS or initial Q wave in lead 1, V5, V6 and tall R wave V1; Fig. 36-10)
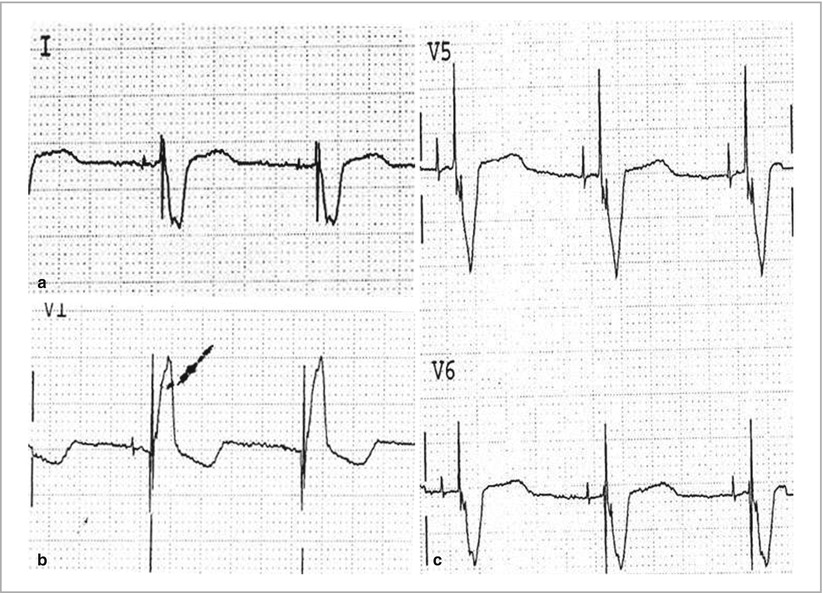
Figure 36-10
Paced morphology consistent with biventricular pacing or cardiac resynchronization therapy
Fixed rate (asynchronous) or demand mode
Atrial, ventricular, P wave synchronous, or AV sequential pacing
Failure of pacemaker sensing generally results in over pacing (atrial and/or ventricular stimuli despite P wave or QRS complex); Failure of myocardial capture is represented by pacemaker spikes with the absence of myocardial depolarization (P wave or QRS complex; Fig. 36-11)
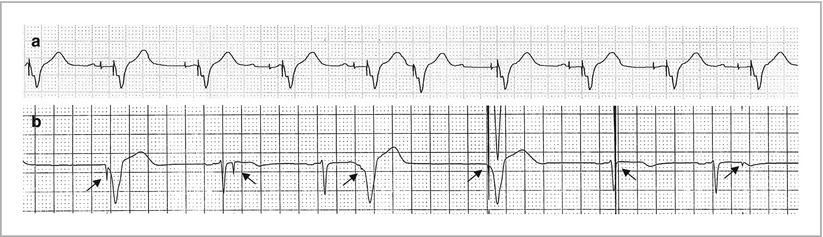
Figure 36-11
(a) Failure of atrial sensing and intermittent capture (b) Failure of ventricular sensing and intermittent capture. Arrows in (b) denote ventricular pacing spikes. Pacemaker malfunction, not constantly capturing (atrium or ventricle) and Pacemaker malfunction not constantly sensing (atrium or ventricle)
Hypertrophy
A.
Get Clinical Tree app for offline access
Left atrial hypertrophy/abnormality (Fig. 36-12)
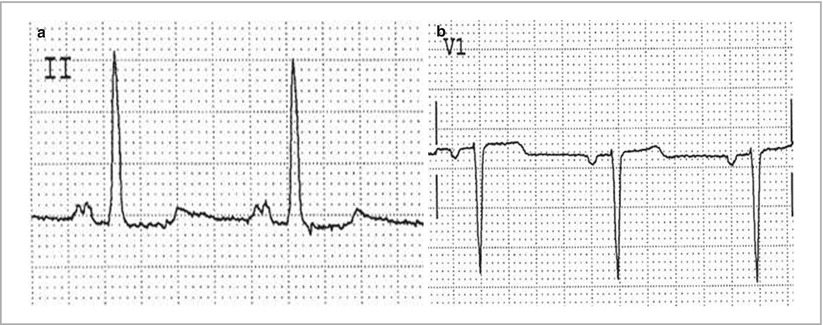


Figure 36-12
Left atrial hypertrophy/abnormality a is lead II and b is lead V1
< div class='tao-gold-member'>
Only gold members can continue reading. Log In or Register to continue
Stay updated, free articles. Join our Telegram channel
Full access? Get Clinical Tree
