Widening of the electrocardiographic (ECG) spatial QRS-T angle has been predictive of cardiovascular disease (CVD) events in the general population. However, its prognostic significance in human immunodeficiency virus (HIV)-infected patients remains unknown. The spatial QRS-T angle was derived from the baseline resting 12-lead electrocardiogram of 4,453 HIV-infected patients aged 43.5 ± 9.3 years from the Strategies for Management of Antiretroviral Therapy (SMART) trial. CVD events were identified during a median follow-up of 28.7 months. Quartiles of the spatial QRS-T angle was calculated for men and women separately, and values in the upper quartile were considered as a widened angle (values >74° for women and >93° for men). A multivariate Cox proportional hazards analysis was used to examine the association between a widened baseline spatial QRS-T angle and incident CVD events. During 11,965 person-years of follow-up, 152 CVD events occurred at a rate of 1.27 events/100 person-years. The rate of CVD events in those with a widened spatial QRS-T angle was almost double the rate in those with a normal spatial QRS-T angle (rate ratio 1.94, 95% confidence interval 1.40 to 2.69; p <0.001). In a model adjusted for study treatment arm, demographics, CVD risk factors, HIV characteristics, inflammatory markers, and other ECG abnormalities, a widened spatial QRS-T angle was associated with a >50% increased risk of CVD events compared to a normal spatial QRS-T angle (hazard ratio 1.53, 95% confidence interval 1.07 to 2.17; p = 0.02). No interaction was seen by SMART trial arm (p value for interaction = 0.37) or gender (p value for interaction = 0.84). In conclusion, a widened spatial QRS-T angle was independently predictive of CVD events in HIV-infected patients receiving antiretroviral therapy. This highlights the potential role of routine electrocardiography as a simple noninvasive CVD risk-screening tool in HIV-infected patients.
Developing a cost-effective strategy for the prevention and treatment of cardiovascular disease (CVD) in the human immunodeficiency virus (HIV)-infected population requires identifying simple noninvasive tools for screening and risk stratification. Accordingly, the resting 12-lead electrocardiogram can play an important role. We have previously shown that the presence of a major electrocardiographic (ECG) abnormality (defined as major ventricular conduction defects, major Q/QS, ST-T, major atrioventricular conduction abnormalities, left ventricular hypertrophy, atrial fibrillation/flutter, or major QT prolongation, as identified using the Minnesota ECG Code Classification) is a predicator of incident CVD events in HIV-infected patients. Nevertheless, ECG classification using Minnesota coding is better conducted at an ECG core laboratory; hence, searching for novel ECG predictors that could be used in clinical settings is warranted. Widening of the spatial QRS-T angle, defined as the angle between the mean QRS and T vector on the resting 12-lead electrocardiogram, has been a strong independent predictor of incident CVD and total mortality in the general population. With the widespread availability of automated ECG interpretation machines, a spatial QRS-T angle can be easily calculated and incorporated into the output measurements matrix. Whether the spatial QRS-T angle is predictive of CVD events in the HIV-infected population, in whom the virus and antiretroviral therapy (ART) might be additional risk factors, is currently unknown. We sought to examine the prognostic significance of the spatial QRS-T angle for the prediction of CVD events in HIV-infected patients enrolled in the Strategies for Management of Antiretroviral Therapy (SMART) trial. The study was registered with ClinicalTrials.gov (trial no. NCT00027352 ).
Methods
Detailed descriptions of the design and aims of the SMART trial have been previously published. In brief, the SMART study was an open-label, randomized trial comparing 2 antiretroviral treatment strategies. The viral suppression strategy, the control arm, was defined to be consistent with the guidelines for the use of antiretroviral agents in HIV-infected adults and adolescents. Thus, available antiretroviral regimens were to be used in an uninterrupted manner, with the goal of maximum and continuous suppression of HIV replication. The experimental drug conservation strategy entailed the episodic use of ART according to the CD4+ T-cell count thresholds. Thus, the use of ART was deferred until the CD4+ T-cell count had decreased to <250 cells/mm 3 , at which time ART was to be initiated (or reinitiated) and continued until the CD4+ T-cell count had increased to >350 cells/mm 3 . On January 10, 2006, the data and safety monitoring board recommended stopping enrollment in the SMART trial because of a safety risk in the experimental drug conservation group. After this change in protocol, all patients were advised to receive continuous ART and were followed up for an additional 1.5 years. The present analysis describes the findings through July 11, 2007.
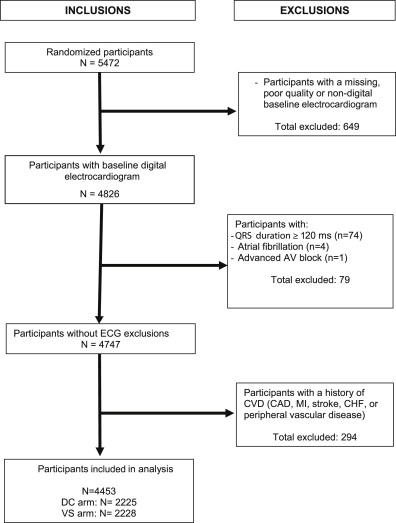
The SMART trial recruited those infected with HIV who were >13 years and were not pregnant or breast feeding. The participants were eligible for inclusion in the SMART study if their CD4+ T cell count was >350 cells/mm 3 , and they were willing to participate. All participants in the trial were considered eligible for the present analysis, except those with missing or poor quality ECG data, ECG conditions that interfered with calculation of the spatial QRS-T angle, and/or known CVD at baseline. After the exclusions, 4,453 participants were included in the present analysis ( Figure 1 ).
Before randomization (at baseline), an ART and medical history were obtained, the CD4+ T-cell count and plasma HIV RNA levels were measured. Follow-up visits were scheduled monthly for the first 2 months, every 2 months thereafter for the first year, and every 4 months in the second and subsequent years. At each visit, a history was taken, an examination was conducted, and the CD4+ T-cell count and plasma HIV RNA level were measured.
At the baseline visit and at each annual visit, a resting 12-lead electrocardiogram was obtained. A detailed description of the ECG recording in the SMART study has been previously published. In brief, identical ECG machines (GE MAC 1200 model, GE, Milwaukee, Wisconsin) were used at all the study clinical sites, and standard resting 12-lead electrocardiograms were recorded for all participants using strictly standardized procedures. The digital ECG signals stored in the ECG machines were transmitted regularly over analog telephone lines to the SMART ECG Reading Center, Epidemiological Cardiology Research Center (Wake Forest University School of Medicine, Winston-Salem, North Carolina) for analysis. The electrocardiograms were evaluated by readers who were unaware of the treatment group and ART use. After being visually checked for quality, the study electrocardiograms were automatically processed using the 2001 version of the GE Marquette 12-SL program. ECG abnormalities were classified using the Minnesota ECG Classification. The spatial QRS-T angle was defined as the angle between the mean QRS vector and T vector. The mean spatial QRS and T vectors were automatically calculated from quasiorthogonal X, Y, and Z leads reconstructed from the standard ECG leads using a matrix transformation method.
Using pre-established criteria, an independent end point review committee reviewed the major clinical events, including CVD events. The end point review committee classified the underlying cause of death using the Coding of Death in HIV Project classification system. A composite CVD outcome (incident myocardial infarction, coronary artery disease, congestive heart failure, peripheral vascular disease, stroke, sudden death, or CVD death) was used in the present analysis.
Quartiles of the spatial QRS-T angle were calculated for men and women separately, because of the reported gender differences in the distribution of the spatial QRS-T angle, and the participant characteristics were compared across these quartiles. The incidence rates of CVD events/100 person-years in each quartile and overall were calculated. Given the observed similar rates of CVD events in the lower 3 quartiles, these quartiles were combined into a single reference group and compared to the fourth quartile. Cox proportional hazard analysis was used to assess the risk of CVD events associated with the upper quartile QRS-T angle (referred to as a widened spatial QRS-T angle in the rest of the present report) versus the lower 3 quartiles combined (referred to as the normal QRS-T angle in the rest of present report). Five models were created: model 1, adjusted for the trial treatment groups; model 2, adjusted for the treatment group plus demographics (age, gender, and race/ethnicity); model 3, adjusted for model 2 covariates plus common CVD risk factors (i.e., smoking status, total and high-density lipoprotein cholesterol ratio, body mass index, diabetes, and blood pressure and lipid-lowering drugs), and HIV characteristics (i.e., interval since the HIV diagnosis, baseline CD4+ T-cell count, and plasma HIV RNA level/ART status); and model 4, adjusted for model 3 covariates plus inflammatory markers (interleukin-6 and high-sensitivity C-reactive protein), and the presence of any minor or major ECG abnormalities, as defined by the Minnesota ECG Code Classification and previous findings. The interaction with treatment group and gender was examined separately. In an additional analysis, we also used the spatial QRS-T angle in the models as a time-dependent variable to account for changes in the levels of the spatial QRS-T angle during the follow-up visit. The follow-up period was measured from baseline to the first CVD event, non-CVD death, loss to follow-up, or the end of the study on July 11, 2007. All reported p values are 2-sided, and P <0.05 was considered statistically significant. SAS, version 9.1 (SAS Institute, Cary, North Carolina) was used for all analyses.
Results
The present analysis included 4,453 SMART participants (46% nonwhites and 28% women), aged 43.5 ± 9.3 years at enrollment. The mean spatial QRS-T angle was 70.3° ± 29.1°. For the men, the mean angle was 74.53° and the 25th, 50th, and 75th percentile values were 54.95°, 73.35°, and 93.30°; for the women, the mean was 58.81° and the corresponding percentile cutpoints were 38.68°, 55.79°, and 74.06°. The baseline characteristics of the participants stratified by gender-specific quartiles of spatial QRS-T angle are listed in Table 1 . Across the spatial QRS-T angle quartiles, significant differences were seen in age, race/ethnicity, smoking status, high-density lipoprotein cholesterol, triglycerides, total/high-density lipoprotein cholesterol ratio, body mass index, diabetes, use of blood pressure-lowering drugs, proportion of participants with plasma HIV RNA ≤400 copies/ml, HIV-RNA level/ART status, and any major or minor ECG abnormalities (p <0.001, for all except smoking [p = 0.03] and triglycerides [p = 0.003]).
| Characteristic | Spatial QRS-T angle ∗ | p Value | |||
|---|---|---|---|---|---|
| Q1 (n = 1,113) | Q2 (n = 1,113) | Q3 (n = 1,113) | Q4 (n = 1,114) | ||
| Age (yrs) | 42.9 ± 9.5 | 42.9 ± 9.3 | 43.1 ± 9.1 | 44.8 ± 9.0 | <0.001 |
| Female gender | 318 (28.6%) | 318 (28.6%) | 318 (28.6%) | 318 (28.5%) | NA † |
| Race/ethnicity | <0.001 | ||||
| Black | 321 (28.8%) | 295 (26.5%) | 295 (26.5%) | 383 (34.4%) | |
| White | 554 (49.8%) | 628 (56.4%) | 640 (57.5%) | 590 (53.0%) | |
| Asian | 76 (6.8%) | 61 (5.5%) | 50 (4.5%) | 21 (1.9%) | |
| Other | 162 (14.6%) | 129 (11.6%) | 128 (11.5%) | 120 (10.8%) | |
| Smoker | 0.03 | ||||
| Current | 408 (36.7%) | 431 (38.7%) | 478 (42.9%) | 458 (41.1%) | |
| Former | 280 (25.2%) | 264 (23.7%) | 241 (21.7%) | 282 (25.3%) | |
| Never | 425 (38.2%) | 418 (37.6%) | 394 (35.4%) | 374 (33.6%) | |
| Total cholesterol (mg/dl) | 194.6 ± 44.4 | 196.1 ± 50.4 | 195.3 ± 47.0 | 196.8 ± 49.5 | 0.72 |
| Low-density lipoprotein cholesterol (mg/dl) | 114.0 ± 34.1 | 114.2 ± 35.0 | 114.6 ± 35.8 | 115.0 ± 36.4 | 0.90 |
| High-density lipoprotein cholesterol (mg/dl) | 44.7 ± 14.7 | 43.6 ± 14.4 | 43.1 ± 14.9 | 42.2 ± 14.9 | <0.001 |
| Triglycerides (mg/dl) | 203.2 ± 201.6 | 215.1 ± 218.3 | 213.3 ± 180.9 | 236.8 ± 260.9 | 0.003 |
| Total cholesterol/high-density lipoprotein ratio | 4.8 ± 2.2 | 5.0 ± 2.6 | 5.0 ± 2.4 | 5.2 ± 2.4 | <0.001 |
| Body mass index (kg/m 2 ) | 25.7 ± 5.1 | 25.7 ± 5.5 | 25.9 ± 5.5 | 26.5 ± 5.6 | <0.001 |
| Diabetes mellitus | 44 (4.0%) | 51 (4.6%) | 76 (6.8%) | 108 (9.7%) | <0.001 |
| Blood pressure-lowering drugs | 144 (12.9%) | 147 (13.2%) | 164 (14.7%) | 248 (22.3%) | <0.001 |
| Lipid-lowering drugs | 140 (12.6%) | 158 (14.2%) | 136 (12.2%) | 167 (15.0%) | 0.18 |
| CD4+ T cells (cells/mm 3 ) | 656.0 (242.6) | 657.3 (261.1) | 661.3 (256.3) | 656.5 (262.6) | 0.96 |
| Human immunodeficiency virus RNA (% ≤400 copies/ml) | 829 (74.6%) | 814 (73.5%) | 785 (70.7%) | 747 (67.4%) | <0.001 |
| Human immunodeficiency virus-RNA and antiretroviral therapy status | <0.001 | ||||
| No antiretroviral therapy | 161 (14.5%) | 171 (15.4%) | 197 (17.7%) | 190 (17.1%) | |
| Antiretroviral therapy, human immunodeficiency virus-RNA ≤400 | 144 (12.9%) | 146 (13.2%) | 149 (13.4%) | 200 (18.0%) | |
| Antiretroviral therapy, human immunodeficiency virus-RNA >400 | 807 (72.6%) | 793 (71.4%) | 765 (68.9%) | 720 (64.9%) | |
| High-sensitivity C-reactive protein (mg/L) | 3.6 (6.5) | 3.6 (6.5) | 3.7 (7.3) | 3.5 (5.7) | 0.99 |
| Interleukin-6 (pg/ml) | 2.9 (9.2) | 2.3 (3.4) | 2.8 (4.2) | 4.3 (47.0) | 0.28 |
| Electrocardiographic (ECG) abnormalities ‡ | 560 (50.3%) | 491 (44.1%) | 526 (47.3%) | 683 (61.3%) | <0.001 |
∗ Quartiles were calculated for women and men separately with values as follows: men, Q1 <54.94°, Q2 ≥54.94° but <73.35°, Q3 ≥73.35° but <93.30°, and Q4 ≥93.30°; women, Q1 <38.68°, Q2 ≥38.68° but <55.79°, Q3 ≥55.79° but <74.06°, and Q4 ≥74.06°.
† By design, women had similar numbers across quartiles.
‡ Defined as presence of minor or major ECG abnormalities using Minnesota ECG classification.
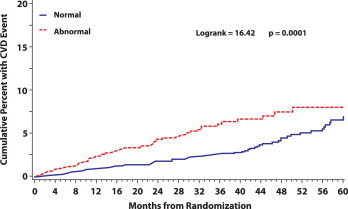
During 11,965 person-years of follow-up, 152 CVD events occurred at a rate of 1.27 events/100 person-years. The risk was increased about 11% with each 10° increase in the spatial QRS-T angle (p <0.001; Table 2 ). When the CVD events were examined across spatial QRS-T angle quartiles, the number of events was almost identical in the first 3 quartiles of spatial QRS-T angle (32 events in quartile 1 and 30 events in each of quartiles 2 and 3), with double that number (60 events) observed in quartile 4. The event rate ratio in the upper quartile (i.e., widened spatial QRS-T angle) versus the lower 3 quartiles combined (i.e., normal QRS-T angle) was 1.94 (95% confidence interval 1.40, 2.69; p <0.001; Table 2 ). Kaplan-Meier estimates of the cumulative percentage experiencing CVD for those with a widened versus normal spatial QRS-T angle are shown in Figure 2 . As shown, the risk of CVD associated with a widened spatial QRS-T angle persisted during the follow-up period (p >0.99 for proportional hazards).
| Spatial QRS-T angle | Participants (n) | Events (n) | Person-yrs (n) | Rate of Events/100 Person Yrs (95% CI) | Rate Ratio (95% CI) | p Value |
|---|---|---|---|---|---|---|
| Q1 (reference) ∗ | 1,113 | 32 | 2,910 | 1.10 (0.72–1.48) | 1.0 | — |
| Q2 | 1,113 | 30 | 3,012 | 1.00 (0.64–1.35) | 0.91 (0.55–1.49) | 0.70 |
| Q3 | 1,113 | 30 | 3,036 | 0.99 (0.63–1.34) | 0.90 (0.55–1.48) | 0.67 |
| Q4 | 1,114 | 60 | 3,006 | 2.00 (1.49–2.50) | 1.82 (1.18–2.79) | 0.006 |
| Q1–Q3 (reference) | 3,339 | 92 | 8,959 | 1.03 (0.82–1.24) | 1.0 | — |
| Q4 (widened QRS-T angle) | 1,114 | 60 | 3,006 | 2.00 (1.49–2.50) | 1.94 (1.40–2.69) | <0.001 |
| Total population | 4,453 | 152 | 11,965 | 1.27 (1.07–1.47) | 1.11 (1.05–1.17) † | <0.001 |
∗ Quartiles were calculated for women and men separately with values as follows: men, Q1 <54.94°, Q2 ≥54.94° but <73.35°, Q3 ≥73.35° but <93.30°, and Q4 ≥93.30°; women, Q1 <38.68°, Q2 ≥38.68° but <55.79°, Q3 ≥55.79° but <74.06°, and Q4 ≥74.06°.
The results of the multivariate-adjusted Cox proportional hazards models for the association between a widened baseline spatial QRS-T angle and incident CVD events are listed in Table 3 . As shown, the baseline widened spatial QRS-T angle (compared to normal) was associated with a significantly greater risk of CVD events across all models. This included the final model, which was adjusted for study treatment arm (experimental drug conservation vs viral suppression), demographics, CVD risk factors, HIV characteristics, inflammatory markers, and other ECG abnormalities (hazard ratio 1.53, 95% confidence interval 1.07 to 2.17; p = 0.02). Similar results were observed when the spatial QRS-T angle was used in the models as a time-dependent variable that accounted for changes in the QRS-T angle during the follow-up visits (hazard ratio 1.69, 95% confidence interval 1.19 to 2.40; p = 0.003). No significant interaction was seen by SMART treatment group (p value for interaction = 0.37) or by gender (p value = 0.84).


