Obstructive sleep apnea is prevalent and adversely affects cardiovascular health. However, little is known of the acute effects of an obstructive apnea on cardiovascular physiology. We hypothesized that pre-existing functional mitral regurgitation (MR) would worsen during performance of a Mueller maneuver (MM) used to simulate an obstructive apnea; 15 subjects with an ejection fraction ≤35% and pre-existing functional MR were studied with Doppler echocardiography. The radius of the proximal flow convergence was used as a measure of mitral regurgitant flow. Measurements were made at baseline, during the MM, and post-MM. Areas of all 4 chambers were also measured at these time points, both in systole and diastole. Mean flow convergence radius for the group decreased significantly during the transition from the late-MM to post-MM (0.65 → 0.57 mm, p = 0.001), implying increased MR during the MM. In addition, in 3 subjects, duration of MR increased during the MM. Right atrial (RA) areas, both systolic and diastolic, increased during the maneuver, whereas RA fractional area change decreased, indicating reduced RA emptying. Left ventricular emptying decreased early in the maneuver, probably because of the increased afterload burden, and then recovered. In conclusion, high negative intrathoracic pressure produces changes that, repeated hundreds of times per night in patients with obstructive sleep apnea, have the potential to worsen heart failure and predispose affected subjects to atrial fibrillation.
Obstructive sleep apnea (OSA) is highly prevalent in patients with systolic heart failure (HF) and is also strongly associated with atrial fibrillation (AF). However, mechanisms linking these conditions are unclear. The signature characteristic of an obstructive apnea is generation of high negative intrathoracic pressure that creates an afterload burden on the left ventricle. We hypothesized that this negative pressure could increase pre-existing functional mitral regurgitation (MR). If so, this would provide a potential mechanism by which OSA might worsen HF and promote development of AF.
Methods
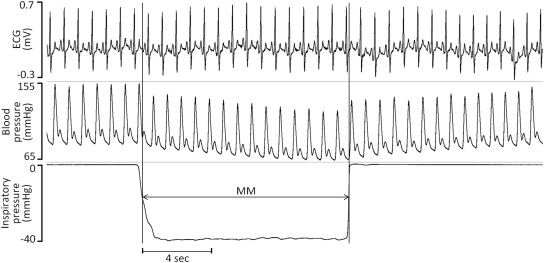
The Mueller maneuver (MM) was used as a surrogate for obstructive apnea. We studied 15 subjects with systolic dysfunction (ejection fraction [EF] ≤35%) and at least moderate functional MR. Anatomic valvular lesions were excluded. All subjects were clinically stable, and none had decompensated HF. Each was instructed in performance of the MM and coached through trial runs before making recordings. The MM was performed in the left lateral decubitus position with mouth pressure visually monitored by the subject to a target intrathoracic pressure of −40 mm Hg (−54.4 cm H 2 O, Figure 1 ). Subjects performed 12 MMs, each lasting 12 seconds, with each separated by a 3-minute rest period. Onset and offset of the MM were marked with a digital clock. Doppler echocardiographic images were acquired in the parasternal long-axis and apical views before, during, and after the MM.
For 2-dimensional measurements, the MM was divided into early and late phases. All digital loops of sufficient technical quality were analyzed. If some, but not all, measurements could be made on a particular loop, those measurements were included in the analyses. Area measurements were obtained in systole and diastole for each cardiac chamber and recorded as the average of 3 to 5 beats. For the left atrium (LA) and right atrium (RA), area at end-diastole (ED) provided a measure of minimal filling, whereas area at end-systole (ES) provided a measure of maximal filling. Atrial emptying was evaluated by the fractional area change (FAC): (ES – ED)/ES. For the left ventricle (LV) and right ventricle (RV) area at ED provided a measure of preload, whereas area at ES provided a measure of afterload. FAC of the ventricles [(ED − ES)/ED] was used to approximate EF. Left atrial dimension, tenting height, and tenting area were measured in the parasternal long-axis view in mid-systole. All measurements were made by an experienced echocardiographer (GSP) blinded to the phase of the MM.
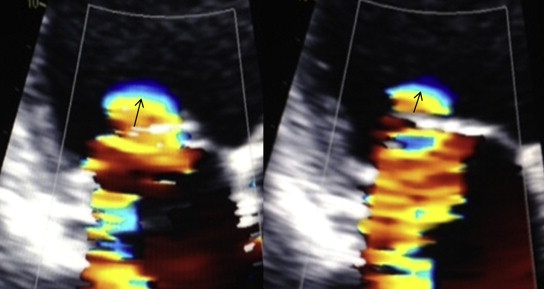
For Doppler measurements, the maneuver was divided into early, mid, and late phases. MR was assessed by color Doppler examination in an apical view with the velocity scale set to optimize the area of flow convergence (usually at or near 30 cm/s). The radius of flow convergence was used as an indicator of regurgitant flow. The number of frames during which a regurgitant jet was visualized served to estimate duration of MR. It was not possible to measure regurgitant volume or regurgitant orifice area as continuous wave Doppler and color Doppler cannot be recorded simultaneously during performance of the MM.
Data for continuous variables are presented as mean ± SD and categorical variables as counts and percentages. For each parameter, repeated-measures analysis of variance was tested for a time effect using Wilk’s lambda statistic. If absent, no time comparisons occurred; if present, a profile transformation compared neighboring means, with family-wise alpha protected at 0.05 level. Statistical analyses used SAS, version 9.0 (SAS Institute Inc., Cary, North Carolina).
Results
Age ranged from 31 to 76 years. There were 11 male subjects and 4 female subjects. Mean body mass index was 27.1 ± 3.6 kg/m 2 . The origin of LV dysfunction was ischemic in 4 and nonischemic in 11.
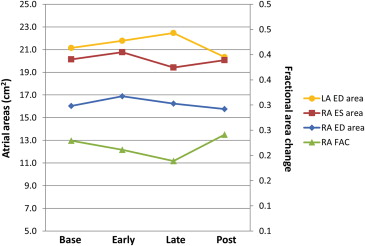
Parameters for which there were significant changes over time are displayed in Table 1 that includes a summary of those changes. Among these key parameters were RA ED and RA ES area. Comparing specific time points during the MM, RA ED area increased significantly from baseline to early MM; RA ES area also tended to increase at this time although the result was not statistically significant. Later in the MM, both values decreased, significantly so for the RA ES area. RA FAC decreased throughout the MM, recovering post-MM. The change was significant when comparing the early part of the maneuver with baseline ( Figure 2 ). Similarly, absolute change in RA area from systole (when RA area is largest) to diastole (when RA area is smallest) decreased throughout the MM and increased post-MM. When examining LA areas, significant changes over time were found for LA ED area. Comparing specific time points during the MM, we observed a significant decrease from late-MM to post-MM. We did not observe any consistent changes over time for LA ES area or LA FAC.
| Baseline-Early | Early-Late | Late-Post | |
|---|---|---|---|
| RA ED area (cm 2 ) | 1.5±1.4 p=0.002 | -0.65±2.385 p=0.347 | -0.80±3.37 p=0.410 |
| RA ES area (cm 2 ) | 0.9±2.1 p=0.138 | -1.35±1.134 p=0.001 | +0.62±3.16 p=0.492 |
| RA FAC | -.04±.054 p=0.028 | 0.02±0.120 p=0.509 | 0.07±0.131 p=0.084 |
| LA ED area (cm 2 ) | 0.5±1.5 p=0.248 | 0.68±1.986 p=0.223 | -2.05±2.25 p=0.005 |
| LV ED area (cm 2 ) | -1.1±4.5 p=0.406 | 2.02±3.598 p=0.006 | -1.49±5.02, p=0.434 |
| LV FAC | -.05±.32 p=0.0003 | 0.02±0.058 p=0.0006 | 0.01±0.047 p=0.741 |
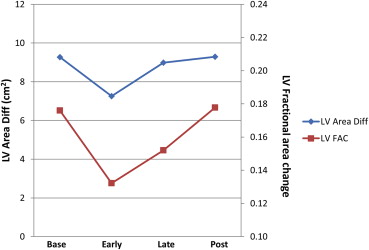
RV areas did not change significantly during the MM. In contrast, LV ED area did with a significant increase late in the MM. LV FAC decreased from baseline to early in the MM, recovering late in the MM (both comparisons significant, Figure 3 ). Similar changes were seen for absolute changes in LV area. Tent height and area increased slightly during the MM, declining post-MM, but the changes were not significant.
All subjects had an easily detected region of flow convergence in early systole; many also had flow convergence in late systole although this proved harder to measure. The most interesting results involved the radius of flow convergence in early systole, with significant changes noted over time (p = 0.0008). Although there was a nonsignificant increase from baseline during the MM, there was a marked decrease during the transition from late-MM to post-MM (0.68 → 0.57 mm, p <0.0001, Figures 4 and 5 ). This decrease was seen in nearly all subjects. The flow convergence radius in late systole showed a numeric increase during the MM, with a decrease afterward, but these findings were not significant. No consistent effect on duration of MR was noted as many had holosystolic regurgitation at baseline; however, in 3 subjects, duration was seen to increase substantially during the MM.