Effects of exercise rehabilitation on electrocardiographic markers of risk for sudden cardiac death have not been adequately studied. We examined effects of controlled exercise training on T-wave alternans (TWA) in 24-hour ambulatory electrocardiogram recordings in patients with stable coronary artery disease (CAD) without and with type 2 diabetes mellitus (DM). Consecutive patients with angiographically confirmed CAD were recruited to join the ARTEMIS (Innovation to Reduce Cardiovascular Complications of Diabetes at the Intersection) study. Exercise (n = 65) and control groups (n = 65) were matched on age, sex, DM, and previous myocardial infarction. Ambulatory electrocardiograms were recorded before and after a 2-year training period. TWA was assessed using time domain–modified moving average method by an investigator blinded to patients’ clinical status. Average TWA values decreased in the rehabilitation group but not in control patients (rehabilitation [mean ± SEM]: 52.8 ± 1.7 μV vs 48.7 ± 1.5 μV, p <0.001; control: 53.7 ± 1.7 μV vs 54.3 ± 1.6 μV, p = 0.746). Changes in TWA differed between the groups (rehabilitation: −4.1 ± 1.2 μV vs controls: +0.6 ± 1.1 μV, p = 0.005). In CAD + DM patients, 50% (n = 9) of the 18 positive TWA cases were converted with exercise versus 10% (n = 2 of 20) of controls (p = 0.020). In CAD patients, 30% (n = 8 of 27) of positive TWA cases were converted with exercise versus 4% (n = 1 of 28) of controls (p = 0.012). In conclusion, this is the first report of the effectiveness of exercise rehabilitation to reduce TWA, a marker of sudden cardiac death risk, in patients with stable CAD.
Highlights
- •
First study to report reduction in T-wave alternans by exercise rehabilitation.
- •
Heart rate recovery data suggest an autonomic basis for the reduction in TWA.
- •
TWA can be visualized in templates as a separation between beats in the JT segment.
No reports have been published on patients with coronary artery disease (CAD) demonstrating the impact of exercise training on the widely established measure of repolarization abnormality, microvolt T-wave alternans (TWA), a beat-to-beat fluctuation in the ST-T-wave segment. TWA has been evaluated in studies enrolling >12,000 patients and has proved to be a reliable predictor of cardiovascular mortality including sudden cardiac death (SCD) with established cut-points for risk. This parameter is amenable to assessment on ambulatory electrocardiograms (AECGs) using the time domain–modified moving average (MMA) method. AECG-based TWA has been found to be a useful predictor of cardiac events in patients with diverse ischemic and nonischemic pathologies including acute coronary syndrome. Given this body of evidence supporting TWA as a marker of SCD risk, we examined the effects of controlled exercise-based cardiac rehabilitation on the magnitude of TWA in AECGs of CAD patients with and without type 2 diabetes mellitus (DM).
Methods
This investigation is a subanalysis of the ARTEMIS (Innovation to Reduce Cardiovascular Complications of Diabetes at the Intersection) study, which was initiated at Oulu University Hospital’s Division of Cardiology in 2007. Diabetic (type 2 DM) and nondiabetic patients with angiographically confirmed CAD were recruited from consecutive patients referred for coronary angiography at Oulu University Hospital. Those willing and suitable to take part in the ARTEMIS exercise study were randomized into rehabilitation and control groups. Patients with advanced age (>75 years), body mass index >40 kg/m 2 , New York Heart Association class III or IV heart failure, left ventricular ejection fraction <40%, scheduled cardiac revascularization, unstable angina pectoris, severe peripheral atherosclerosis, diabetic retinopathy or neuropathy, or other inability to perform home-based exercise were excluded from the study. A total of 224 suitable patients were willing to participate in the exercise trial. Of these, 113 patients (51 CAD patients and 62 patients with CAD + DM) were randomized into the exercise rehabilitation group, and the remaining 111 patients were assigned to the control group. Patients who were not able to continue the exercise program or who dropped out of the study and those with missing data were excluded from analysis. Patients with bundle branch block or atrial fibrillation were excluded because these conditions can potentially disrupt the measurement of TWA. In total, 30 diabetic patients with CAD, 35 CAD patients without DM, and 65 matched controls (1:1 match in terms of age, sex, DM, previous myocardial infarction (MI), body mass index, and functional capacity in terms of maximum METs) were chosen for this evaluation of the effects of controlled exercise rehabilitation on TWA.
The study was performed according to the Declaration of Helsinki. The local committee of research ethics of the Northern Ostrobothnia Hospital District approved the protocol. Written informed consent was obtained from all patients.
The controlled exercise program consisted of home-based endurance training (30 minutes) and strength training (30 minutes). During the first 3 months, the program comprised 4 heart rate–controlled exercise sessions per week: 1 strength and 3 endurance training sessions. The intensity of the endurance training was set at 50% to 60% of heart rate reserve and was monitored with a heart rate recorder (Polar F1; Polar Electro, Kempele, Finland). After 3 months, the exercise program continued progressively so that during the last 6 months, it comprised 6 exercise sessions per week: 1 strength and five 40-minute endurance training sessions. Two of the endurance training sessions were at 50% to 60% and 2 at 60% to 70% intensity level, and the fifth session was an interval training session at 70% to 80% intensity level. These protocols constituted a relatively mild exercise rehabilitation regime. Weekly training and target loads were calculated as the mean training impulse, as described previously. All patients were included in analysis regardless of realized training impulse values.
Twenty-four-hour AECG recordings were obtained from the patients before and after the 2-year exercise rehabilitation program using a Medilog AR12 recorder (Medilog, Huntleigh Healthcare, Austria). TWA was analyzed by an investigator blinded to group assignment using the MMA method (GE Healthcare, Milwaukee, WI) throughout the recording. The MMA method employs the noise-rejection principle of recursive averaging. The algorithm continuously streams odd and even beats into separate bins and creates averaged complexes for each bin. These complexes are then superimposed, and the maximum difference between the odd and even complexes at any point within the JT segment is identified for every 15 seconds and reported as the TWA value. The highest TWA levels within the entire 24-hour period were taken to represent each patient and were used for analysis of the effects of exercise rehabilitation. The established TWA cut-point of 47 μV indicated a positive TWA test.
Symptom-limited exercise tests were performed before and after the 2-year exercise rehabilitation program using a bicycle ergometer (Monark Ergomedic 839 E; Monark Exercise AB, Vansbro, Sweden). The Mason-Likar modification with 2 additional leads was used in the 12-lead electrocardiographic recording. The exercise protocol consisted of an initial workload of 30 W with a gradual increase of load in steps of 10 and 15 W/min, for women and men, respectively. Testing was continued until voluntary exhaustion or ST-segment depression exceeding 0.2 mV. The values for heart rate recovery (HRR) were defined as the reduction in heart rate from peak exercise to 2, 5, and 10 minutes after cessation of exercise.
Distribution of the data was assessed with Kolmogorov-Smirnov Z test. All variables were normally distributed. The effects of exercise-based cardiac rehabilitation were analyzed with 2-way repeated-measures analysis of variance. Post hoc comparisons were made using paired t -test to compare means between baseline and follow-up values within each group and using t test for independent samples to analyze between-group comparisons at baseline and follow-up stages. Distributions of categorical variables were compared with Fisher’s exact test. Continuous, equally distributed values are reported as means ± SEM. The data were analyzed using the SPSS, version 21 (IBM SPSS Statistics, Armonk, NY). All tests were 2 sided, and p <0.05 was considered statistically significant.
Results
The final patient population consisted of 130 patients: 65 patients took part in the 2-year exercise program (30 CAD + DM and 35 CAD patients) and 65 matched patients participated as controls. The characteristics of these patients are listed in Table 1 . No cardiovascular deaths occurred although 4 patients in the rehabilitation group (CAD + DM) along with 6 control patients (5 CAD + DM and 1 CAD) had a non–ST-segment elevation MI during the follow-up period. Two of the 4 CAD + DM rehabilitation group patients converted from TWA positive to TWA negative despite non–ST-segment elevation MI, whereas other patients’ TWA status remained the same. No patients underwent coronary artery bypass graft surgery during follow-up, but 8 patients underwent percutaneous coronary intervention. Of these, 2 patients were in the CAD + DM rehabilitation group and 6 patients in the control group (5 CAD + DM and 1 CAD), but their TWA test results did not change during follow-up. There were no major changes in medical therapy.
| Variable | CAD With Diabetes | p-Value | CAD Without Diabetes | p-Value | |||||||
|---|---|---|---|---|---|---|---|---|---|---|---|
| Rehab (n = 30) | Control (n = 30) | Rehab (n = 35) | Control (n = 35) | ||||||||
| Mean | SEM | Mean | SEM | Mean | SEM | Mean | SEM | ||||
| Age (years) | 61.7 | 1.0 | 61.0 | 1.4 | 0.482 | 61.3 | 0.9 | 60.7 | 1.0 | 0.502 | |
| Height (cm) | 169.0 | 1.5 | 171.2 | 1.8 | 0.383 | 170.4 | 1.6 | 171.3 | 1.2 | 0.769 | |
| Weight (kg) | Pre | 85.2 | 2.6 | 86.9 | 3.2 | 0.801 | 77.1 | 2.2 | 79.4 | 2.1 | 0.438 |
| Post | 83.4* | 2.7 | 88.4* | 3.4 | 0.256 | 78.0 | 2.5 | 79.5 | 2.0 | 0.636 | |
| Body mass index (kg/m 2 ) | Pre | 29.8 | 0.8 | 29.3 | 0.7 | 0.673 | 26.4 | 0.5 | 27.1 | 0.5 | 0.408 |
| Post | 29.3* | 0.8 | 29.9* | 0.8 | 0.572 | 26.9 | 0.9 | 27.2 | 0.5 | 0.842 | |
| Waist (cm) | Pre | 102.0 | 1.9 | 101.2 | 2.4 | 0.711 | 92.9 | 2.3 | 94.1 | 1.9 | 0.407 |
| Post | 102.4 | 2.2 | 105.3* | 2.6 | 0.407 | 94.5 | 2.2 | 95.0 | 2.1 | 0.876 | |
| Hip (cm) | Pre | 102.0 | 1.5 | 102.5 | 1.7 | 0.744 | 96.0 | 1.4 | 99.7 | 1.0 | 0.037 |
| Post | 103.5* | 1.6 | 105.3* | 2.6 | 0.363 | 99.9 | 1.7 | 99.7 | 1.1 | 0.949 | |
| Systolic blood pressure (supine) (mm Hg) | Pre | 150.5 | 3.4 | 141.7 | 3.9 | 0.102 | 141.4 | 3.7 | 146.0 | 4.2 | 0.511 |
| Post | 146.7 | 4.0 | 136.9 | 3.4 | 0.062 | 144.2 | 4.0 | 142.2 | 4.4 | 0.732 | |
| Diastolic blood pressure (supine) (mm Hg) | Pre | 81.3 | 2.1 | 78.6 | 2.2 | 0.371 | 78.1 | 1.7 | 77.5 | 1.4 | 0.769 |
| Post | 76.4* | 1.4 | 74.2* | 2.2 | 0.418 | 77.0 | 2.0 | 76.7 | 2.1 | 0.912 | |
| Glycated hemoglobin (%) | Pre | 6.6 | 0.2 | 7.4 | 0.3 | 0.014 | 5.9 | 0.1 | 6.0 | 0.1 | 0.252 |
| Post | 6.5 | 0.2 | 6.9* | 0.2 | 0.104 | 5.8 | 0.1 | 5.7* | 0.1 | 0.224 | |
| LVEF (%) | Pre | 66.2 | 1.7 | 65.5 | 1.6 | 0.644 | 66.6 | 1.3 | 64.8 | 1.5 | 0.499 |
| Post | 64.3 | 1.7 | 65.6 | 1.5 | 0.574 | 67.2 | 1.3 | 63.2 | 1.5 | 0.057 | |
| N | % | N | % | p-Value | N | % | n | % | p-Value | ||
|---|---|---|---|---|---|---|---|---|---|---|---|
| Male | 22 | 73 | 22 | 73 | 1.000 | 25 | 71 | 25 | 71 | 1.000 | |
| Non-smoker | 28 | 93 | 29 | 97 | 0.389 | 32 | 91 | 31 | 89 | 0.915 | |
| β-blocker use | 30 | 100 | 27 | 90 | 0.076 | 28 | 80 | 32 | 91 | 0.172 | |
| ACE/AT2 use | 21 | 70 | 22 | 73 | 0.774 | 14 | 40 | 18 | 51 | 0.337 | |
| Lipid-lowering agent use | 28 | 93 | 27 | 90 | 0.640 | 33 | 94 | 31 | 89 | 0.393 | |
| Aspirin use | 30 | 100 | 28 | 93 | 0.150 | 34 | 97 | 34 | 97 | 1.000 | |
| Calcium antagonist use | 8 | 27 | 6 | 20 | 0.542 | 3 | 9 | 4 | 11 | 0.690 | |
| Nitroglycerin use | 14 | 47 | 8 | 27 | 0.108 | 3 | 9 | 9 | 26 | 0.057 | |
| Diuretics use | 14 | 47 | 11 | 37 | 0.432 | 6 | 17 | 6 | 17 | 1.000 | |
| Antidepressant use | 1 | 3 | 3 | 10 | 0.301 | 2 | 6 | 1 | 3 | 0.555 | |
| Left ventricular hypertrophy | 1 | 3 | 1 | 3 | 1.000 | 3 | 9 | 4 | 11 | 0.690 | |
| Previous MI | 12 | 40 | 12 | 40 | 1.000 | 14 | 40 | 14 | 40 | 1.000 | |
| STEMI | 4 | 13 | 4 | 13 | 1.000 | 4 | 11 | 4 | 11 | 1.000 | |
| NSTEMI | 8 | 27 | 8 | 27 | 1.000 | 11 | 31 | 11 | 31 | 1.000 |
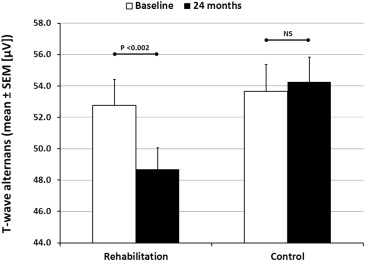
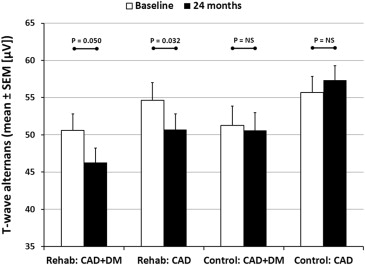
Exercise rehabilitation had a small but significant impact on the average TWA values (p = 0.005), whereas no change in TWA values was observed in the control group ( Figure 1 ). The change in average TWA values also differed significantly between the groups (rehabilitation: −4.1 ± 1.2 μV vs controls: +0.6 ± 1.1 μV, p = 0.005). However, DM did not have an effect on the reduction in TWA (p = 0.408), which was similar between the CAD and CAD + DM rehabilitation groups ( Figure 2 ).


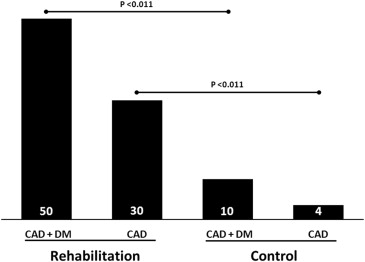
There was no significant difference in the number of positive TWA cases between the rehabilitation and control groups at baseline (p = 0.560): 45 (69%) versus 48 (74%), respectively. In 17 of 45 (38%) positive TWA cases, the test became negative (<47 μV) after the exercise program, whereas only 3 of 48 (6%) positive TWA cases in the control group became negative during follow-up (p <0.001). In the CAD + DM rehabilitation group, 50% of the positive TWA cases (n = 9 of 18) were converted with exercise versus 10% of positive TWA cases in the control group (n = 2 of 20) (p <0.011) ( Figure 3 ). Figure 4 illustrates the decrease in TWA level achieved with exercise in a representative patient with CAD + DM. In the CAD rehabilitation group, 30% of positive TWA cases (n = 8 of 24) were converted versus 4% of positive TWA cases (n = 1 of 28) in the control group (p = 0.011). Unfortunately, not all the patients showed benefit from rehabilitation in terms of TWA levels as tests in 2 (1 CAD + DM and 1 CAD) patients in the rehabilitation group were converted from negative to positive during the follow-up. Similarly 4 (1 CAD + DM and 3 CAD) control patients were converted from negative to positive during the follow-up. On average, their TWA levels increased by 10.0 ± 0.7 μV versus 9.0 ± 2.3 μV, respectively.


Stay updated, free articles. Join our Telegram channel

Full access? Get Clinical Tree


