Anticoagulation has been shown to decrease ischemic stroke in atrial fibrillation (AF). However, concerns remain regarding their safety and efficacy in those ≥70 years of age who constitute most patients with AF. Of the 4,060 patients (mean age 65 years, range 49 to 80) in the Atrial Fibrillation Follow-up Investigation of Rhythm Management (AFFIRM) trial, 2,248 (55% of 4,060) were 70 to 80 years of age, 1,901 of whom were receiving warfarin. Propensity score for warfarin use, estimated for each of the 2,248 patients, was used to match 227 of the 347 patients not on warfarin (in 1:1, 1:2, or 1:3 sets) to 616 patients on warfarin who were balanced in 45 baseline characteristics. All-cause mortality occurred in 18% and 33% of matched patients receiving and not receiving warfarin, respectively, during up to 6 years (mean 3.4) of follow-up (hazard ratio [HR] when warfarin use was compared to its nonuse 0.58, 95% confidence interval [CI] 0.43 to 0.77, p <0.001). All-cause hospitalization occurred in 64% and 67% of matched patients receiving and not receiving warfarin, respectively (HR associated with warfarin use 0.93, 95% CI 0.77 to 1.12, p = 0.423). Ischemic stroke occurred in 4% and 8% of matched patients receiving and not receiving warfarin, respectively (HR associated with warfarin use 0.57, 95% CI 0.31 to 1.04, p = 0.068). Major bleeding occurred in 7% and 10% of matched patients receiving and not receiving warfarin, respectively (HR associated with warfarin use 0.73, 95% CI 0.44 to 1.22, p = 0.229). In conclusion, warfarin use was associated with decreased mortality in septuagenarian patients with AF but had no association with hospitalization or major bleeding.
Anticoagulation has been shown to decrease the risk of ischemic stroke in older adults with atrial fibrillation (AF). Although most high-risk patients with AF are older than 70 years of age, the safety and efficacy of warfarin in these patients remain unclear. In addition, there are sparse data on the effect of long-term anticoagulation on mortality in these patients. Therefore, we conducted a propensity-matched study of the association of warfarin and outcomes in older adults with AF.
Methods
We analyzed a public-use copy of the Atrial Fibrillation Follow-up Investigation of Rhythm Management (AFFIRM) data obtained from the National Heart, Lung, and Blood Institute. The design and primary results of AFFIRM have been previously published. Briefly, AFFIRM was a multicenter randomized clinical trial for rate versus rhythm control treatment strategies for AF conducted in 213 centers in the United States and Canada. Patients with recurrent AF without contraindication to anticoagulant therapy (as determined by their physicians) and with high risk for stroke were recruited. Because age was considered a risk factor for stroke in AF, those ≥65 years of age could be enrolled regardless of other risk factors. However, to be eligible for enrollment, those <65 years were required to have ≥1 other risk factor for stroke, which included previous stroke or transient ischemic attacks, hypertension, heart failure, diabetes mellitus, increased left atrial enlargement, and left ventricular systolic dysfunction. AFFIRM participants had a mean age of 65 years (range 49 to 80) and 76% of patients (3,091 of 4,060) were ≥65 years of age.
The present analysis was restricted to 2,248 patients (55% of 4,060) who were 70 to 80 years of age. We chose a cutoff of 70 years because of the high prevalence of AF in this age group. Of the 2,248 patients, 1,901 (85%) were receiving warfarin, with a goal International Normalized Ratio from 2.0 to 3.0. Patients were followed up for up to 6 years (mean follow-up time 3.4 years) with interval follow-up visits every 4 months. All outcomes were blindly adjudicated by the AFFIRM events committee. The primary outcome for the present analysis was all-cause mortality. Secondary outcomes included all-cause hospitalization, ischemic stroke, and major bleeding defined as bleeding requiring transfusion and/or surgery and/or permanent cessation of warfarin.
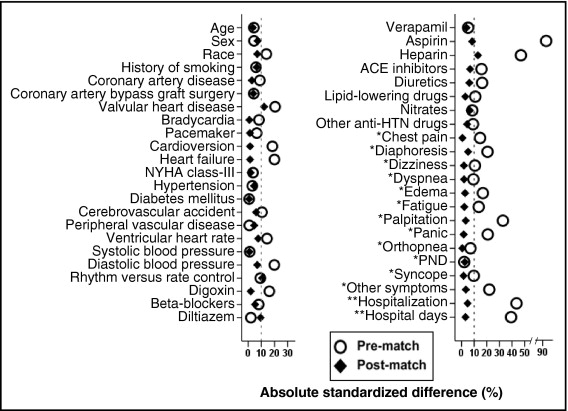
Considering the significant imbalances in baseline characteristics between the 2 groups ( Table 1 ), we used propensity scores to assemble a matched cohort. Propensity scores for warfarin use were estimated for each of the 2,248 patients using a nonparsimonious multivariable logistic regression model. We were able to match 227 of the 347 patients not receiving warfarin to 616 patients receiving warfarin using a greedy algorithm to match those on warfarin to sets of 1, 2, or 3 patients not receiving warfarin with similar propensity scores. The matched cohort of 843 patients was well balanced between warfarin recipients and nonrecipients on the 45 baseline characteristics used in the propensity score model. Absolute standardized differences were estimated to evaluate the imbalance before matching and balance after matching and are presented in a Love plot ( Figure 1 ) . Absolute standardized differences directly quantify biases in means (or proportions) of covariates across groups and are expressed as percent pooled SDs. An absolute standardized difference of 0% indicates no residual bias and differences <10% are considered inconsequential.
| Before Matching | After Matching | |||||
|---|---|---|---|---|---|---|
| No Warfarin | Warfarin | p Value | No Warfarin | Warfarin | p Value | |
| (n = 347) | (n = 1,901) | (n = 227) | (n = 616) | |||
| Age (years) | 76 ± 3 | 75 ± 3 | 0.458 | 76 ± 3 | 76 ± 3 | 0.655 |
| Women | 164 (47%) | 857 (45%) | 0.453 | 98 (43%) | 288 (47%) | 0.355 |
| African-American | 37 (11%) | 129 (7%) | 0.011 | 20 (9%) | 67 (11%) | 0.382 |
| Current smoker | 28 (8%) | 124 (7%) | 0.291 | 19 (8%) | 41 (7%) | 0.391 |
| Systolic blood pressure (mm Hg) | 136 ± 20 | 136 ± 19 | 0.847 | 136 ± 19 | 136 ± 19 | 0.909 |
| Diastolic blood pressure (mm Hg) | 73 ± 10 | 75 ± 10 | 0.001 | 74 ± 10 | 74 ± 10 | 0.379 |
| Ventricular rate (beats/min) | 71 ± 13 | 73 ± 14 | 0.016 | 71 ± 13 | 72 ± 14 | 0.332 |
| Maximum ventricular rate during atrial fibrillation, beats/min | 122 ± 30 | 104 ± 31 | <0.001 | 120 ± 30 | 109 ± 33 | <0.001 |
| Duration of atrial fibrillation ≥2 days | 118 (34%) | 1,446 (76%) | <0.001 | 78 (34%) | 392 (64%) | <0.001 |
| CHADS2 score ⁎ | 1.8 ± 1.1 | 2.0 ± 1.2 | 0.020 | 1.8 ± 1.1 | 1.9 ± 1.2 | 0.343 |
| CHA2DS2VASc score † | 3.8 ± 1.5 | 3.9 ± 1.4 | 0.232 | 3.7 ± 1.5 | 3.8 ± 1.4 | 0.332 |
| Hospitalization from atrial fibrillation | 227 (65%) | 841 (44%) | <0.001 | 142 (63%) | 371 (60%) | 0.539 |
| Hospitalizations duration (days) | 4 ± 4 | 2 ± 3 | <0.001 | 4 ± 4 | 3 ± 4 | 0.686 |
| Critical care duration (days) | 0.4 ± 1.2 | 0.2 ± 0.8 | <0.001 | 0.4 ± 1.2 | 0.3 ± 1.0 | 0.053 |
| Noncritical care duration (days) | 3.3 ± 4.0 | 2.1 ± 3.2 | <0.001 | 3.1 ± 3.8 | 3.1 ± 3.8 | 0.956 |
| Medical history | ||||||
| Coronary artery disease | 151 (44%) | 744 (39%) | 0.125 | 96 (42%) | 252 (41%) | 0.718 |
| Acute myocardial infarction | 64 (18%) | 359 (19%) | 0.847 | 40 (18%) | 122 (20%) | 0.475 |
| Valvular heart disease | 32 (9%) | 304 (16%) | 0.001 | 14 (6%) | 58 (9%) | 0.134 |
| Stroke or transient ischemic attack | 40 (12%) | 287 (15%) | 0.083 | 24 (11%) | 77 (13%) | 0.445 |
| Heart failure | 58 (17%) | 471 (25%) | 0.001 | 43 (19%) | 120 (20%) | 0.861 |
| Bradycardia | 38 (11%) | 162 (9%) | 0.144 | 22 (10%) | 58 (9%) | 0.903 |
| Diabetes mellitus | 59 (17%) | 328 (17%) | 0.909 | 40 (18%) | 107 (17%) | 0.932 |
| Hypertension | 234 (67%) | 1,309 (69%) | 0.599 | 143 (63%) | 401 (65%) | 0.572 |
| Peripheral arterial disease | 27 (8%) | 152 (8%) | 0.892 | 21 (9%) | 49 (8%) | 0.545 |
| Pacemaker | 34 (10%) | 151 (8%) | 0.248 | 23 (10%) | 60 (10%) | 0.865 |
| Cardioversion | 117 (34%) | 810 (43%) | 0.002 | 80 (35%) | 213 (35%) | 0.857 |
| Randomization to rhythm treatment | 161 (46%) | 969 (51%) | 0.117 | 117 (52%) | 285 (46%) | 0.174 |
| Antiarrhythmic drug failures | 49 (14%) | 309 (16%) | 0.318 | 34 (15%) | 92 (15%) | 0.988 |
| Symptoms during atrial fibrillation | ||||||
| Chest pain | 97 (28%) | 411 (22%) | 0.009 | 60 (26%) | 161 (26%) | 0.931 |
| Diaphoresis | 84 (24%) | 304 (16%) | <0.001 | 46 (20%) | 138 (22%) | 0.505 |
| Dizziness | 135 (39%) | 643 (34%) | 0.067 | 88 (39%) | 233 (38%) | 0.803 |
| Dyspnea | 172 (50%) | 1,031 (54%) | 0.109 | 118 (52%) | 314 (51%) | 0.795 |
| Edema | 54 (16%) | 421 (22%) | 0.006 | 43 (19%) | 110 (18%) | 0.717 |
| Fatigue | 176 (51%) | 1,093 (58%) | 0.019 | 120 (53%) | 319 (52%) | 0.781 |
| Palpitation | 209 (60%) | 838 (44%) | <0.001 | 129 (57%) | 360 (58%) | 0.674 |
| Panic | 53 (15%) | 163 (9%) | <0.001 | 26 (12%) | 74 (12%) | 0.824 |
| Syncope | 21 (6%) | 75 (4%) | 0.074 | 13 (6%) | 33 (5%) | 0.834 |
| Flutter | 71 (21%) | 841 (44%) | <0.001 | 47 (21%) | 250 (41%) | <0.001 |
| Other symptoms | 56 (16%) | 169 (9%) | <0.001 | 28 (12%) | 83 (14%) | 0.664 |
| Medications | ||||||
| Digoxin | 162 (47%) | 1,040 (55%) | 0.006 | 116 (51%) | 309 (50%) | 0.809 |
| β Blockers | 132 (38%) | 798 (42%) | 0.171 | 89 (39%) | 226 (37%) | 0.503 |
| Diltiazem | 108 (31%) | 574 (30%) | 0.729 | 77 (34%) | 182 (30%) | 0.222 |
| Verapamil | 30 (9%) | 193 (10%) | 0.388 | 24 (11%) | 58 (9%) | 0.615 |
| Aspirin | 213 (61%) | 380 (20%) | <0.001 | 112 (49%) | 278 (45%) | 0.277 |
| Heparin | 118 (34%) | 273 (14%) | <0.001 | 75 (33%) | 167 (27%) | 0.091 |
| Angiotensin-converting enzyme inhibitors | 106 (31%) | 723 (38%) | 0.008 | 68 (30%) | 204 (33%) | 0.384 |
| Diuretics | 134 (39%) | 887 (47%) | 0.006 | 98 (43%) | 247 (40%) | 0.421 |
| Lipid-lowering agents | 57 (16%) | 393 (21%) | 0.069 | 34 (15%) | 99 (16%) | 0.699 |
⁎ CHADS2 scoring system for risk of stroke in atrial fibrillation is based on the presence each of the following conditions (with points assigned to each of them are indicated in the parenthesis): Congestive heart failure (1), Hypertension (1), Age >75 years (1), and Diabetes mellitus (1), and a history of Stroke (2).
† CHA2DS2VASc scoring system for risk of stroke in atrial fibrillation is based on the presence each of the following conditions (with points assigned to each of them are indicated in the parenthesis): Congestive heart failure or left ventricular dysfunction (1), Hypertension (1), Age >75 years (2), Diabetes mellitus (1), a history of Stroke (2), Vascular disease (1), Age 65-74 years (1), Sex category (1 for female).
For descriptive analyses, we used Pearson chi-square and Wilcoxon rank-sum tests for prematch comparisons and paired-sample t tests for postmatch comparisons of baseline characteristics of patients with and without warfarin use, as appropriate. We used Kaplan–Meier plots and Cox regression analyses to determine associations between warfarin use and outcomes during follow-up. We conducted formal sensitivity analyses to quantify the degree of hidden bias that would need to be present to invalidate our conclusions based on a significant association between use of warfarin and all-cause mortality in matched patients. Subgroup analyses were conducted to determine the homogeneity of association between use of warfarin and all-cause mortality. To assess the generalizability of the findings of the present study based on trial-eligible AFFIRM participants 70 to 80 years old with AF to community-dwelling patients with AF in that age group, we compared baseline characteristics and outcomes of participants included in our study to patients with AF 70 to 80 years in the Cardiovascular Health Study (CHS). All statistical tests were 2-tailed with a p value <0.05 considered statistically significant and all data analyses were performed using SPSS 18 for Windows (SPSS, Inc., Chicago, Illinois).
Results
Patients (n = 843) had a mean ± SD age of 76 ± 3 years, 45% were women, and 7% were nonwhite. Before matching patients receiving warfarin were more likely to have heart failure and valvular heart disease, have higher CHADS2 scores, but similar CHA2DS2VASc scores. These and other baseline imbalances were balanced after matching ( Table 1 and Figure 1 ).
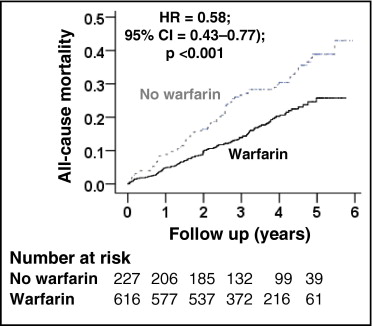
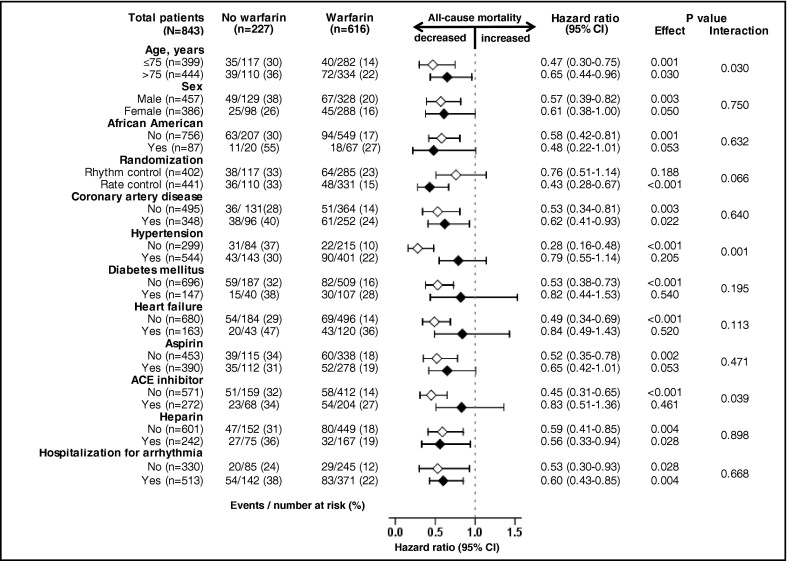
All-cause mortality occurred in 18% and 33% of matched patients on and not on warfarin, respectively, during 6 years of follow-up (hazard ratio [HR] when use of warfarin was compared to its nonuse 0.58, 95% confidence interval [CI] 0.43 to 0.77, p <0.001; Table 2 and Figure 2 ) . A hidden covariate that is a near-perfect predictor of mortality would need to increase the odds of warfarin use by 48% to explain away this association. The association of warfarin use with mortality in various subgroups of patients is displayed in Figure 3 . Associations of warfarin use with various cause-specific mortalities are presented in Tables 3 and 4 .
| All-Cause Mortality | Events (%) | Absolute Risk Difference ⁎ | HR (95% CI) | p Value | |
|---|---|---|---|---|---|
| No Warfarin | Warfarin | ||||
| Before matching (n = 2,248) | 347 | 1,901 | |||
| Unadjusted | 97 (28%) | 365 (19%) | −9% | 0.71 (0.57–0.89) | 0.003 |
| Multivariable adjusted † | — | — | 0.70 (0.54–0.91) | 0.007 | |
| Propensity adjusted ‡ | — | — | 0.67 (0.52–0.87) | 0.003 | |
| After matching (n = 843) | 227 | 616 | |||
| Propensity matched | 74 (33%) | 112 (18%) | −14% | 0.58 (0.43–0.77) | <0.001 |
⁎ Absolute risk difference was calculated by subtracting percent events in the warfarin group from that of the no-warfarin group (before values were rounded).
† Adjusted for all 45 baseline characteristics.
| Events (%) | Absolute Risk Difference ⁎ | HR (95% CI) | p Value | ||
|---|---|---|---|---|---|
| No Warfarin | Warfarin | ||||
| (n = 227) | (n = 616) | ||||
| Cardiovascular mortality | 27 (12%) | 56 (9%) | −3% | 0.80 (0.51–1.27) | 0.346 |
| Cardiac causes | 20 (9%) | 43 (7%) | −2% | 0.84 (0.49–1.43) | 0.516 |
| Arrhythmic | 12 (5%) | 24 (4%) | −1% | 0.76 (0.38–1.52) | 0.432 |
| Nonarrhythmic | 8 (4%) | 19 (3%) | −1% | 0.96 (0.42–2.20) | 0.931 |
| Vascular causes | 7 (3%) | 13 (2%) | −1% | 0.70 (0.28–1.75) | 0.442 |
| Noncardiovascular mortality | 40 (18%) | 48 (8%) | −10% | 0.45 (0.30–0.70) | <0.001 |
| Cancer | 14 (6%) | 24 (4%) | −2% | 0.61 (0.31–1.19) | 0.609 |
| Pulmonary | 8 (4%) | 10 (2%) | −2% | 0.43 (0.18–1.07) | 0.068 |
| Others | 17 (8%) | 15 (2%) | −6% | 0.33 (0.17–0.67) | 0.002 |
| All-cause hospitalization | 152 (67%) | 394 (64%) | −3% | 0.93 (0.77–1.12) | 0.423 |
| Cardiovascular causes | 103 (44%) | 252 (41%) | −3% | 0.90 (0.72–1.14) | 0.386 |
| Noncardiovascular causes | 104 (46%) | 258 (42%) | −4% | 0.90 (0.71–1.13) | 0.355 |
| Ischemic stroke | 17 (8%) | 26 (4%) | −4% | 0.57 (0.31–1.04) | 0.068 |
| Major bleeding † | 22 (10%) | 44 (7%) | −3% | 0.73 (0.44–1.22) | 0.229 |
Stay updated, free articles. Join our Telegram channel

Full access? Get Clinical Tree


