Patients with coronary artery disease and/or type 2 diabetes mellitus (DM) generally exhibit more epicardial adipose tissue (EAT) than healthy controls. Recently, it has been proposed that EAT affects vascular function and structure by secreting proinflammatory and vasoactive substances, thereby potentially contributing to the development of cardiovascular disease. In the present study, the interrelation of EAT, coronary vasomotor function, and coronary artery calcium was investigated in patients with and without DM, who were evaluated for coronary artery disease. Myocardial blood flow (MBF) was assessed at rest and during adenosine-induced hyperemia using [ 15 O]-water positron emission tomography combined with computed tomography to quantify coronary artery calcium and EAT in 199 patients (46 with DM). In this cohort (mean age 58 ± 10 years), the patients with DM had a greater body mass index, heart rate, and systolic blood pressure at rest (all p <0.05). Coronary artery calcium and the EAT volumes were comparable between those with and without DM. Both patient groups showed comparable MBF at rest and coronary vascular resistance. A lower hyperemic MBF and coronary flow reserve (CFR) and greater hyperemic coronary vascular resistance (all p <0.05) was observed in the patients with DM. A pooled analysis showed a positive association of EAT volume with hyperemic coronary vascular resistance but not with the MBF at rest, hyperemic MBF, or coronary vascular resistance at rest. In the group analysis, the EAT volume was inversely associated with hyperemic MBF (r = −0.16, p = 0.05) and CFR (r = −0.17, p = 0.04) and positively with hyperemic coronary vascular resistance (r = 0.26, p = 0.002) only in patients without DM. Multivariate regression analysis, adjusted for age, gender, and body mass index, showed an independent association between the EAT volume and hyperemic MBF (β = −0.16, p = 0.02), CFR (β = −0.16, p = 0.04), and hyperemic coronary vascular resistance (β = 0.25, p <0.001) in the non-DM group. In conclusion, these results suggest a role for EAT in myocardial microvascular dysfunction; however, once DM has developed, other factors might be more dominant in contributing to impaired myocardial microvascular dysfunction.
The present study investigated the effect of type 2 diabetes mellitus (DM) on the interaction of epicardial adipose tissue (EAT) and coronary artery calcium (CAC) as measured using computed tomography and vasomotor function determined by [ 15 O]-water positron emission tomography.
Methods
The present cohort study used data obtained from 199 patients, 46 with and 153 without DM, who were evaluated for coronary artery disease and therefore referred for CAC scoring and positron emission tomography myocardial blood flow (MBF) measurements using a hybrid positron emission tomography/computed tomography scanner (Gemini TF 64, Philips Healthcare, Best, The Netherlands). The patients were included retrospectively when the positron emission tomography findings (see positron emission tomography methods) did not indicate regional perfusion defects or otherwise signs of myocardial ischemia, defined by a coronary flow reserve (CFR) <2 in any vascular territory. In addition, patients were only included if electrocardiography did not show signs of a previous myocardial infarction, and echocardiography showed normal left ventricular function without wall motion abnormalities. The patients were classified as having DM when they had a positive history of DM currently treated with oral glucose-lowering agents and/or insulin. The exclusion criteria were atrial fibrillation, second- or third-degree atrioventricular block, symptomatic asthma, and pregnancy. In addition to DM, the coronary risk factors were assessed in all patients. Hypertension was defined as blood pressure ≥140/90 mm Hg or the use of antihypertensive medication. Hypercholesterolemia was defined as a total cholesterol level of ≥5 mmol/L or treatment with cholesterol-lowering medication. A positive family history of coronary artery disease was defined by the presence of coronary artery disease in first-degree relatives <55 years old for men or <65 years old for women. The need for written informed consent was waived by the institutional review board (local ethics committee) because of the nature of the study, which consisted solely of clinical data collection.
The patients were instructed to refrain from the consumption of products containing caffeine or xanthine for 24 hours before the scan. After a scout computed tomographic scan for patient positioning and 2 minutes after the start of intravenous adenosine infusion (140 μg/kg/min), 370 MBq of [ 15 O]-water was injected as a 5-ml (0.8 ml/s) bolus, followed immediately by a 35-ml saline flush (2 ml/s). A 6-minute emission scan was started simultaneously with the administration of [ 15 O]-water. Next, a respiration-averaged, low-dose computed tomographic scan (30 mA, rotation time 0.5 second, pitch 0.829, collimation 64 × 0.625) was acquired to correct for attenuation during normal breathing. Adenosine infusion was terminated after the low-dose computed tomographic scan. After an interval of 10 minutes to allow for decay of [ 15 O]-water and washout of the adenosine, an identical positron emission tomographic sequence was performed during at rest conditions. Using the 3-dimensional row action maximum likelihood algorithm, images were reconstructed into 22 frames (1 × 10, 8 × 5, 4 × 10, 2 × 15, 3 × 20, 2 × 30, and 2 × 60), applying all appropriate corrections. Parametric MBF images were generated, and quantitative analysis was performed using in-house developed software (Cardiac VUer). MBF is expressed as ml/min/g of perfusable tissue.
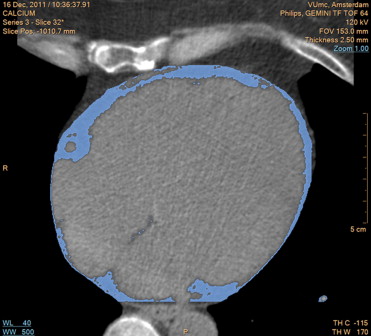
Patients underwent computed tomographic scanning for CAC and EAT. The CAC scores and EAT volumes were obtained during a single breath hold using noncontrast-enhanced computed tomography. Images were acquired using 64 × 0.625-mm section collimation, a 420-ms gantry rotation time, 120-kV tube voltage, and a tube current of 100 to 120 mA, depending on the patients’ body size. Coronary calcification was defined as plaque with an area of 1.03 mm 2 and a density of ≥130 Hounsfield units. The CAC scores were calculated according to the method described by Agatston et al. The EAT volume was measured using dedicated volumetric software (Extended Brilliance Workspace, Philips Healthcare, Best, The Netherlands). The most cranial slice taken into account was at the level of the pulmonary trunk, and the most caudal slice was identified as the last slice containing any portion of the myocardium. Within this area of interest, the pericardium was manually traced to distinguish epicardial from pericardial adipose tissue. EAT was defined automatically based on the Hounsfield units ( Figure 1 ). Contiguous 3-dimensional voxels between −190 and −30 Hounsfield units were identified as EAT voxels. The region within the pericardium was reconstructed into a 3-dimensional image, resulting in a quantitative measurement of the EAT volume. All computed tomographic scans were analyzed by experienced radiologists and cardiologists who were unaware of the positron emission tomographic results.
The rate pressure product (systolic blood pressure × heart rate) was calculated as an index of cardiac work both at rest and during hyperemia. The MBF at rest corrected for the rate pressure product was calculated by dividing the MBF by the rate pressure product and multiplying by 10 4 . CFR was defined as the ratio between the hyperemic and at rest MBF, and CFR was corrected for the rate pressure product as the ratio of the hyperemic and corrected at rest MBF. Coronary vascular resistance at rest and during hyperemia was calculated by dividing the mean arterial pressure by the MBF.
The normally distributed continuous variables are expressed as the mean ± SD; otherwise, the median with the interquartile range was used. Categorical variables are expressed as actual numbers or percentages. t Tests or Mann-Whitney U tests were used to determine the group differences for continuous variables and the chi-square test or Fisher exact test for categorical variables. Correlation coefficients were calculated using Pearson’s product moment correlation. Multivariate analysis was performed to determine whether the association between EAT and MBF was independent of traditional coronary risk factors. Statistical analyses were performed using SPSS Statistics software, version 20 (IBM, Armonk, New York). p Values <0.05 were considered statistically significant.
Results
The baseline patient characteristics are listed in Table 1 . The patients with DM had a greater body mass index and a greater frequency of hypertension and hypercholesterolemia. Consequently, the patients with DM used statins and angiotensin-II antagonists more often. Only the patients with DM used glucose-lowering therapy. No other medications differed between the patients with and without DM.
| Variable | All Patients (n = 199) | DM | p Value Between Groups | |
|---|---|---|---|---|
| No (n = 153) | Yes (n = 46) | |||
| Age (yrs) | 58 ± 10 | 57 ± 10 | 59 ± 12 | 0.35 |
| Men | 111 (56) | 86 (56) | 25 (54) | 0.87 |
| BMI (kg/m 2 ) | 26.9 ± 4.1 | 26.3 ± 3.8 | 28.9 ± 4.5 | <0.001 |
| Hypertension | 95 (49) | 66 (44) | 29 (63) | 0.03 |
| Hypercholesterolemia | 73 (37) | 46 (31) | 27 (59) | <0.001 |
| Current smoker | 81 (41) | 61 (41) | 20 (44) | 0.87 |
| Family history of CAD | 109 (56) | 86 (57) | 23 (50) | 0.40 |
| Statins | 121 (62) | 85 (57) | 36 (78) | 0.01 |
| β Blockers | 122 (62) | 93 (62) | 29 (63) | 0.90 |
| Aspirin | 136 (31) | 103 (69) | 33 (72) | 0.72 |
| ACE inhibitors | 34 (17) | 24 (16) | 10 (22) | 0.38 |
| At-II antagonists | 41 (20) | 25 (17) | 15 (32) | 0.02 |
| Calcium antagonist | 44 (22) | 32 (21) | 12 (26) | 0.35 |
| Insulin therapy | 14 (7) | NA | 14 (30) | NA |
The hemodynamic parameters are listed in Table 2 . At rest, the heart rate, systolic blood pressure, and rate pressure product were greater in the patients with DM. Hyperemic conditions elicited a significant increase in the heart rate and rate pressure product in both groups. Only in those without DM did hyperemia cause an increase in systolic blood pressure. No differences in heart rate, systolic and diastolic blood pressure, or rate pressure product during hyperemia were observed between the 2 groups.
| Variable | All Patients (n = 199) | DM | p Value Between Groups | |
|---|---|---|---|---|
| No (n = 153) | Yes (n = 46) | |||
| Heart rate (beats/min) | ||||
| At rest | 64 ± 11 | 63 ± 11 | 67 ± 10 | 0.02 |
| Hyperemia | 83 ± 13 | 83 ± 13 | 85 ± 15 | 0.44 |
| p Value | <0.001 | <0.001 | <0.001 | |
| Systolic blood pressure (mm Hg) | ||||
| At rest | 113 ± 19 | 112 ± 18 | 119 ± 21 | 0.04 |
| Hyperemia | 116 ± 20 | 115 ± 19 | 120 ± 22 | 0.12 |
| p Value | 0.05 | 0.01 | 0.60 | |
| Diastolic blood pressure (mm Hg) | ||||
| At rest | 60 ± 8 | 60 ± 8 | 61 ± 10 | 0.41 |
| Hyperemia | 60 ± 9 | 60 ± 8 | 61 ± 11 | 0.41 |
| p Value | 0.89 | 0.85 | 0.89 | |
| RPP (mm Hg/min) | ||||
| At rest | 7,275 ± 1,873 | 7,064 ± 1,824 | 7,977 ± 1,907 | <0.01 |
| Hyperemia | 9,729 ± 2,508 | 9,575 ± 2,326 | 10,299 ± 3,001 | 0.14 |
| p Value | <0.001 | <0.001 | <0.001 | |
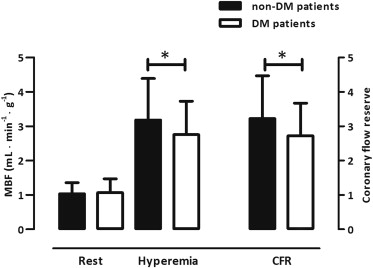
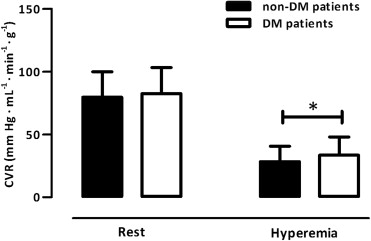
The MBF at rest was comparable between the 2 groups (p = 0.58; Figure 2 ). After correction for hemodynamic discrepancies (i.e., rate pressure product), however, the MBF at rest was diminished in those with DM (1.52 ± 0.57 vs 1.32 ± 0.38 ml/min/g, respectively; p = 0.03). Hyperemic MBF was impaired in those with DM (p = 0.03; Figure 2 ), just as was CFR (p = 0.02; Figure 2 ). Correction for the rate pressure product, however, abolished these differences in the CFR (2.21 ± 0.91 vs 2.15 ± 0.81, respectively; p = 0.71). The coronary vascular resistance at rest was comparable between the 2 groups (p = 0.42, Figure 3 ), but the minimal coronary vascular resistance was augmented in those with DM (p = 0.02; Figure 3 ).
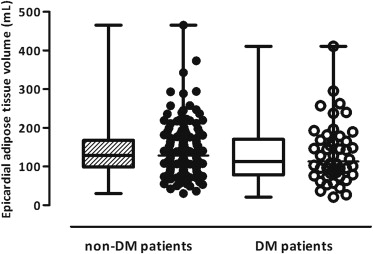
As shown in Figures 4 and 5 , the patients without and with DM had comparable EAT volumes (p = 0.31) and CAC scores (p = 0.13).
In a pooled analysis, the EAT volume was only significantly associated with hyperemic coronary vascular resistance (p = 0.02; Figure 6 ) but not with other vasomotor function parameters, such as hyperemic MBF ( Figure 6 ), CFR ( Figure 6 ), or CAC ( Table 3 ). In a separate analysis, in the non-DM group, EAT displayed significant univariate correlations with hyperemic MBF (p = 0.05, Figure 6 ) and CFR (p = 0.04, Figure 6 ), although the association with the minimal coronary vascular resistance became more apparent (p = 0.002, Figure 6 ). Multivariate regression analysis (adjusting for age, gender, and body mass index) revealed an independent association between the EAT volume and hyperemic MBF (β = −0.19, p = 0.01), CFR (β = −0.16, p = 0.04), and hyperemic coronary vascular resistance (β = 0.25, p <0.001). In patients with DM, the EAT volume was not related to any perfusion parameter ( Figure 6 ).


